Top 5 Tools for Advertising Reporting
Never run paid advertising campaigns without preparing reports in advance so you can see the real efficiency of your investments. Wise marketers prepare report templates before running campaigns. Other marketers first waste their budgets, then still prepare reports in the end.
In this article, you’ll learn what your reports should look like and how to create them. You’ll also discover how to build reports easily, avoid extra manual work, and automate the entire process using the five most popular analytics software.
Efficient Campaign Reporting!
Unlock insights to optimize your campaigns. Schedule a consultation now!
Why advertising reports are important
Advertising tables, charts, and dashboards are necessary for marketers to report the work they’ve done. But they have another important mission — helping with management decisions. The contents of an ad report should depend on who is going to use it, how often, and why.
Information an advertising report should include
Before you start creating a report, you need to figure out which metrics readers of your report are interested in. They should correspond to your business goal. For example:
- If your goal is to increase the number of advertising clicks, your report should contain the number of clicks and the cost per click (CPC).
- If your goal is to increase conversions, your report should contain the cost per action (CPA) and the number of orders (or other conversion actions).
- If you want to increase return on marketing investment (ROMI), your report should contain ad spending, revenue, and average check size.
Read also: Main key performance metrics that suit the majority of companies and are mandatory for digital marketing and web analytics
It’s preferable to include ad cost data in all reports on paid advertising channels, as without it it’s difficult to decide which campaigns should be scaled and which shouldn’t.
Try to focus on the main part of a report and don’t include too much data in reports, as this can make them unclear for the end user. Instead of one universal dashboard, create several separate dashboards. For example, paid traffic specialists and marketing directors usually need reports with different metrics, for different periods, and with different levels of detail.
Parameters and metrics in a report should be interrelated and logically sequenced; otherwise, the reader can make erroneous conclusions. For example, if your CPA has changed, you should show conversion dynamics in a corresponding row.
To make a report more visual and comprehensible for users, you can:
- Add context. Show market trends, data on competitors, the influence of seasonal demand, stock — everything that influences your advertising campaigns’ efficiency.
- Add textual comments to figures and charts in reports to explain how, when, and as a result of which actions an indicator was achieved.
- Think of data visualization. Charts and diagrams on dashboards make your story more comprehensible than figures in rows.
How often you should prepare reports
The period between reports should depend on who is going to use the reports and which decisions will be made based on them. These decisions can be divided into four levels:
- Vision decisions are made by the board of directors, CEO, and marketing director. They’re responsible for brand investments and distributing the budget between online and offline channels. Usually, decisions on these matters are made annually or bi-annually based on market and consultant research.
- Strategic decisions are made by marketing and ecommerce directors, usually monthly. These directors are responsible for distributing the budget across channels and defining top-level KPIs. At this level, it’s important to understand the mutual influence of channels and make strategic decisions on how to develop each channel.
- Tactical decisions are usually made once a week by paid traffic managers. Traffic managers are responsible for distributing the budget among campaigns and advertising groups, and their decisions are aimed at clarifying KPIs and campaign goals. At this level, the budget for each channel has already been allocated, so the task is to decide which campaigns you should spend it on, monitor the results, and quickly disable ineffective campaigns.
- Execution decisions occur in near real time — for example, the decision to evaluate the contribution of an ad or keyword. Most often, such decisions are made within advertising services (Google Ads, Facebook Ads, etc.) by an advertising specialist.
Read also: Marketing report templates and examples of daily, weekly, and monthly reports
How to read reports
Before making decisions based on reports, you should study those reports attentively and ask the following questions:
- What has changed in comparison to the previous period?
- If the dynamics are positive, what’s the reason for that and how can we keep it up?
- If the dynamics are negative, why is that and how is it possible to improve them?
- Why have we received these results and what should we do next month?
- Do we have growth zones? What are they? (Increasing the budget? Using new channels?)
Answering these questions will help you understand what problems are important to solve and what actions you should take so you can move to the next step.
Why it’s important to automate reporting
If you still build advertising reports manually — for example, in Google Sheets, Excel, or Google Analytics — you risk not only your time but also your data quality. Low-quality data is the primary reason for erroneous decisions:
- In Google Analytics, 10% to 20% of conversions are lost, and data is aggregated in the API and sampled in reports.
- Combining data in Google Sheets or in a standard database leads to regular system failures and subtle errors.
- Data in advertising services is stored in different formats and changes retrospectively, leading to discrepancies in reports.
- As a result, businesses lose time and money.
Since the quality of any report depends on the quality of the data it’s built on, we recommend using a specialized tool such as OWOX BI to collect and combine data. With OWOX BI, you can collect marketing data for reports of any complexity in secure Google BigQuery cloud storage without the help of analysts and developers.

Top 5 tools for ad reporting
We’ve prepared a list of five tools you can use to automate and simplify your ad reporting. Find out how they work, what they don’t cover, and what businesses they suit.
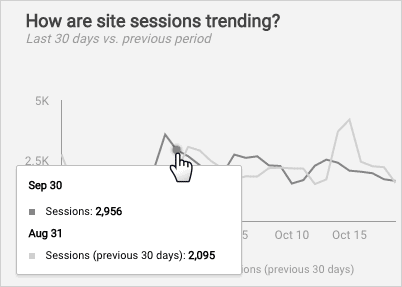
1. Google Analytics
Google Analytics is one of the most popular digital ad reporting tools. It collects data from users’ HTTP requests, data on browsers/operating systems, and cookies using a Google Analytics Tracking Code. The collected data then goes to Google Analytics servers as a list of parameters, and Google Analytics analyzes these parameters and builds reports. You can create advertising reports in Google Analytics using data from your Google Ads account.
However, Google Analytics doesn’t account for data from your CRM and non-Google services unless you import it manually, and it only processes data within 24 to 48 hours.
The free version of Google Analytics is suitable for small and mid-sized businesses. If you’d like to analyze large volumes of data, consider upgrading to Google Analytics 360 or switching to another tool.
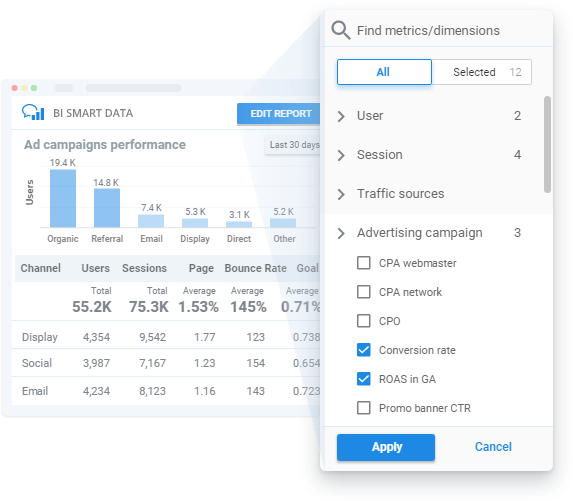
2. OWOX BI
OWOX BI automatically collects your data from various online and offline sources in one location (for example, Google Analytics or Google BigQuery). After you’ve collected data, you can easily build reports in OWOX BI Smart Data or import your collected data to Google Data Studio or another reporting tool. To build advertising reports with OWOX BI Smart Data, you don’t have to know SQL — you can just select the metrics and parameters you want to see in your report and ask questions in natural language.
With OWOX BI, you can use the following data types from Google BigQuery to build your advertising reports:
- Data on user behavior (from your website, Google Analytics, or AppsFlyer)
- Data on ad costs (from your advertising accounts)
- Data on revenue (from your CRM)
- Data on email campaigns
Based on this data, you can create reports from templates or build your own reports with custom metrics using a simple report builder. OWOX BI collects any amount of data in the same structure used by Google Analytics and processes it in real time.
We’ve prepared a few tips on using OWOX BI Smart Data:
- How to connect your data for Smart Data reports
- Selecting data sources for Smart Data reports and how to get your data to Google BigQuery
- How to get detailed info about the performance of each of your ad campaigns, traffic channels, and channel groupings with ad campaign performance report
Book a free demo to see how Smart Data can answer your questions and find insights on your data.
3. Google Data Studio
Google Data Studio is one of the most widely used free report building tools. You can connect your data to it and easily build reports based on Data Studio templates. With Data Studio reports, you can avoid running marketing campaigns that lead to unavailable goods, analyze your budget and advertising efficiency for goods in different groups, and compare how many times users added goods to cart and how many times they placed an order for goods in different categories.
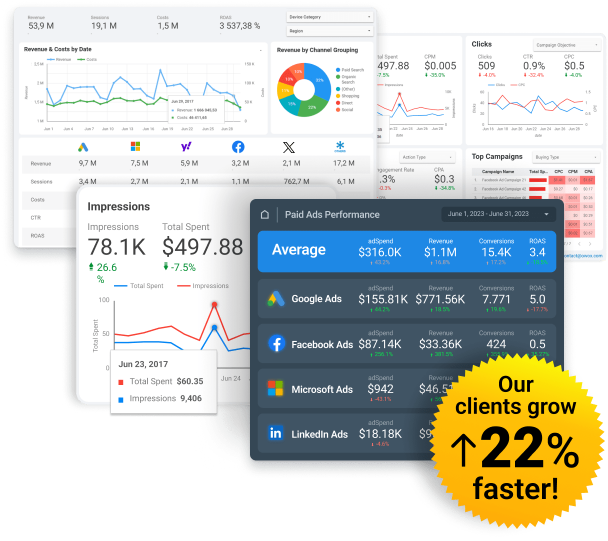
To create an advertising report with Google Data Studio, you can select the performance report template — a one-page dashboard showing all your paid ads with a column for the main KPIs. This dashboard has multiple filter and segmentation options so you can compare advertising channels and see how efficient they really are.
However, Data Studio applies limits on collected data and doesn’t come with official Google support.
Google Data Studio is best suited for small and medium-sized businesses that have one or two data sources. With three or more sources, Data Studio blends the results and performs slower. To avoid this issue, you can integrate Google Data Studio with other reporting tools such as OWOX BI.
4. Stitch
Stitch is an ETL service that you can connect to more than 130 data sources, including to databases such as MySQL and MongoDB and SaaS tools such as Salesforce and Zendesk. Stitch then replicates all selected data to a data warehouse. The final step of each Stitch replication job is called Loading, when Stitch loads extracted data into your destination in the form of a report. You also can build advertising reports based on inventory, sales, and purchasing data by integrating with analysis tools such as Google Data Studio, Tableau, and Power BI.
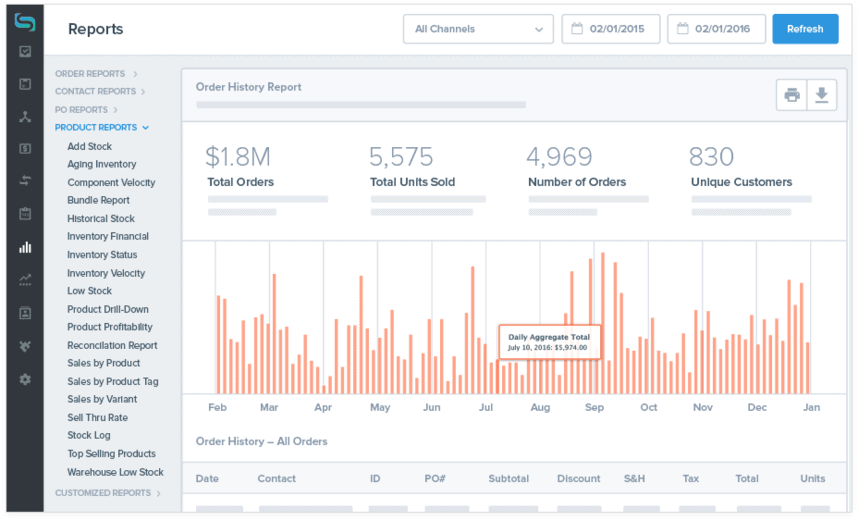
However, Stitch doesn’t offer support for SQL Server and Azure, and it provides a limited number of options for data extraction, warehousing, and loading.
Stitch is suitable for businesses of any size, up to enterprises.
5. Xplenty
Xplenty is a cloud-based ETL service that allows you to process data via reports and visualizations like charts and graphs. Xplenty automates data flows across a wide range of sources and destinations and cleans, normalizes, and transforms your data. You can use it to connect to more than 100 data stores and SaaS applications such as Salesforce, Google Analytics, Google Adwords, Zendesk, and HubSpot and create advertising reports based on data you’ve connected.
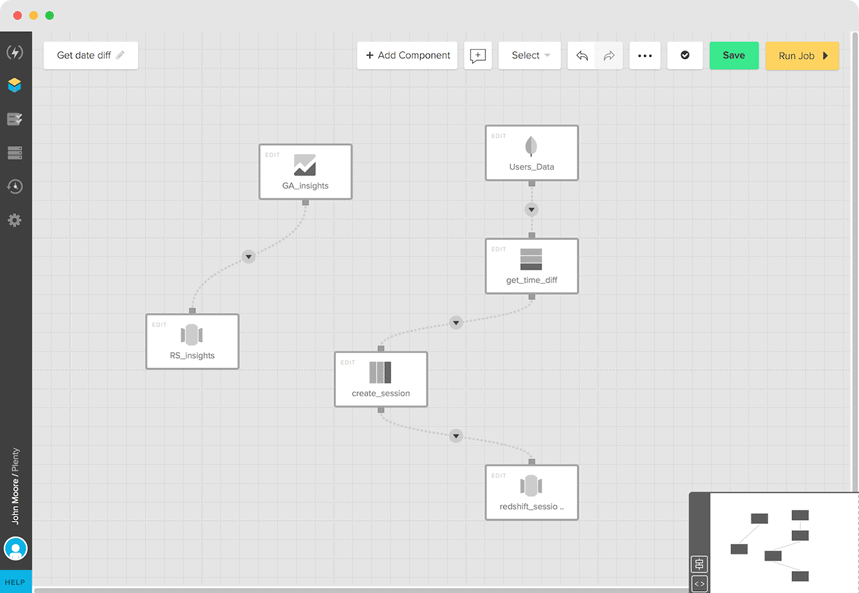
Still, you should consider that Xplenty is a rather complex tool to learn.
Xplenty is suitable for large businesses and IT departments.
Conclusion
You shouldn’t waste lots of your time manually preparing reports. Automate and simplify your ad reporting using specialized tools. Whether you’re a PPC professional who’d like to increase your efficiency or a CMO fearful of draining your ad budget, try one of these tools to ensure your campaigns are effective and consistently successful.
FAQ
-
How to evaluate the impact of media advertising on marketing in general?
To find out how media campaigns affect your sales funnel, you need to combine impression data with data on website visits and sales from your CRM. You can do this with the help of OWOX BI or Google Ads Data Hub -
What does attribution mean in advertising?
The goal of attribution in advertising is to define how the value of a conversion is distributed across channels that move the user through the funnel.