Top 21 Data Analysis Tools of 2024
![]() Get in-depth insights
Get in-depth insights
![]() Get in-depth insights
Get in-depth insights
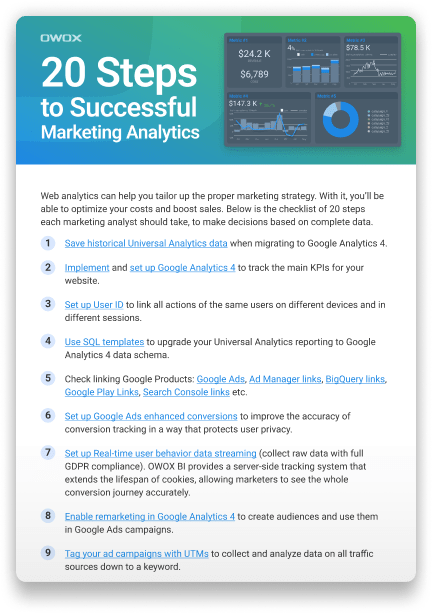
20 Steps to Successful Marketing Analytics
Building a good marketing strategy begins with data analysis. After all, you can’t improve anything without assessing its starting point. Luckily, you don’t have to do it manually — there are a bunch of specialized data analysis tools that can help you automate data analysis to save time.

In this article, updated in January 2024, we’ll review the 21 most popular data analysis tools and help you choose the one that suits your specific business needs.
What is data analysis?
In marketing, data analysis is the process of organizing, explaining, and interpreting data to answer questions regarding a marketing strategy, resolve issues with that strategy, and multiply its advantages.
You might ask the following questions as the first part of data analysis:
What’s the most effective advertising channel?
How many unique visitors does my website have on average per day, week, or month?
Why is our conversion rate this month?
What channels should we focus on to increase revenue?
Data analysis is a must for marketers. It’s how they can avoid guesswork and see what areas of their marketing performance require special attention and improvements. Marketers can use data analysis to uncover trends, patterns, and valuable insights in order to adjust advertising campaigns and get more revenue.
By analyzing data correctly, you can achieve the following marketing goals:
Decrease ad spending. Find ineffective campaigns, stop investing in them, reduce adwaste and focus on revenue-generating channels and campaigns.
Increase revenue from visitors. Predict LTV (customer lifetime value) and the conversion probability; offer products visitors really need by enhancing the level of personalization.
Make data-informed decisions. Get high-quality data to have a solid basis for making timely decisions and be sure of your next steps.
Data analysis tools for marketing differ in their level of detail and methods of interpretation. Generally, they focus on gathering, analyzing, or visualizing data. The number of options on the market is quite large, and it’s not that simple to find the perfect tool. To help you narrow down your list, we suggest things you should consider when selecting a data analysis tool.
Uncover in-depth insights
A comprehensive list of analytics resources
Download nowBonus for readers
What are Data Analysis Tools?
Data analysis tools are software applications and platforms that are crafted to use the power of data, turning raw numbers into actionable insights. For every visionary researcher, data scientist, and market analyst, these tools unveil hidden market trends, consumer behaviors, and untapped opportunities.
Businesses, that want to lead the market, not just follow, recognize the unparalleled advantage these tools bring.
Imagine being able to predict market shifts, tailor your strategies to individual consumer preferences, and make decisions that are not just informed but inspired.
How to Leverage Data Analysis Tools?
The primary goal of using data analysis tools is to find meaning in data and use this meaning to improve your marketing strategy.
Tools for data analysis in marketing research help in the following:
Performance Measurement: These tools for data analysis allow organizations to track and measure the performance of various metrics and Key Performance Indicators (KPIs). By analyzing performance data, businesses can evaluate their progress toward goals and objectives.
Identifying Trends and Patterns: Data analysis tools can uncover trends and patterns within datasets that might not be immediately apparent. These insights can help businesses understand customer behavior, market trends, and other factors influencing their operations.
Decision Making: Tools for data analysis provide the necessary information and insights to support data-driven decision-making. By examining trends and patterns, businesses can identify growth opportunities, optimize processes, and allocate resources effectively.
Optimization: Businesses can optimize various aspects of their operations, such as marketing campaigns, supply chain management, and website performance, by analyzing relevant data and making data-driven improvements.
Predictive Analytics: Some tools for data analysis incorporate predictive analytics, allowing businesses to forecast future trends and outcomes based on historical data and patterns.
Manually collecting, cleaning, and arranging data takes a lot of time, and the probability of human mistakes is high. Poor data quality can result in losing 21% of your marketing budget, and according to Gartner, businesses all over the world lose an average of $15 million per year for this reason.
You can spend hours finding errors in piles of data with no guarantee that the results will be precise. To save time and make sure your data is accurate, you need to perform automated analysis using specialized tools.
Before selecting a tool, narrow down the list of possible options by defining the following:
the types of data you want to analyze
the goal you’d like to achieve with the help of analysis
the level of detail you would like in your analysis
Close the Loop between Marketing & Revenue
Merge advertising, web analytics, and internal data in one report for a comprehensive overview of your performance

How to choose the right Data Analysis Tool for Your Business?
In the realm of Big Data, the sheer volume of options can be overwhelming. While there's no one-size-fits-all solution, certain criteria can guide businesses to make informed decisions. Here's a structured approach to help you navigate the landscape of marketing data analysis tools:
1. Align with Business Objectives:
- Understand your company's short-term and long-term goals.
- Ensure the tool serves immediate needs and is adaptable to future challenges.
- Prioritize platforms that align closely with your desired outcomes.
2. Budgetary Considerations:
- Understand all associated costs, including subscriptions, scaling, and any hidden charges.
- Compare the value offered versus the investment required.
- Be wary of platforms with unclear pricing structures.
3. User Experience is Key:
- A good tool should cater to a range of user expertise levels.
- Prioritize intuitive interfaces, especially for non-technical users.
- The ability to easily create, interpret, and share findings is vital.
4. Integration Capabilities:
- Determine whether a standalone or integrated solution aligns better with your organizational setup.
- The chosen platform should play well with existing software and applications.
- Ensure data portability, allowing seamless transfers between platforms if necessary.
5. Prioritize Scalability:
- Your chosen tool should be flexible, catering to both current operations and future expansion.
- Cloud-based options often provide dynamic scalability, adjusting as per your needs.
- Cost-effectiveness during growth phases can be a pivotal factor.
6. Never Compromise on Security:
- Assess the tool's security credentials and the vendor's track record.
- Implement robust internal security protocols, defining data access levels.
- Ensure the tool adheres to industry-standard data protection regulations.
In conclusion, while the perfect data analysis tool might vary based on individual business needs, the criteria above provide a roadmap. By understanding these considerations and aligning them with organizational goals, businesses can position themselves for success in the data-driven landscape.
Now let’s take a look at the most popular tools for data analysis in marketing research.
Top 21 data analysis and data vizualization tools
We’ve prepared a list of the best tools for data analysis to collect, analyze, and visualize marketing data. For each tool, we describe how it works, what its key characteristics are, what the pros and cons are, and who are they suitable for the most.
1. Google Analytics 4

Google Analytics 4 (GA4) is a data analysis tool by Google that provides insights into user behavior across websites and apps. Think of it as a fresh take on how Google views website and app analytics.
So, instead of the old-school session-based tracking we got used to with Universal Analytics, GA4 is all about events. This means it's capturing the tiny details, like when users scroll, watch a video, or click on that fancy button you added.
Now, what really spices things up is the user-centric approach. GA4 tries to understand your visitors better by seeing how they interact across devices and different sessions. It's like piecing together a user's journey with your brand.
But wait, there's more. GA4 isn't just about collecting data to google servers; it's about making it smarter.
With some machine learning magic, it offers automated insights, spots anything unusual, and can even predict stuff like how much you might earn from a certain group of users.
Note: The level of GA4 data accuracy is still a firing question, but from the features stand point it really stands out from the other free tools.
And for those who love diving into reports, GA4 has shaken things up.
It's not designed for marketers, buf if you are a data professional - you’ll find GA4 more flexible, allowing you to customize your reports based on what's essential for the business. So, in a nutshell, GA4 is like that new shiny, upgraded model of your favorite car, packed with features you didn't know you needed.
Google Analytics 4 standard is free to use, while Google Analytics 360 is priced.
Pros:
Event-Based Tracking: More flexibility in tracking user interactions.
Cross-Device Tracking: It's built for both app and web tracking right from the get-go, offering a holistic view of user behavior.
Machine Learning Insights: GA4 can identify data trends and make predictions about user actions.
Flexibility in Reporting: If you tech-savvy, you can build report, and see data in ways that suit your specific business needs.
Improved User Journey Reporting: With its user-centric approach, it gives a more comprehensive view of how users interact across sessions and devices.
Cons:
Short Data Retention: Can retain user-level data for only up to 14 months.
Learning Curve: For those accustomed to Universal Analytics, there's a significant learning curve to understand and utilize GA4 fully. It’s not a simple go-to tool anymore.
Migration Challenges: Transitioning from Universal Analytics to GA4 requires significant setup changes and historical data won't automatically transfer.
Different Metrics: The metrics and dimensions from Universal Analytics you were familiar with are absent or have been renamed, which can be confusing.
In-Depth Reporting: While it offers more customizable reporting, it might take time to set up complex reports that used to be standard in Universal Analytics.
Lack of trust in Attribution Models: Data-driven attribution is certainly a black box and not suitable for managers who want to know ‘why’.
2. OWOX BI

OWOX BI is an all-in-one marketing analytics platform that automatically collects data from multiple online and offline sources in one place — into Google BigQuery — where marketers and analysts can work with it. With OWOX BI you can collect, merge, clean, and organize data from ad services, website user behavior, CRMs, offline stores, and other sources. You can then use it to prepare data for reporting, visualize with ready-made templates or build your own reports with custom metrics to measure what matters the most to your business.
Save 70+ hours on data preparation
Spend time reaching your monthly KPIs instead of collecting the data or building reports

One of the big benefits of OWOX BI is that to do this, you don’t need to code or know SQL — you can build any report you want with premade no-code templates and just connect report data to a dashboard template.
With OWOX BI you’ll:
Discover the True Acquisition Sources: Unlike other platforms, OWOX BI enables real-time user behavioral data collection. So you can overcome cookie lifespan restrictions and GA4 limitations.
Find out What Drives your KPIs: Identify your most profitable channels, allocate your advertising budget, and fine-tune your campaigns to maximize ROI. Stay ahead of the competition with data-backed optimizations.
Stay Compliant with Privacy Regulations: Our real-time cookieless on-site event streaming respects user privacy while ensuring GDPR compliance.
Get Unmatched Time-to-Value: Get 20+ essential fully-automated reports in less than 2 days. Our ready-to-use dashboard templates provide fully customizable, automatically updated reports in one place faster than ever.
100% Data Ownership: Never worry about your data ending up in the wrong hands again. Unlike Google Analytics which uses your data to serve its ad platform, OWOX BI guarantees 100% data ownership for every client.
Collaborative Insights Delivery: Enable cross-team report collaboration by sharing relevant insights and reports across your organization. Empowering your colleagues to make informed decisions and drive growth together.
Establish a Data Source of Truth: No more scattered reports and conflicting numbers. Establish a unified data storage that ensures seamless alignment of all your marketing data. Experience reliable data accuracy and consistency.
Embrace Data-Driven Decision-Making: Leave behind the frustrations and embrace a future where data-driven decisions lead to exceptional outcomes. Take the first step towards transformative success with OWOX BI.
Automate your digital marketing reporting
Manage and analyze all your data in one place! Access fresh & reliable data with OWOX BI — an all-in-one reporting and analytics tool
3. Mixpanel
Mixpanel is a user behavior analytics tool that allows businesses to track, analyze, and respond to user activities on their websites.
Its primary focus is on event-based tracking, which means it monitors specific actions users take, like clicking a button, opening an app, or completing a purchase. This provides a granular understanding of user behavior, enabling businesses to enhance user experience, optimize marketing efforts, and make data-informed decisions.
Unlike traditional analytics tools that primarily concentrate on pageviews, Mixpanel dives deep into user interactions, tracking sequences of actions, funnels, and cohorts. This makes it particularly valuable for mobile apps, SaaS platforms, and other interactive digital products.
Key features of Mixpanel include:
Funnels: Helps in visualizing the user journey, identifying where users drop off in a sequence of actions.
Retention Analysis: Understand how often users come back after a particular event or milestone.
User Profiles: Offers detailed profiles of users, including their actions, properties, and engagement history.
A/B Testing: Allows for experimentation to test different user experiences and understand which one performs better.
ML Insights: Uses machine learning to automatically show trends and anomalies in user behavior.
The Mixpanel data model is built on the following key variables:
event — a user action on a website
property — a detail about an event
user profile — a collection of information about an individual user
While Mixpanel provides powerful insights into user behavior, it's also known for its complicated learning curve and high price point compared to other analytics tools. However, businesses that want a deep understanding of user interactions and the ability to experiment with user experience often find great value in Mixpanel.
Pros:
Event-Driven Analytics: Tracks user actions and events in-depth.
User Retention Analysis: Offers insights into user return rates and behaviors.
Real-time Data: Provides data updates in real-time.
Flexible Visualization: Allows for custom dashboard creation.
A/B Testing: Built-in tools for testing and optimization.
Cons:
Cost: This can become expensive as data points increase.
Learning Curve: Some users find the interface initially challenging.
Data History: Only tracks events from the implementation date.
Limited Integrations: Not all third-party tools integrate seamlessly.
Complex Set-Up: Advanced tracking might require technical expertise.
4. Kissmetrics

Kissmetrics is a business intelligence platform allowing you to analyze user behavior on your website, categorize audiences, and store data in one centralized platform. The Kissmetrics JavaScript Library automatically tracks several events: visited site, form fields, ad campaign hit, search engine hit, and page view. It also allows you to track customer profiles, reports, events, and campaigns, as well as users’ anonymous activity before they sign up.
Pros:
User-Centric Analysis: Detailed user journey and behavior tracking.
Cohort Analysis: Offers insights into segmented user groups over time.
A/B Testing: In-built tools for optimization and testing.
Retention Tools: Helps analyze and improve user retention.
Cons:
Cost: It can be pricier compared to some competitors.
Learning Curve: This might be challenging for some new users.
Data Lag: There can be delays in data appearing.
Limited Integrations: Not all third-party tools integrate seamlessly.
UI Concerns: Some find the interface less intuitive than alternatives.
5. Weborama

Weborama is a marketing technology company that provides behavioral targeting services and advertising analytics based on a semantic analysis engine. With the Weborama BigFish semantic AI platform, you can analyze website conversations, user behavior, and consumer insights. With the Weborama BigSea dataset, you can create a consumer database and build a relevant digital behavior score for each user.
Pros:
Rich Data Solutions: Offers a variety of data analytics and management tools.
Audience Profiling: Helps in segmenting and understanding user behaviors.
Customization: Allows for bespoke solutions for businesses.
Cons:
Learning Curve: The platform might be challenging for beginners.
Integration Concerns: Not all third-party tools might integrate perfectly.
Cost: Pricing can be on the higher side for some businesses.
UI/UX: Some users might find the interface less intuitive.
Support Issues: Mixed feedback on the speed and effectiveness of customer support.
6. Datorama

Datorama is an AI-powered business intelligence and analytics platform with built-in reporting, insights, and automated predictions on goal completion. It collects and merges marketing data in one centralized platform, analyzes data across different channels and campaigns, and builds reports based on the results.
Pros:
Unified Platform: Integrates data from various sources for centralized reporting.
AI Insights: Offers AI-driven insights for better decision-making.
Custom Dashboards: Allows for tailored reporting and visualizations.
Data Harmonization: Standardizes metrics across different platforms.
Scalability: Adapts to both small businesses and large enterprises.
Cons:
Learning Curve: This can be complex for new users.
Cost: Premium tiers and features can be pricey.
Integration Challenges: Some third-party data sources might not integrate seamlessly.
Customization Complexity: Deep customizations may require technical expertise.
Support Variability: Mixed feedback on the responsiveness of customer support.
7. Supermetrics

Supermetrics is a cloud-based ETL platform that collects and analyzes your marketing data using APIs and sends it to storage or to a visualization, reporting, or BI tool of your choice. Supermetrics allows you to automate reporting and transfer data where you want it.
Pros:
Ease of Integration: Pulls data easily into tools like Google Sheets and Excel.
Supports Many Platforms: Integrates with a variety of marketing and advertising services.
Automated Reporting: Streamlines report generation process.
Data Freshness: Scheduled refreshes keep data up-to-date.
Cons:
Limited Data Preparation Capabilities: mainly focused on simple one-source reports in Looker Studio or Excel / Google Sheets.
Unblended Data: you’ll need to build multiple reports to measure the same things, relying on third-party tools data merging.
Data Limits: API call restrictions can limit large data fetches.
Learning Curve: Some features might be challenging for new users.
Complex Formulas: Might get intricate for advanced requirements.
8. Funnel

Funnel is an ETL platform that allows you to collect data and automatically process it by cleaning, mapping, and grouping it. Based on this processed data, you can create reports and dashboards with key metrics you select and send the collected data to a data warehouse, Google Looker Studio, or some other tool (Funnel offers about 500 integrations).
Pros:
Data Integration: Easily connects to numerous advertising and marketing platforms.
Automated Reporting: Simplifies and automates data aggregation and reporting.
Customizable Dashboards: Offers flexibility in visualization and reporting.
Data Transformation Tools: Allows for data cleaning and harmonization.
Cloud-Based: Accessible from anywhere with no software installation.
Cons:
Cost: It can be more expensive than some competitors.
Learning Curve: New users might find the platform initially challenging.
Integration Gaps: Not all platforms or data sources might be supported.
Customization Limitations: Some configurations can be less intuitive.
Performance Concerns: Large data sets might cause slowdowns.
9. Improvado

Improvado is a cloud-based ETL platform that collects data from different sources and arranges it using a REST API. Next, it analyzes data by merging tables, making calculations, and modifying the data structure. Interpreted data then goes either to external data storage (Google BigQuery, Redshift, PostgreSQL, etc.) or to the internal Improvado database.
Pros:
Versatile Integration: Connects with many marketing platforms for unified reporting.
Real-Time Reporting: Provides up-to-date data insights.
Customizable Dashboards: Flexible visualization options.
Data Granularity: Offers detailed breakdowns for in-depth analysis.
Cloud-Based: No need for on-premises infrastructure.
Cons:
Cost: Premium features can be on the pricier side.
Learning Curve: Initial setup and understanding can be complex.
Integration Challenges: Some third-party platforms might pose integration issues.
UI Concerns: Some users might find the interface less intuitive.
Support Feedback: Mixed reviews on the responsiveness and effectiveness of customer support.
10. AppsFlyer

AppsFlyer is a mobile marketing analytics tool that allows you to create dynamic cohort, retention, and raw data reports, as well as custom dashboards and live alerts. With AppsFlyer, you can track the performance of your paid mobile media sources and their organic activity in real-time.
Pros:
Deep Attribution: Tracks user interactions across multiple touchpoints.
Wide Integration: Supports many networks and platforms.
Real-Time Data: Offers up-to-the-minute insights.
Fraud Protection: Provides tools to detect and prevent fraudulent activities.
Retargeting Analysis: Allows for insights into retargeting campaigns.
Cons:
Cost: It can be more expensive than some alternatives.
Complexity: It might be overwhelming for beginners.
Integration Concerns: Some platforms might pose integration challenges.
Data Overload: The depth of data can be challenging to navigate.
Support Issues: Mixed reviews on support response times and effectiveness.
It's essential to weigh these pros and cons based on specific mobile marketing needs when considering AppsFlyer.
Uncover in-depth insights
20 Steps to Successful Marketing Analytics
Download nowBonus for readers
11. Adobe Analytics

Adobe Analytics allows you to merge and analyze data on customer journeys in real time based on online and offline sources. Adobe Analytics offers various types of analysis, such as ad hoc (custom), cohort, and flow analysis, which allows you to track the most important aspects of the user journey.
Pros:
Deep Insights: Provides granular data and robust segmentation.
Integration: Seamlessly integrates with other Adobe products and platforms.
Customization: Allows for tailored reporting and dashboards.
Advanced Features: Offers features like predictive analytics and anomaly detection.
Multi-Channel Data: Captures user journeys across devices and touchpoints.
Cons:
Cost: Generally pricier than many competitors.
Complexity: This can be overwhelming for beginners.
Setup & Maintenance: Requires technical expertise for implementation.
Learning Curve: Steep, especially for advanced features.
User Interface: Some users find it less intuitive than alternatives.
Remember to evaluate Adobe Analytics based on specific business requirements and goals.
12. Fivetran

Fivetran is an automated data integration and analytics ETL tool that allows you to merge data from multiple sources in one platform.
Pros:
Automated Integrations: Simplifies data connections and requires minimal maintenance.
Broad Connectors: Supports a wide variety of sources and destinations.
Scalability: Easily handles both small and large datasets.
Real-time Sync: Offers near real-time data synchronization.
Reliability: Ensures consistent data replication with built-in error handling.
Cons:
Cost: This can be expensive, especially for large data volumes.
Customization Limits: Pre-built connectors might lack specific custom functionalities.
UI Concerns: Some users find the interface less intuitive.
Transformation Capabilities: Limited compared to specialized ETL tools.
New Integrations: Waiting times for new connectors can be long.
13. Looker Studio ( Formerly Google Data Studio)

Perhaps the most popular data visualization tool is Looker Studio (formerly Google Data Studio) — a visualization and reporting tools for data analysis that allows you to set up a data connector to collect, filter, and compare data, set up automated interactive dashboards, and share reports with your colleagues. Also, you can create visualizations in Explorer — a separate space to explore collected data in detail.
Pros:
Affordability: The basic version is free and suitable for small teams.
User-Friendly: Intuitive dashboard, drag-and-drop features, and templates for ease of use.
Customizable: Offers versatility in report design with various fonts and colors.
Broad Data Access: Connects to numerous data sources, including Google platforms.
Collaboration: Easy report sharing and integration with other Google platforms.
Cons:
Opaque Pricing: No clear pricing for Looker Studio Pro; requires contact with sales.
Limited Data Blending Capabilities: Looker Studio is just not designed for data blending.
Limited Support: Basic version users get limited customer support; Pro users report potential wait times.
Suitability: The Free version might be insufficient for larger organizations.
Performance: Some users reported lag, especially with bigger projects.
14. Microsoft Power BI
Microsoft Power BI is a reporting tools for data analysis that allows you to collect and visualize data, build personalized reports, and securely share them with your colleagues. Microsoft Power BI offers more than 120 free connectors and cloud data sources such as Salesforce, Azure SQL Database, Excel, and Dynamics 365.
Pros:
Affordability: Competitive pricing with a free version available.
Integration: Seamless integration with other Microsoft products.
User-Friendly: Intuitive drag-and-drop interface for creating reports.
Customization: Wide range of visualization tools and capabilities.
DAX Language: Allows for powerful data manipulation and complex calculations.
Cons:
Performance: Can be slower with very large datasets.
Complex DAX: Learning curve for DAX formula language.
Licensing: Some users find the licensing model confusing.
Limited Advanced Analytics: Lacks certain deep analytics features.
Mobile Experience: The mobile app sometimes lacks full desktop functionality.
Weigh these pros and cons against specific business requirements when considering Microsoft Power BI.
15. Tableau

Tableau is a visual analytics platform that collects and analyzes your data using machine learning. With Tableau, you can create visualizations using drag-and-drop functionality and employ AI-based statistical modeling.
Key characteristics:
Partially based on VizQL, its core query language, which translates dashboard and visualization components into queries and reduces the need for manual optimizations
Offers a mobile app for iOS and Android
Allows you to integrate your own security protocols
Pros:
Visualization Capabilities: Industry-leading data visualization tools.
User-Friendly: Intuitive drag-and-drop interface.
Data Connectivity: Supports a wide range of data sources.
Community: Strong user community with shared resources.
Flexibility: Allows for in-depth customization of dashboards.
Cons:
Cost: It can be pricier than some competitors.
Performance: It might slow down with very large datasets.
Complex Calculations: Some advanced functions require a learning curve.
Server Management: Requires technical expertise for optimal setup.
Mobile Experience: Lacks some desktop functionalities.
Always consider these pros and cons in the context of specific business needs and goals when evaluating Tableau.
16. Looker

Looker is a cloud-based data analytics and BI platform that collects and merges data from various sources in an automatically generated LookML model. Looker allows you to set up alerts, dynamic dashboards, and visualizations. A built-in code editor lets you modify automatically generated models if required.
Key characteristics:
Can embed insights from Looker’s BI with Salesforce, Sharepoint, Confluence, PowerPoint, and other tools
To use Looker, you must learn how the basic LookML model works
Looker Blocks feature offers prebuilt code pieces that you can use to accelerate analytics
Looker pricing is completely custom and depends on your specific case, number of users, and the scale of the deployment.
17. KNIME

KNIME, short for "Konstanz Information Miner," is an open-source data analytics, reporting, and integration platform. It is widely used for data exploration, data preprocessing, data modeling, and data analysis. KNIME provides a graphical user interface (GUI) that allows users to create visual workflows, known as "KNIME workflows," by connecting various data processing and analysis nodes.
Key Characteristics:
While KNIME's drag-and-drop interface makes it user-friendly for simple tasks, creating and managing complex workflows can be challenging for users with limited technical expertise. Handling large datasets and implementing advanced analytical processes may require a deeper understanding of data science concepts and the platform's capabilities.
Performance limitations can be a concern when dealing with extremely large datasets, and users might need to optimize their workflows carefully to manage computational resources effectively.
KNIME lacks native support for real-time data ingestion and analysis. This limitation may be a drawback for users who require instantaneous insights or have applications that heavily rely on real-time data streams. They might need to rely on external systems or custom implementations to address real-time data processing needs.
KNIME is free for individuals, and for the business hub, we need to contact Sales.
Pros:
Open Source: Cost-effective with robust community support.
Modular Workflow: Drag-and-drop interface for creating data workflows.
Versatility: Supports various data operations, from ETL to analytics.
Extensibility: Large selection of nodes and integration with Python, R, etc.
Scalability: Capable of handling both small and large datasets.
Cons:
Learning Curve: This can be challenging for new users.
Performance: Might slow down with complex workflows.
UI Clutter: The interface can get cluttered for large workflows.
Memory Consumption: Some operations can be memory-intensive.
Limited Visualization: Visualization capabilities aren't as advanced as dedicated tools.
Consider these points based on specific data science and analysis needs when evaluating KNIME.
18. Sisense

Sisense is a cloud-native AI data analytics platform that allows you to process and visualize business data. It offers many drag-and-drop tools and interactive dashboards to collaborate with your teammates.
Key characteristics:
Offers custom In-Chip technology to use fast CPU caching instead of RAM, which is slower
Lets you create analytical apps based on your data to embed them externally
Offers separate packages for cloud data teams, BI & analytics teams, and product teams.
Pros:
All-in-One: Combines complex data sources easily without external tools.
Drag-and-Drop: User-friendly interface for creating dashboards and reports.
Embeddability: Seamlessly embed dashboards into other applications.
Scalability: Efficiently handles large datasets with In-Chip technology.
Customization: Allows for a wide range of data visualizations and plugins.
Cons:
Cost: It can be on the pricier side for small businesses.
Learning Curve: It might be challenging for some beginners.
Integration Concerns: Not all third-party platforms integrate smoothly.
Advanced Features: Require a deeper understanding of coding knowledge.
Mobile Experience: The mobile app might lack some functionalities.
19. Qlik Sense

Qlik Sense is a data analytics platform based on artificial intelligence and an associative analytics engine that allows you to create reports and interactive dashboards. Qlik supports various environments, including the cloud (e.g., Azure and AWS), streaming platforms (e.g., Apache Kafka and Confluent), data warehouses (e.g., Exadata and Teradata), and others.
Key characteristics:
Offers open APIs for REST and .NET
Allows you to embed analytics into your web applications
Lets you create map visualizations and perform geospatial analytics
Pros:
Associative Engine: Unique data indexing for in-depth insights.
Self-Service: User-friendly drag-and-drop interface for visualization.
Flexibility: Custom extensions and integration capabilities.
Scalability: Efficiently caters to both small businesses and large enterprises.
Smart Insights: AI-driven recommendations and insights.
Cons:
Learning Curve: Initial adoption can be challenging.
Cost: Licensing can be expensive for premium features.
Scripting: Requires learning Qlik-specific scripting for advanced analysis.
Visualization Limits: Some limitations compared to dedicated visualization tools.
Integration Concerns: Not all third-party platforms integrate seamlessly.
Consider these points based on specific business intelligence needs when evaluating Qlik Sense.
20. Adverity

Adverity is one of the data analysis tools for marketing and reporting, AI-powered that allows you to automatically collect and merge your marketing data using a data integration module.
You can create reports, dashboards, and visualizations using a marketing reporting module and use AI to find patterns and trends in your data.
Key characteristics:
Can connect to affiliate networks, web tracking tools, offline files, TV audience metering systems, and other data sources
Smart naming conventions allow you to avoid errors in reports by highlighting differences in campaign names and suggesting you manually update them
Uses an augmented analytics module to analyze data, applying data mining, statistical modeling, machine learning, and complex algorithms to model user behavior and make predictions
Pros:
Data Integration: Connects to numerous advertising and marketing platforms.
Automated Reporting: Streamlines data aggregation and reporting.
Data Harmonization: Standardizes metrics across different sources.
Visualization: Built-in dashboarding and visualization capabilities.
Flexibility: Customizable based on specific marketing analytics needs.
Cons:
Cost: Premium features and tiers can be pricey.
Learning Curve: The platform can be complex for beginners.
Integration Gaps: Some data sources may pose challenges.
Customization Limits: Deep customizations might require technical expertise.
Data Processing: Delays in data updates or syncing at times.
21. SAS Business Intelligence
SAS Business Intelligence is a data analytics and BI platform that allows you to collect data and create interactive reports and dashboards with key metrics you select. SAS BI automatically analyzes your data based on machine learning and automatically highlights the most important parts in visual reports to help you find useful insights.
Key characteristics:
Allows you to combine collected data with geographical data and perform visual location analysis
Uses predictive analytics and algorithms to analyze and visualize data, reducing the need for manual optimization
Can set up bots to reveal insights more easily or connect bots to external services
To get pricing for your company, contact a SAS BI representative.
Pros:
Robust Analytics: Offers a wide range of advanced analytical tools.
Integration: Seamlessly integrates with various data sources and SAS products.
Scalability: Adapts to the needs of both small businesses and large enterprises.
Security: Strong data governance and security protocols.
Visualization: Provides versatile visualization and reporting tools.
Cons:
Cost: Typically pricier than some competitors.
Learning Curve: This can be complex, especially for those new to SAS.
UI Experience: Some users find the interface less modern.
Customization: Advanced features may require SAS coding.
Licensing Model: The structure can be intricate and confusing for some users.
Key Takeaways
Data analysis is an obligatory first step on the way to improving your marketing strategy. There’s a huge variety of analysis tools on the market that promise to do it all for you, and we’ve presented the most widely used ones to help you narrow down your search. What’s next?
To find something that will perfectly fit your needs, define your expectations from data analysis, your desired level of detail, and the types of data you’ll analyze. Combine tools that collect, analyze, and visualize data to achieve the best results in terms of quality, convenience, and cost.
If you still don’t know where to start, book a free demo to see how you can easily collect and analyze your data in real-time right away.
Gain clarity for better decisions without chaos
No switching between platforms. Get the reports you need to focus on campaign optimization
FAQ
-
What are data analysis tools?
Data analysis tools are specialized software applications designed to collect, process, and interpret data. They help in extracting meaningful insights, facilitating informed decision-making for researchers, businesses, and analysts. -
Is SQL a data analysis tool?
SQL (Structured Query Language) is a programming language used for managing and querying data in relational databases. While SQL itself is not a tool, various database management systems that utilize SQL, such as MySQL, PostgreSQL, and Microsoft SQL Server, serve as tools for data analysis and management. -
Is Excel a data analysis tool?
Yes, Excel is a versatile data analysis tool. It offers functionalities like pivot tables, charts, and advanced formulas, making it suitable for data manipulation, statistical analysis, and visualization for a wide range of users. -
What is data analysis?
In marketing, data analysis is the process of organizing, explaining, and interpreting data to answer questions regarding a marketing strategy, resolve issues with that strategy, and multiply its advantages. -
How to do data analysis?
Data analysis consists of the following steps:
1. Define your goal.
2. Collect data.
3. Ensure data quality.
4. Analyze data and interpret results.
5. Act on data.
6. Repeat the cycle.
![]() Get in-depth insights
Get in-depth insights
![]() Get in-depth insights
Get in-depth insights
20 Steps to Successful Marketing Analytics