The OWOX BI guide for digital marketers: data collection, dashboards, and templates
How can marketers prove that their actions help the business achieve its goals? With marketing reports, of course! In our guide, we’ve collected everything you need to know about marketing reporting — from data collection to report templates, dashboards, and the services you need for building them.
Want to build a dashboard based on data stored in Excel, Google Sheets, ad services, Google Analytics, your CRM, and your call tracking system? To save your team’s resources and avoid mistakes when collecting and merging data, use OWOX BI Pipeline.
Marketing reporting and business needs
Of course, it’s important to evaluate how successful and profitable your marketing activities are. Marketing costs are often high, so you need to understand how much marketing costs and justify that expenditure. To prove that your work as a marketer is necessary, important, and successful, you need to choose the right reports.
To begin, start by answering these five questions:
- What decisions will be made based on these reports?
- What questions do I want to answer?
- What data is needed for these reports?
- How often do I need such a report?
- What services am I currently using to build reports?
Once you’ve determined your reporting requirements, it’s time to move to the first stage — collecting data for marketing analysis.
Learn how analytics can help marketing specialists get their heads out of the routine and gain complete control over their marketing.
Data collection
Before you can enjoy your beautiful and thoughtful dashboards with charts and graphs, you have to collect data for them.
And before implementing data collection, you have to think about possible risks like data being of poor quality, incomplete, sampled, or unsafely collected.
Get a detailed guide to monitoring data quality.
Collect all marketing data in a single place
To compare the success of lots of campaigns on different advertising platforms, you first need to collect all your data in one place. Out of the box, Google Analytics contains only data from your website and advertising campaigns in Google services. If you want to work with cost data from non-Google services, SEO costs, data from CRM systems, and so on in Google Analytics, you have to import that data.
Automate data collection
You can manually collect data for reports if you have one or two campaigns. In all other cases, you should set up automatic importing to get rid of routine work and avoid mistakes that can cause your company to lose a lot of money every year.
Data quality and security
You must be sure of the quality of your collected data and the security of the connector or service you use to upload information. Otherwise, you risk making the wrong decision on account of data being lost, transmitted with errors, duplicated, etc.
You can merge all your marketing data, increase your return on investment (ROI), and check the quality of your data with the help of OWOX BI. OWOX gives you constant access to a visual report on the relevance of data collected from advertising services and uploaded to Google Analytics.

Google Analytics: a must-have for any marketer
Google Analytics is the most popular marketing analytics service and is quite sufficient at the initial stages of marketing analytics. However, once you want to build end-to-end analytics, you’ll have to switch to using Google BigQuery for collecting and merging data.
Google BigQuery provides extensive opportunities both for novices and experienced marketers. You can start building your end-to-end analytics system by setting up your Google Analytics account, then move to the next level of measuring marketing performance.
If you work with non-Google services and want to measure advertising campaigns from Facebook, Bing, Criteo, and other service providers in Google Analytics, try importing cost data with OWOX BI.
Google BigQuery
The more your company spends on advertising, the faster you’ll outgrow the capabilities of Google Analytics. It’s worth preparing for this development in advance — namely, to begin building your data lake in Google BigQuery (GBQ) cloud storage.
Google BigQuery cloud storage allows you to collect data from different sources, process it in seconds using SQL queries, and build reports with any metrics without sampling and without restrictions.
With OWOX BI, you can easily collect all data in GBQ from your website, Google Analytics, advertising services, and your CRM system and merge it to build marketing reports.

We recommend using OWOX BI to automatically collect and merge all marketing data. All you need to do is follow these simple steps:
- Use your Google account to sign in and provide OWOX BI access to GBQ.
- Combine data from different sources (advertising services, Google Analytics, your website, and your CRM) in BigQuery and create an OWOX BI pipeline.
- Build marketing reports and dashboards using SQL in Google BigQuery or use the simple report builder in OWOX BI Smart Data.
With OWOX BI, you control access to your data while OWOX provides a data monitoring report on your collected and processed data.
Read a detailed guide to getting started with OWOX BI.
Also, don’t forget to set up the correct UTM tags for your advertising campaigns. Without UTM tags, you can’t find out which ad sent a visitor to your site, can’t associate sessions with ad costs, and can’t get accurate reports.
Now that you’ve prepared your marketing data and are sure of its quality, you can build great marketing reports or dashboards!
What are dashboards and why should you use them?
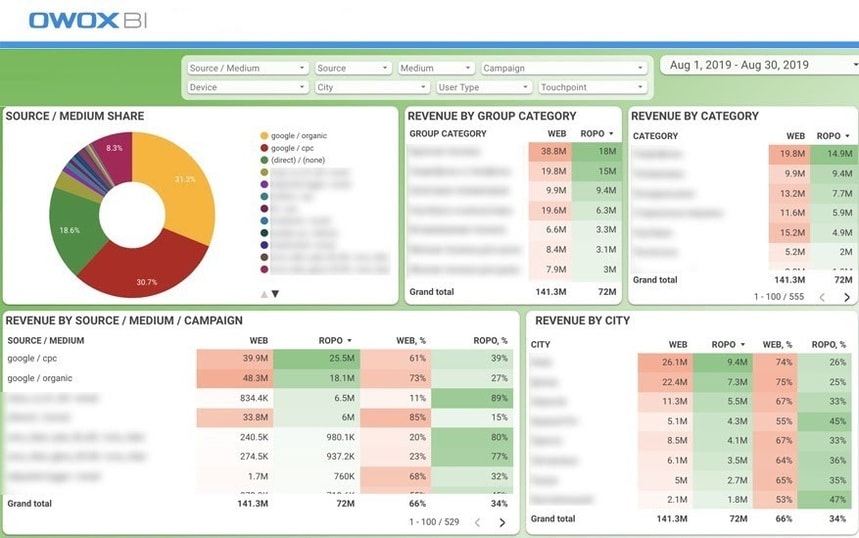
Using dashboards, marketers can receive all the information they need on one screen in tables and graphs. The obvious advantage of dashboards is that they visualize and automatically update data. Once you set up data importing and the necessary metrics, you can excuse yourself from a dozen hours of tedious work every month.
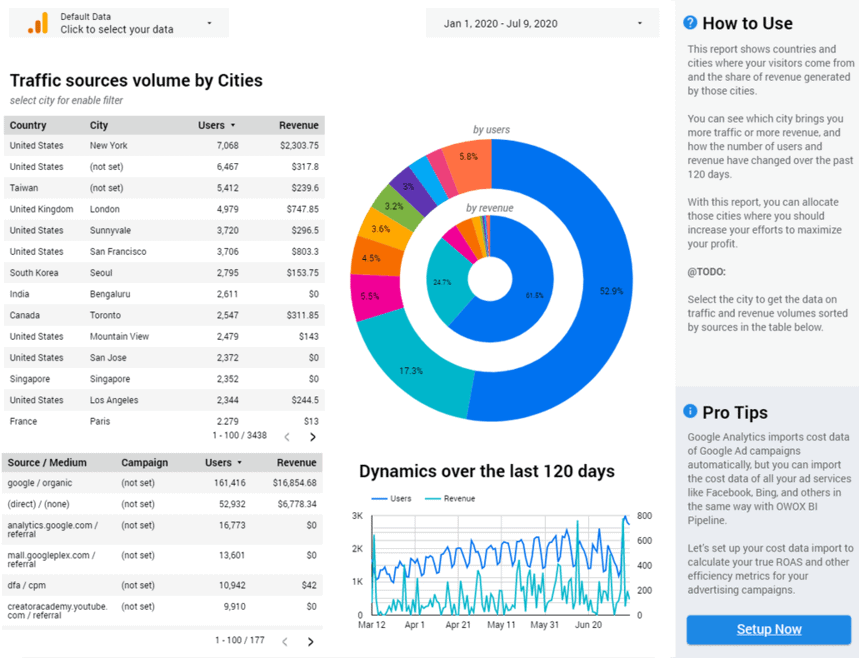
An example of the OWOX BI dashboard:
To ensure that your reports work correctly, you have to check two more items before you start:
- You have error-free and quality data for analysis.
- You’ve considered the peculiarities of your business when choosing an attribution model.
The goal of attribution is to evaluate the effectiveness of advertising channels and campaigns and identify which traffic channels lead to conversions. Knowing this, you can redistribute your budget to effective channels, stop spending money on inefficient channels, and eventually get more conversions.
Useful materials about attribution:
You can be sure your dashboard will help you to do the job quickly and without mistakes if:
- at first glance, it’s clear what information is presented in the charts and tables
- you can easily change the reporting period
- the dashboard is interactive, and you can filter data by the selected parameters
- you can track changes in metrics at a given frequency (daily, weekly, in real time).
See a selection of the most popular dashboards among our customers.
Marketing reporting tools & software
Your choice of marketing reporting service depends on the volume of data your company needs to process.
For small businesses, the capabilities of Google Analytics, Google Data Studio, and OWOX BI Smart Data are enough. For a more advanced dashboard, it’s worth thinking about systems with greater functionality such as GBQ + OWOX BI + Google Data Studio, Tableau, or Power BI.
Sometimes, you just need to transfer calculations directly from Google BigQuery to Google Sheets. With the OWOX BI BigQuery Reports add-on, you can build any report or graph in Google Sheets based on data from GBQ.
Discover the most popular and interesting website analytics tools.
Google Data Studio
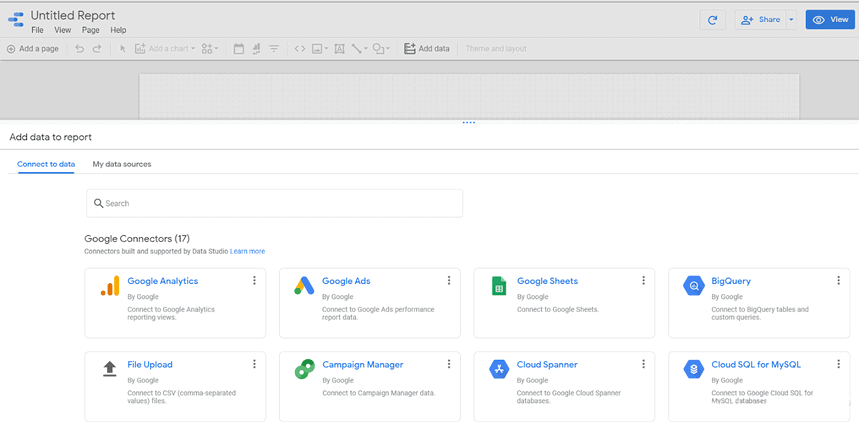
Google Data Studio is a simple and convenient service for creating dashboards. It provides 17 Google connectors and more than 200 partner connectors.
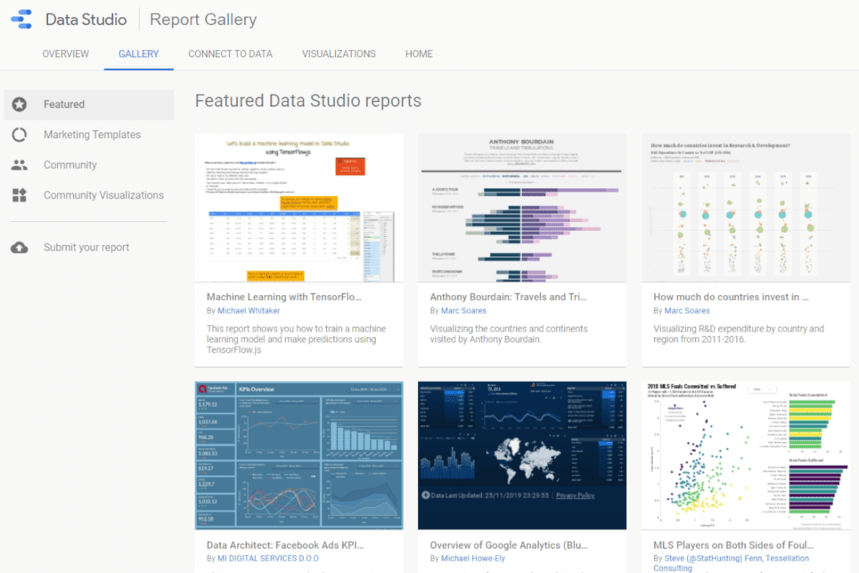
Data Studio allows you not only to share generated reports with colleagues and customers but also to copy them, filling them with your own data. In addition, you it provides access to a gallery of ready-made reports.
Google Data Studio tutorial for beginners.
Note! Data Studio works well only with one data source. If you want to build a report based on several different data sources, you should first blend the data in Google BigQuery. Use OWOX BI Pipeline to merge all data from different services automatically and avoid possible mistakes.
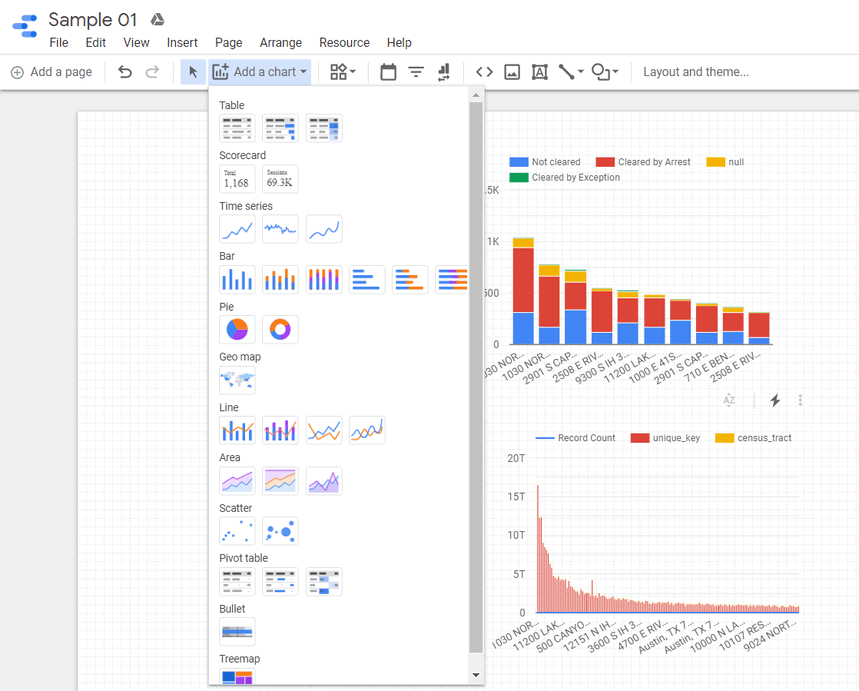
Once you’ve collected all the data you need, click Create and choose Data Source.
Select the Google BigQuery connector and provide access to your GBQ account. Then choose the desired project and dataset and click the Connect button in the upper right corner.
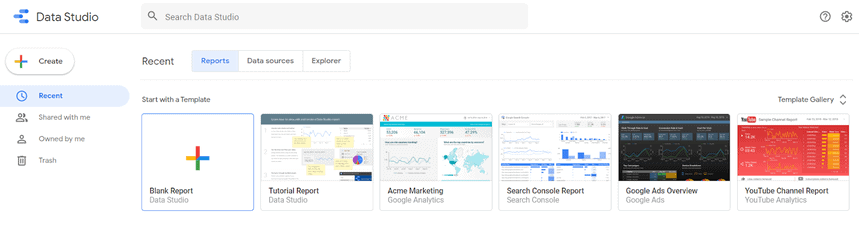
After linking your data, you can create reports by clicking on the corresponding button.
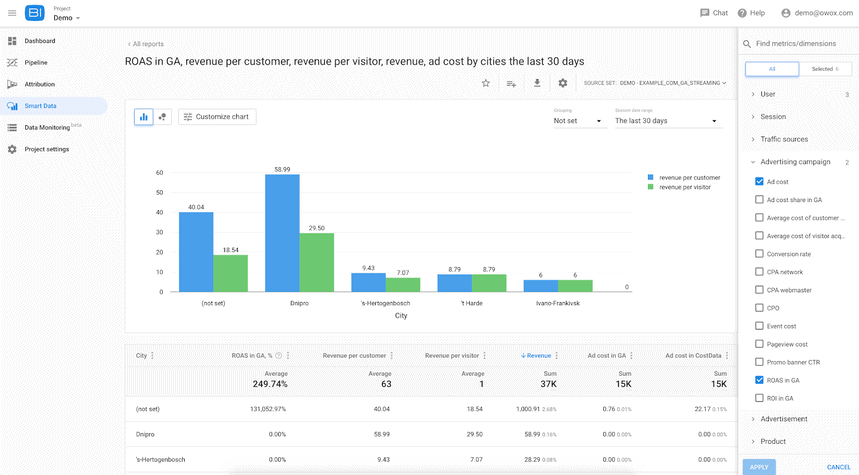
OWOX BI Smart Data
The Smart Data service was designed specifically to allow marketers and analysts to build reports and blend data from different datasets and data sources without needing to write SQL queries. You can generate a report using popular templates, select the metrics you need in the OWOX BI Report Builder, or enter a question in the search box using natural language.
Smart Data lets you answer thousands of questions about buyers, products, orders, and advertising campaigns across Bing, Facebook, Twitter, LinkedIn, Criteo, and other advertising services.
If you’re used to working with data in Google Sheets or Data Studio, you can easily export a finished report from OWOX BI Smart Data to these services. You can also save a report as a CSV file.
Marketing report templates
OWOX BI takes care of its users and regularly prepares collections of the most useful reports for marketers.
Overview of the 12 key Google Analytics reports for marketers. Setting up these Google Analytics reports will help you analyze the effectiveness of your advertising campaigns and tell you how to find risks and growth zones.
Most popular e-commerce reports. Each area of business has its own special reports that reflect its marketing realities. The OWOX BI team has collected the most wanted dashboards from its clients in the e-commerce sector.
Data Studio marketing templates. As we’ve already mentioned, there’s a special gallery of free report templates in Google Data Studio.
30+ free marketing report templates
Have you already collected data in Google Analytics but don’t want to spend time setting up reports? OWOX BI has collected the 30+ most popular reports for you according to marketers.
Get marketing insights from your data by using your Google account and choosing the Google Analytics view.
Conclusions
We recommend using interactive dashboards to evaluate your marketing effectiveness. Marketing analytics help you to keep a finger on the pulse of your business and not only find growth zones but notice weaknesses and react in time.
If you have any questions concerning marketing problems you really want to solve, let us know.
FAQ
-
What types of data can be tracked using data collection dashboards?
Data collection dashboards can track a variety of data related to digital marketing, including website traffic, conversion rates, email open and click-through rates, social media engagement, and more.