13 Best Reporting Tools and Software for Decision-Making in 2024
![]() Get in-depth insights
Get in-depth insights
![]() Get in-depth insights
Get in-depth insights
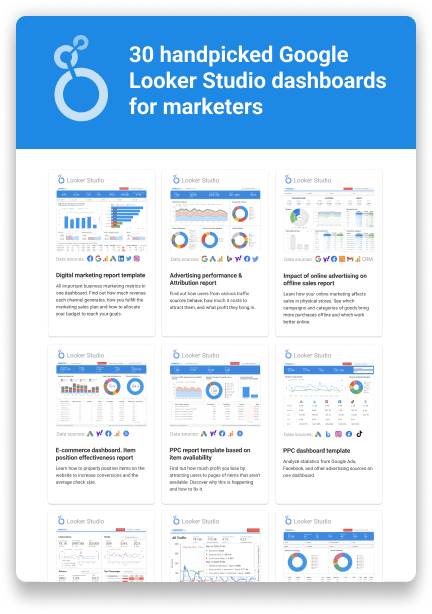
Top 30 handpicked Google Data Studio dashboards for marketers
Decisions are the turning points in business development. To ensure a trustworthy basis for decision-making, you need marketing reports based on high-quality data analysis as soon as possible — the earlier you find an insight, the more valuable it is.
Today's marketing landscape demands not just any reporting tools, but those enhanced by machine learning to sift through massive datasets, offering embedded analytics for real-time decision-making.

Trustworthy data indeed can reveal valuable insights about your business. But how can you find them? To facilitate and automate the process of data exploration and finding insights, you can use automated reporting tools of different types, with different levels of detail, and with varying degrees of complexity. Make sure you select the right automated reporting tool for your business that satisfies your exact needs to see results as soon as possible.
Note: The original version of this article was released in December 2021 and was updated in February 2024 to ensure that the content remains accurate and comprehensive.
What are Marketing Reporting Tools?
Reporting software or reporting tools help you to organize your data from different sources and help you analyze data by structuring it, compiling it, and arranging it in tables or charts to visualize data.
This is how you can make information easier to parse and clearly understand your business operations and processes. Good data reporting tools provide you with the ability to get information in the necessary form as quickly as possible, since the value of an insight decreases with time.
However, most of the data reporting tools are designed for organizing and visualizing information.
To ensure the quality of reports, you need to collect, normalize, merge, attribute, and prepare the reporting datasets before using a web reporting software tool.
To do this, you'll need a marketing analytics tool, like OWOX BI.
Automate your digital marketing reporting
Manage and analyze all your data in one place! Access fresh & reliable data with OWOX BI — an all-in-one reporting and analytics tool

6 Types of Reporting Tools and Software
Reporting tools can be divided into the following types of business reports:
Self-service: These tools allow you to build your reports based on internal information.
Data visualization: Data visualization tools represent information graphically by using elements such as maps and charts to make information comprehensible and improve report design.
Business intelligence or BI: Business intelligence tools help you discover actionable insights, frequently by using visual and interactive elements in reports and dashboards.
Application performance: These tools display data on how an application performs, how many users it has, how much revenue it brings, in which ways it brings that revenue, and other parameters applicable to a specific application.
Enterprise: These tools are aimed at preserving high levels of security and flexibility. They allow for the custom structuring of company information into organized tables, charts, reports, and dashboards.
Finance-focused: These tools arrange and extract insights by examining financial records, including cash flow statements, balance sheets, and income statements.
To identify the type of reporting tool you need, figure out your business goals to see which aspects of your marketing strategy you need to cover using reporting-embedded analytics tools.
Reporting vs Business Intelligence Tools
Reporting tools or reporting software are generally limited to compiling reports and structuring information. They're aimed at business users finding insights and relevant data fast, even without sophisticated data visualization.
Business intelligence tools, in contrast, handle a wider variety of tasks, including data analytics and data visualization. They collect information from different business sources, transform it, create charts to visualize and analyze complex data together and help you easily find insights.
What are the Benefits of Data Analysis Reporting Tools?
To keep up with the pace of the modern world, automating as many processes as possible and using specialized tools is a must. If you want to generate reports manually, it is a durable and tiresome procedure, and the result frequently isn't worth the titanic effort.
Automated reporting tools are software applications that automatically generate and distribute reports based on predefined parameters. These tools can perform data analysis, transform it into a visual format, and send it to designated recipients. These tools help organizations save time, reduce errors, and improve decisions.
With the right tools, creating comprehensive reports and dashboards becomes streamlined, allowing businesses to visualize complex data through machine learning-powered insights.
Let’s take a look at the main benefits of reporting tools.
- Speed up the reporting process: With automated reporting tools, you significantly reduce the amount of time required to organize your data.
- Create reports with the exact parameters you need: Some of the best report-building tools allow you to customize reports: select the parameters you need to measure and compare them to adjust the reporting process to your business.
- Find insights in raw data: Organizing raw data allows you to quickly discover valuable insights and act on them to achieve your business goals.
- Visualize reports or integrate with visualization tools: Visualization software allows you to go one step further than regular table-based reporting, helping you create charts and interactive dashboards.
- Improve decision-making: Get reports based on necessary information, share them with your team members, and prove your decisions based on exact figures.
- Optimize resources: Automation is an extreme time saver, a live source connection helps keep information fresh. Automated work can help boost productivity and eliminate inefficiency quickly and effortlessly. Instead of producing reports, the company can use measurable metrics to improve its business analytics and processes.
- Optimize your marketing strategy: Maximize the possibilities of analytics reports and automated optimization tools. Track trends in the business and build engaging and profitable marketing campaigns for a targeted customer.
- On-time and up-to-date reporting: Reporting time always sneaks up on you, but good reporting software can automatically make reports alerting you on an upcoming period or create automatic reports in real time. Check your information to ensure it is properly connected when you receive upcoming notifications of reports.
Uncover in-depth insights
Top 30 handpicked Google Data Studio dashboards for marketers
Download nowBonus for readers
How to Select a Reporting Tool: Comparison Criteria
To select the best fit for your business, you can compare the following criteria:
- How data is processed: A good tool monitors data quality, can directly connect with sources, and automatically imports data.
- Integrations: Find out how easily you can integrate a tool with data visualization, business intelligence, or other services and how many data integrations a tool has to offer.
- Report templates: Check if a tool has a library of ready-to-use templates; otherwise, see how easy it is to build a report from scratch.
- Data preparation capabilities: A good tool to automate your marketing reporting allows you to keep the data preparation under your control.
- Limitations: Investigate how many rows and parameters a tool allows you to include in a report, what the volume limits are, and how much time it takes for a tool to collect, transfer, and process information.
- Pricing: Compare prices of different services and make sure the cost is reasonable for the features you get.
Consider whether a tool offers embedded analytics capabilities, enabling users to directly access and interact with reports and dashboards within their daily software environments.
Let's perform a short reporting platforms comparison among ten of the best, reporting systems and other cloud-based business intelligence tools using the criteria above.
You can use this list to find a simple reporting tool for project management, project planning, or other business needs you have.
Comparison of the Top 13 Reporting and Business Intelligence Tools
Best Reporting Tools
1. Google Analytics 4
Google Analytics 4 stands as one of the most dominant free reporting tools. It captures data on users' web requests, cookies, and device details using a Google Analytics Tracking Code and transfers this data to Google's servers in the form of various parameters. Once processed, typically within a span of 24 to 48 hours, the data becomes available for report generation within your account. It allows for seamless integration with other Google services, such as Google Ads or Search Ads 360. However, it does not automatically pull in data from non-Google advertising platforms or your CRM; this data must be imported either manually or via an external tool.
For example, you can enrich your GA 4 property with non-google advertising costs.
Regarding data limitations, Google Analytics allows you to collect up to 10M events per month before you experience the data sampling, 25 event parameters per event, and your data would be stored for up to 14 months.
If you need to extend the data retention period - you should upgrade to a paid version of Google Analytics - GA360 or set up on-site real-time data collection into BigQuery with OWOX BI Streaming.
Measure CPO and ROAS in GA4
Automatically link your Ad Platforms cost data to Google Analytics 4 conversion data, so you can analyze your marketing KPIs and make fully informed decisions

2. Looker Studio (formerly Google Data Studio)

Looker Studio, previously known as Google Data Studio, ranks among the top-tier free tools for building reports. This platform provides the functionality to establish connectors that collect and compare your data, manage reports, tailor interactive dashboards through intuitive drag-and-drop features, and design your data visualizations within Explorer — a dedicated environment for diving into your aggregated data.
You can build your advertising reports using Looker Studio templates from the marketing dashboard template gallery.
You should keep in mind that Looker Studio (formerly Google Data Studio) has limits on collected data, as well as limits on the number of visual elements per page, and has no official Google support.
Looker Studio blends all collected results. It performs slower if you have more than two data sources (in comparison to its processing speed with one or two sources).
One option to overcome this issue is to collect all information in a single dataset in Google BigQuery and integrate it with Looker Studio (Formerly Google Data Studio) as a single data source.
In order to collect your marketing and sales data into Google BigQuery, you can use OWOX BI Pipelines.
3. OWOX BI

OWOX BI is an all-in-one marketing analytics platform that helps you collect unlimited amounts of unsampled raw data from various online and offline sources in one place (Google BigQuery).
OWOX BI also monitors the data quality and supports dynamic UTM parameters.
OWOX BI then helps you normalize, clean, merge, and attribute cost data from ad services, website tracking tools, Google Analytics 4, revenue data from the CRM, and other marketing and sales data sources in real-time with no coding.
You can use the business-ready data to prepare data as well as analyze data for reporting to be visualized in a BI tool like Looker Studio, Google Sheets, Tableau, Power BI, or another tool of your choice, or easily build reports with OWOX BI Smart Data.
Start using OWOX BI for free, build the reports, start optimizing your campaigns, get your value, and then upgrade to one of the paid plans if you want to grow faster.
Hassle-free data analysis and reporting
Easily collect, prepare, and analyze marketing data. Stay on top of your marketing performance
4. Funnel

Funnel is an ETL (extract, transform, load) data analytics platform that collects your data and automatically organizes it so you can use it to create reports and interactive dashboards, with the key metrics that you need. The processed result then goes to the Funnel data warehouse.
However, you should take into account that Funnel doesn’t collect user behavior data from a website, doesn’t monitor data quality, and doesn’t support dynamic UTM parameters.
Pricing for Funnel plans starts at $399 per month.
5. Supermetrics

Another ETL platform you can use as automated report-writing software is Supermetrics. This tool collects and processes your data with the help of APIs, then sends it to another tool you select from the available Supermetrics integrations (including Google Sheets and Looker Studio).
As for Supermetrics' limitations, keep in mind that this tool doesn't monitor data quality, doesn't make your data report-ready, and has no option to export data to create attribution-based reports, so you would have to use another tool for these purposes.
Pricing for Supermetrics starts at $39 a month.
6. Improvado
One more cloud-based ETL platform is Improvado. This tool also uses a REST API to extract your data from various sources, clean it, and organize it. Next, it transforms data by merging tables and modifying the data structure. Finally, you can load the transformed data to the internal Improvado database or some external storage (for example, Azure or PostgreSQL). You can build reports directly with Improvado interface.
Improvado has no free trial period, so you can’t test its performance before purchasing it. Additionally, remember that this tool doesn’t collect data about user behavior or perform cohort analysis.
Pricing is not available on the website.
7. Datorama
One of the best report-writing software is Datorama — an AI-powered data science and analytics platform that you can use for data mining, data analysis, and report writing. It helps you collect and unify your data in one platform, analyze data, build reports, and find insights in them. Other useful functions Datorama has are automated reports, predictions of goal completion, and cross-platform management — you can adjust campaigns in Google, Facebook, and other tools connected to up-to-date data in Datorama.
You should take into account that Datorama is mainly suitable for enterprises and B2B marketers, and for this reason, plans are rather expensive.
Pricing for Datorama starts at $36,000 per year.
8. Datapine

Datapine is one of the most powerful report automation tools among other players in the market. One of its primary strengths lies in its seamless data integration capabilities, effortlessly consolidating data from various data sources.
Datapine also shines in the realm of predictive analytics, allowing users to build predictive models and forecast future trends based on historical data. Customizability is another hallmark of Datapine. Users can design tailor-made, interactive dashboards that align with their specific requirements using a simple drag-and-drop interface.
These key features simplify data-gathering automatic reporting, setting the stage for one of the best report-building software with predictive analytics features.
Pricing for Datapine starts from $249 monthly, which goes up to the premium version at $799 per month.
9. Looker

One of the best BI reporting solutions is Looker - a cloud-based data analytics platform. It collects and merges information from different data sources in an automatically generated LookML model. You can configure visualizations and dynamic interactive dashboards, and a built-in code editor allows you to modify automatically generated data models if needed. You can integrate Looker with Salesforce, PowerPoint, Confluence, and other tools.
Still, you should keep in mind that using Looker Studio requires learning how the basic LookML model works, so before you start using this report-building software product, you’ll have to dedicate some time to it.
Pricing for Looker is custom and depends on how many users you have and how large the scale of your deployment is.
10. Sisense

Sisense is a user-friendly Business Intelligence (BI) reporting tool designed to streamline data analytics and report automation processes for business users. This powerful data science platform is known for its simplicity of key performance indicators and efficiency. It excels in extracting data from various data sources, such as Google Analytics, Salesforce, and more, making it a versatile reporting solution for businesses seeking comprehensive data-driven insights only.
One of the key features of Sisense is its in-chip technology, which enables swift data processing, outpacing many other BI tools in terms of speed and efficiency. Sisense offers the flexibility of white-label predictive analytics tools, allowing companies to tailor the tool to their specific needs. This means you can fully customize the platform's services, integrating it seamlessly into your organization's unique branding and workflow.
This report-building software is highly intuitive, with a drag-and-drop interface that simplifies creating reports and creating interactive dashboards used to design, explore data, and manipulate complex data visualizations easily.
Sisense has a no-surprise pricing policy, customized according to your needs and budget.
11. Power BI
Another top business intelligence software and data analytics tool you can use as a tool for automated reporting is Microsoft Power BI. It collects and visualizes your marketing data and builds interactive reports and dashboards based on it. Power BI is quite convenient to use thanks to the similarity of its features to those of other Microsoft products (for instance, Microsoft Excel).
You can also use Microsoft Power BI to share the results with your coworkers securely and embed interactive reports into your applications. You can also use Power BI as project management report-building software and create project reports and status reports.
In terms of integrations, Microsoft Power BI is popular among report-building and analytics tools, as it offers more than 120 free connectors and multiple data sources such as Excel, Salesforce, and Azure SQL Database.
Pricing for Power BI starts at $9.99 per month per user for a shared environment and $4,995 per month for a dedicated cloud.
12. Tableau
Another solution among report-building tools is Tableau. It uses machine learning and artificial intelligence to collect and analyze your marketing data, which you can use further to visualize your results using a simple drag-and-drop function. Tableau is partially based on the core query language VizQL. It translates visualization and dashboard elements into queries, so you don't have to optimize them manually.
Tableau also allows you to ensure extra security for your information with the ability to integrate your own security protocols. Regarding integrations with other reporting tools, Tableau offers a list of native data connectors.
Pricing for Tableau starts at $70 per user per month.
13. Ubiq

Ubiq stands out as an exceptional, business intelligence platform, data exploration, and report automation tool. Leveraging advanced artificial intelligence and machine learning capabilities, Ubiq simplifies data analysis by automating data collection and preparation processes. Its intuitive drag-and-drop interface empowers users of all skill levels to easily create visually compelling reports and interactive dashboards, eliminating the need for extensive technical expertise. Ubiq's adaptive query language adapts to user actions, intelligently translating visualization elements into queries.
One of its other key metrics and strengths lies in its emphasis on data security, allowing users to integrate their own security protocols to protect sensitive information. With cross-platform compatibility, Ubiq as a report-building software ensures data accessibility from any device, making it a versatile range among report-building tools seeking streamlined and insightful data mining, automated reporting, and data analysis.
Pricing for Ubiq starts from $29 per user per month.
Key Takeaways on Choosing the Best Reporting Software
To improve the quality of your decision-making, you should be able to get simple, structured, and visualized answers to your questions as soon as possible.
Data reporting and business analysis tools can be of great help, but they're extremely different in terms of functions and pricing. Reporting is offered in virtually any SaaS solution on the market, but the best reporting solutions provide distinct advantages in that it allows you to use data integration to combine several data streams within just one interface. Create a comprehensive checklist before purchasing a new reporting solution.
Find the data visualization, and intuitive interface that works well, and ask if a predictive analytics tool will help you forecast. Ensure the business data exploration tool you select can satisfy your own business analytics needs and serve as reliable grounds for decision-making.
Gain clarity for better decisions without chaos
No switching between platforms. Get the reports you need to focus on campaign optimization
FAQ
-
What are reporting tools?
Reporting tools are software applications that help businesses collect, analyze and present data in an organized way. These tools allow you to turn data into insights and make data-driven decisions to improve business performance. -
How do reporting tools help businesses?
Reporting tools provide businesses with valuable insights into their operations, allowing them to identify trends, opportunities, and challenges. These insights help businesses make strategic decisions that can improve their performance and profitability. -
Can reporting tools work with different data sources?
Yes, most reporting tools support data integration, which means they can work with different data sources. Some reporting tools also offer multiple data connectors, allowing you to connect to various data sources and consolidate data from different platforms.
![]() Get in-depth insights
Get in-depth insights
![]() Get in-depth insights
Get in-depth insights
Top 30 handpicked Google Data Studio dashboards for marketers