How to set up OWOX BI — A detailed guide
In this article, you’ll find step-by-step instructions on how to set up advanced analytics with OWOX BI to get the most out of your data.
OWOX BI services help you:
- Improve the quality and speed of testing marketing hypotheses
- Increase the revenue and ROAS of your advertising campaigns and audiences
- Improve the profitability of audience segments
Lower Adwaste, Save Time, and Grow ROI
Make smart decisions about your campaign optimization faster
Who we are and what we do
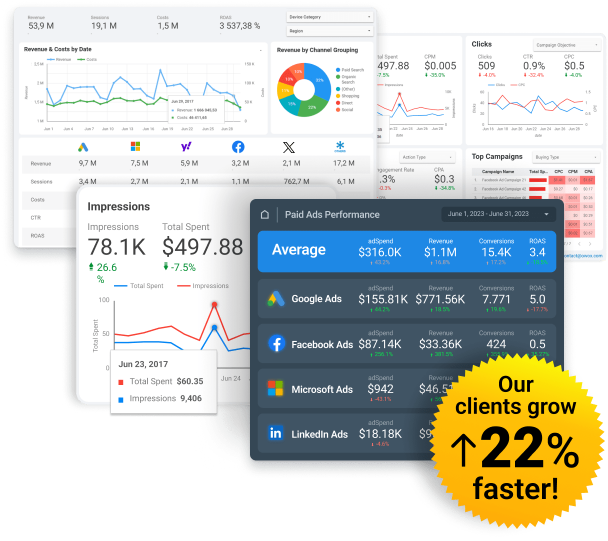
In 18 years of working with large e-commerce projects, we’ve seen how important data is and how companies can grow when they use it correctly. We created OWOX BI to help our customers find insights and grow 22% faster than the market average. Our goal is to improve the quality of data-based business decisions.
Today, OWOX BI is a trusted solution used by 27,000 users in 130 countries. We’re one of the top three marketing analytics solutions in the world according to G2 Crowd.
How OWOX BI helps businesses grow 22% faster than the market average
OWOX BI provides quality data to analysts, application reports to marketers, and insights for fast growth to business.
- Delivers your data from marketing sources to Google Analytics and Google BigQuery.
- Collects raw, unsampled data from your website in a structure familiar to most analysts.
- Ensures the relevance and high granularity of data.
- Combines, cleans, stabilizes, and monitors the quality of data.
OWOX BI ML Funnel Based Attribution
- Creates a funnel that takes into account the user’s path to conversion for your business.
- Determines the value of each session and user.
- Calculates the objective contribution of each advertising campaign to ROPO sales.
- Creates a single cross-device profile for each user.
- Combines data into the structure needed to build reports for your business model.
- Builds reports without SQL in several clicks.
Log in to OWOX BI using your Google account and adjust your settings to take advantage of these features.
1. Import cost data into Google Analytics and Google BigQuery
You’ll benefit from this functionality if:
- You manually collect statistics for paid ads
- You’re tired of building reports that your colleagues constantly break in Excel or Google Sheets
- You don’t want to go to several different services to understand which advertising campaign works better
With OWOX BI Pipeline, you can:
- Free yourself from manual work by automatically receiving information about cost data in Google Analytics
- Compare campaign ROAS to keyword accuracy in the Google Analytics interface
- Understand how much you spend attracting a specific user (works in conjunction with collecting raw data from your website)
How to import cost data into Google Analytics
- First of all, make sure your advertising links have the correct UTM tags.
- After that, create a dataset in Google Analytics into which advertising costs will be downloaded.
- Then create a pipeline in OWOX BI and start automatically importing data by activating access to the advertising service you’ll be pulling data from. For more information on how to import cost data, see our article on how to get started with OWOX BI.
Cost data will appear in Google Analytics within 36 hours of creating a pipeline.
If OWOX BI doesn’t have a direct integration with the advertising service you need to import data from or if you want to upload SEO costs to Google Analytics, set up a manual ad cost data import pipeline or write to contact@owox.com and we’ll create a custom integration for you.
How to import raw marketing data into Google BigQuery
OWOX BI provides high data granularity. For sources with an API, we collect cost data with up to 5 UTM parameters, and for some sources (Facebook, LinkedIn) we transfer up to 200 parameters to Google BigQuery.
Learn how to use raw data from Facebook Ads to analyze the effectiveness of ad campaigns.
To import raw data from an advertising service to Google BigQuery, you need to:
- Create a Google BigQuery account (if you don’t already have one)
- In OWOX BI, create a pipeline from Facebook or LinkedIn to Google BigQuery
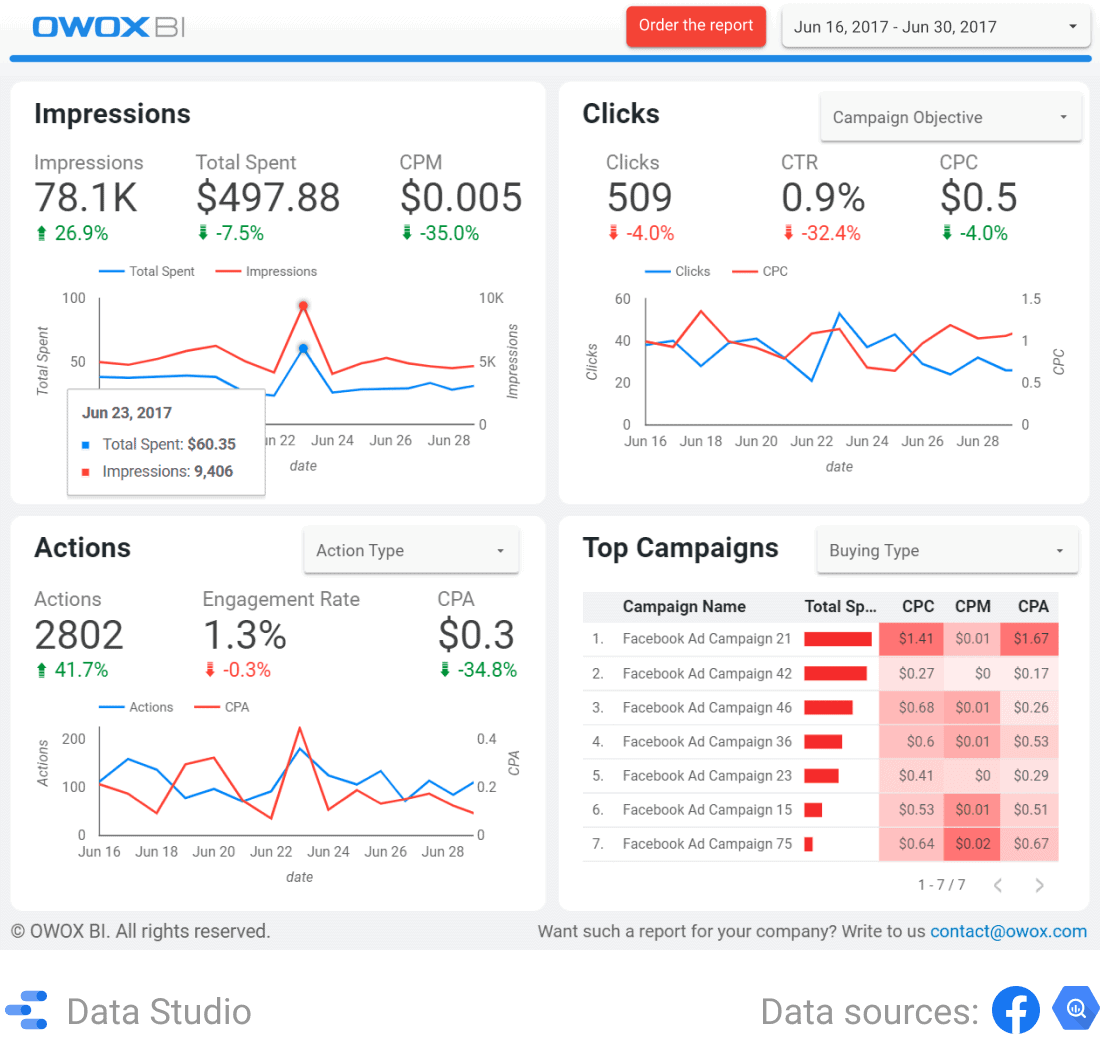
Information for the previous day will appear in the table in the specified dataset. Also, all data uploaded to BigQuery will be updated if the information in the advertising service changes retrospectively within a period of 21 days. This means that for 21 days after importing data, the numbers in Google BigQuery will automatically be updated to correspond to the numbers in the advertising service.
As a result, you can build dashboards similar to this one:
How to verify that cost data is accurately collected
Low-quality data is the first reason for poor decisions, due to which businesses lose time and money. To address this problem, we created a Data Monitoring service that allows us to track the completeness and relevance of data uploaded to Google Analytics from advertising services. You can access a visual report at any time showing all your project pipelines and data download statuses for each day:
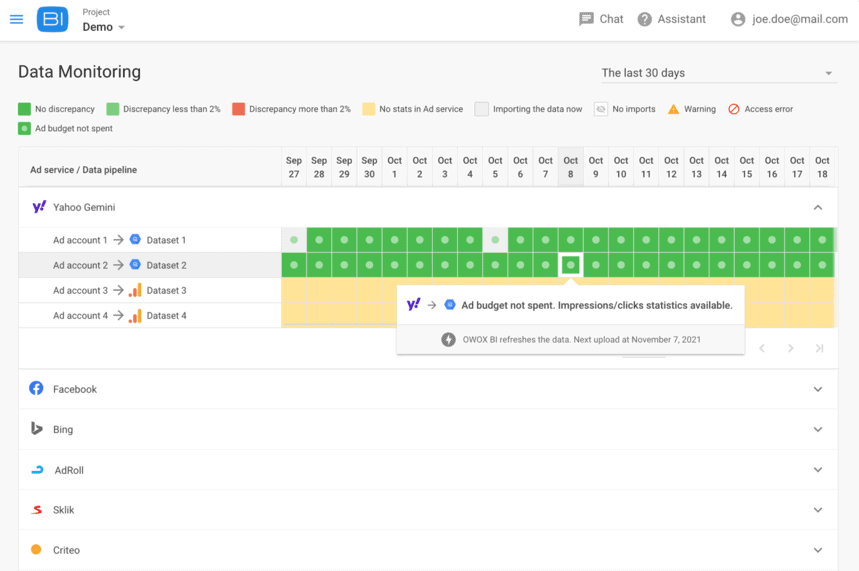
By clicking on a cell, you can see status details: the exact percentage of discrepancies in data and the exact time when OWOX BI last updated the data in Google Analytics.
Learn how to collect complete and high-quality data with minimal resource costs.
You can also go to the Pipeline page in OWOX BI and view the details of the data. If an error occurs during import, you’ll see it in the description (as well as the cause of the error).
Answers to frequently asked questions
2. Collect raw, unsampled data about user behavior from a website into Google BigQuery
You’ll want to use this functionality if:
- Data in your reports is sampled and you can’t trust your reports 100%
- You exceed the limit of 10 million hits a month and not all hits are included in your Google Analytics reports
- You need more than the 20 custom metrics and dimensions available in Google Analytics
- You want your data to be available for analysis at once, not in 24 hours
OWOX BI collects data into Google BigQuery directly from your website without the limitations of Google Analytics, allowing you to build reports without sampling and according to any parameters. With OWOX BI Pipeline, you can:
- Get raw and unsampled data from your website in Google BigQuery
- Send an unlimited number of custom metrics and dimensions to Google BigQuery
- Collect data about user behavior in almost real time (with a delay of up to 5 minutes)
- Collect personal data (IP addresses, emails, phone numbers) and use it for analysis
Read more about the benefits of collecting data from your website in our article on how to avoid sampling and collect complete data:
To collect raw, unsampled data from your website, you need a Google BigQuery account. If you don’t have one, you can register and receive $300 to store and process your data as a new user.
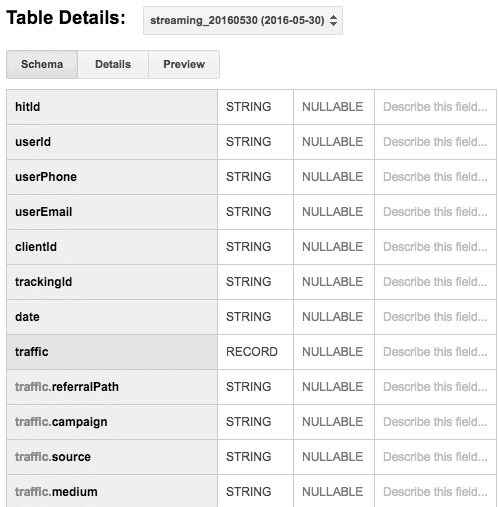
OWOX BI collects raw, unsampled user behavior data on your website at the level of hits and sessions. Hit data is uploaded to Google BigQuery tables in real time. Session data appears in BigQuery the next day. How you create your pipeline will depend on how Google Analytics tracking is implemented on your website.
If you’re tracking via Google Tag Manager
If you’ve implemented Google Analytics on your website through Google Tag Manager, then you need to:
- Create a data pipeline based on hits from your website
- Implement an OWOX BI tracking code on your website through Google Tag Manager
- Set up session data collection
If tracking is configured using JavaScript code
If you have Google Analytics tracking embedded through JavaScript code, then you need to:
- Set up a hit data pipeline
- Embed a code snippet on each page of your website
- Configure session data collection
Note that data will not be available until the day after the pipeline is created.
Data collection schemes
- Hits data scheme (data available in Google BigQuery in 5 minutes)
- Session data scheme (data collected based on the OWOX BI algorithm)
Answers to frequently asked questions
3. Collecting data from mobile applications into Google BigQuery
By collecting information in Google BigQuery from mobile applications, you can:
- Get a full picture of user behavior at each stage of the sales funnel
- Learn how traffic sources bringing users to your website and mobile application are interconnected
- Make your applications more effective: increase user involvement, reduce the cost of client involvement, make your interface friendlier
How to set up data collection from AppsFlyer into Google BigQuery
If you use the AppsFlyer analytics system, you can upload mobile traffic data into BigQuery using OWOX BI:
- Set up a pipeline and data schema for an Android app.
- Set up a pipeline and data schema for an iOS app.
How to collect data from a mobile app with Google Analytics/Firebase
- Collect data from an Android app into Google BigQuery in real time using Google Firebase.
- Configure data collection from an iOS application into BigQuery using the OWOX BI Streaming plugin or Google Firebase.
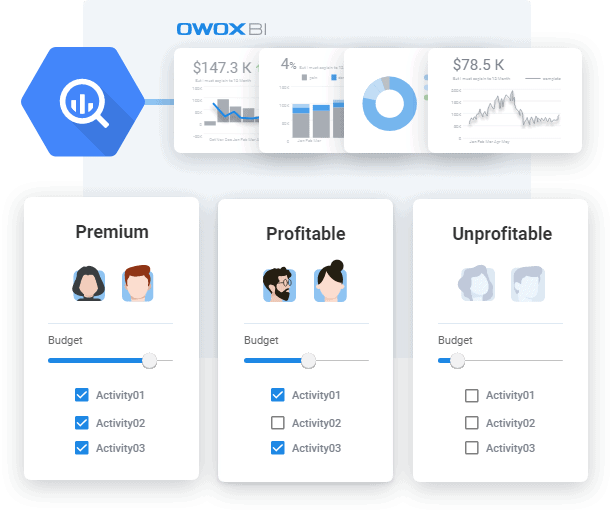
After combining all the necessary data in Google BigQuery, you can significantly improve your marketing using OWOX BI functionality.
What OWOX BI does for you:
- Automatically generates a cross-device profile for each user and updates it retrospectively
- Provides ready-made algorithms for predicting audience conversions and value using machine learning
- Gives you unlimited opportunities for user segmentation (for example, excluding an audience that won’t buy)
- Lets you automatically deliver data to advertising services
- Provides you with a ready-made tool to improve the profitability of your audience segments

4. Import data from Google BigQuery into Google Analytics
You’ll need this functionality if you want to:
- Increase the relevance of your ads
- Increase the number of re-purchases
- Increase the percentage of returning users
- Increase the lifetime value (LTV) of users
The Google BigQuery → Google Analytics pipeline helps you personalize ads as much as possible and offer users what they really need.
For example, say you have a CRM system that stores all information about registered users or those who have made a purchase: car ownership, number of children, date of birth, job title, interests, etc. It’s time to start using this information.
By uploading information from your CRM into BigQuery and from there to Google Analytics, you can get additional user settings in Google Analytics. Then you can create audiences based on those settings and transfer those audiences to Google Ads.
How to import data from Google BigQuery into Google Analytics
- First, upload data from your CRM into BigQuery. To do this, you can use the direct Salesforce integration in OWOX BI, use ready-made libraries and applications, or write to contact@owox. com and we’ll create a custom integration for you.
- In Google Analytics, create custom user-level settings. Then create a new dataset to import information from BigQuery. Read more about Google Analytics settings in our article on how to set up Google Analytics.
- Prepare a SQL query. This query should select the key-value data you need. For example, say user 2346 is a machine. Save the query in your OWOX BI project so you can simply specify it when you set up your pipeline. You can also import RFM results from BigQuery into Google Analytics.
- Create a pipeline from Google BigQuery into Google Analytics.
Learn how to combine data from your CRM/ERP and Google Analytics to improve remarketing efficiency and better analyze user behavior.
5. Integrate your CRM data into Google BigQuery
By downloading data from your CRM into BigQuery, you can:
- Combine information about transactions, online user activity, and advertising expenses
- Evaluate the effectiveness of advertising campaigns based on real revenue and order fulfillment data stored in your CRM
- Assess the impact of all marketing efforts, both online and offline, on business performance
Integrating your CRM system with Google BigQuery occurs on the client side. To set up automatic integration, you’ll need a technician or an outsourced specialist if your team doesn’t have one.
If you want OWOX BI to develop a custom integration for your CRM system, please email contact@owox.com.
Libraries for automatic integration
You can upload data from your CRM into Google BigQuery in several ways:
- Download files in CSV or JSON format through the Google BigQuery interface or by using the bq command-line tool.
- Use a set of Python scripts from OWOX to automatically import data into Google BigQuery using Google Cloud Functions.
- Use the SDK for. NET, Java, PHP, or Python.
- Use ready ETL applications.
- Use the ODBC driver from CDATA.
- Download data from Google Sheets using the OWOX BI BigQuery Reports add-on.
We recommend using the first method: downloading files through the BigQuery interface. To do this, open the Google BigQuery interface and follow these step-by-step instructions.

6. ML funnel based attribution
You need funnel based attribution if:
- More than 40% of your users visit your website more than twice before buying
- You don’t know how optimizing paid campaigns will affect sales on other channels
- You invest in web channels, but customers also order in applications and offline stores
- Users interact with your company through different points (stores, call centers, chat rooms)
- You have a complex and inconsistent sales funnel or a long purchase cycle
- You have differences between transaction data in your CRM and Google Analytics
- You want to evaluate the contribution of media ads using views from DoubleClick
With OWOX BI Attribution, you can:
- Get a quality assessment. The OWOX model is trained on data from tens of thousands of projects and is resistant to noisy data.
- Evaluate each funnel step taken by the user.
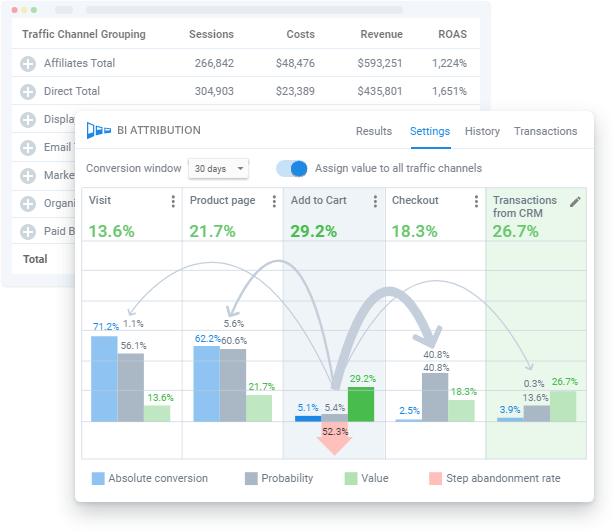
- Distribute your advertising budget as recommended in reports. Add attribution metrics to reports and find growth zones in campaigns.
- Use attribution calculations to automatically manage rates based on the contributions of keywords to sales.
- Evaluate channels based on user behavior in different cohorts: user type, region, device type, etc.
- Clearly see the contribution of an advertising campaign to sales on your website, sales in your application, and ROPO sales.
- Provide input and expertise in the calculation using a user-friendly interface.
- Get transparent and understandable results for each transaction.
Learn how advertising channels impact each other and affect the user’s promotion through the funnel and conversions.
- Information about users’ interactions with your website
- Data on online advertising costs
- Transaction data from your ERP/CRM, call centers, and other internal systems
How to configure funnel based attribution
- Create an attribution model in your OWOX BI project.
- Configure the appropriate attribution options.
- Configure the transfer of session value by traffic source.
- Adjust funnel steps that suit your project.
- Set up the attribution of custom events (data from your CRM, call tracking systems, etc.).
- Consider transaction data from your CRM.
- Adjust the funnel conversion step.
- Add media ad impressions from DoubleClick and Campaign Manager to the conversion funnel.
What can you do with the results of an attribution calculation?
- Get finished reports in OWOX BI Smart Data.
- Build reports by yourself in your usual visualization services using calculation tables.
- Download results to the Google Ads automatic bid management systems.
- Segment users depending on which stage of the funnel they’re in and send these segments to advertising services.
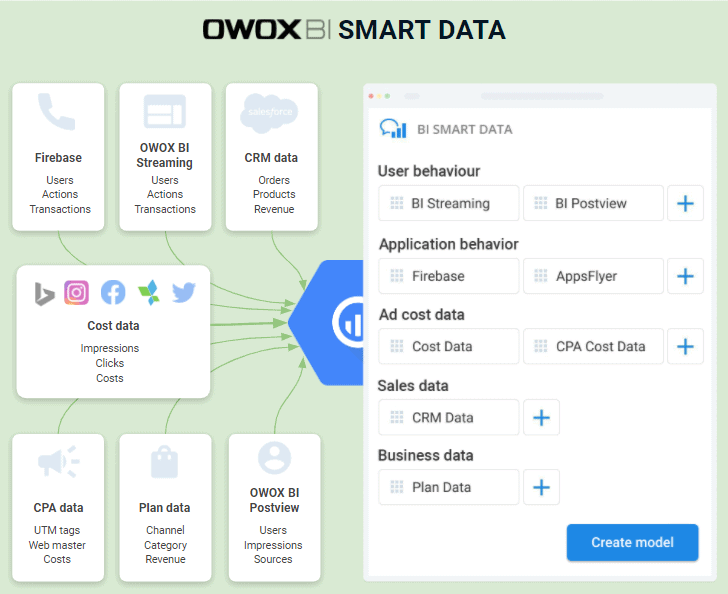
7. OWOX BI Smart Data
You can benefit from the OWOX BI Smart Data service if:
- You have to wait hours or even days for a new report when you need it here and now.
- Your main attribution models remain Last Click and associated conversions, but you know that these models don’t provide an objective assessment.
- Gigabytes of user data are available to you daily, but you aren’t using this data to increase revenue.
- Your business loses time and money since you can’t use your data here and now.
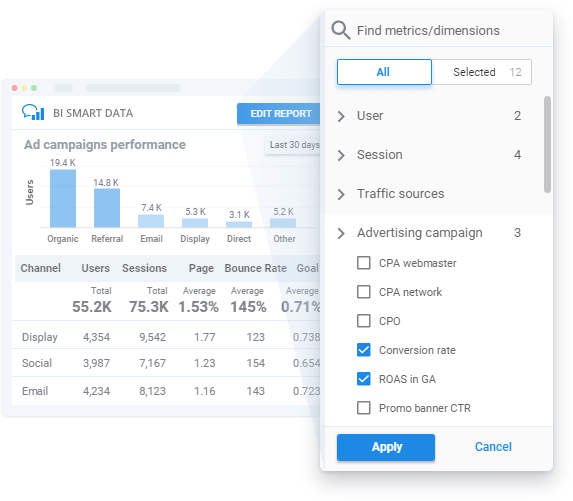
OWOX BI Smart Data helps you improve the quality and speed of hypothesis testing. With OWOX BI Smart Data, you can quickly:
- Build reports without SQL based on your business model
- Evaluate the effectiveness of advertising channels
- Analyze the quality of merchandise promotion
- Match plans to actual sales
5 reasons to build reports with OWOX BI Smart Data
- Each report in OWOX BI Smart Data is based on your business model.
- Once you connect data to your business model, you can invest the rest of your time in analysis and decision-making.
- OWOX BI provides data for your reports when you need it and doesn’t limit you to pre-built dashboards.
- With OWOX BI, you get a cross-device portrait of your customers from dozens of cookies.
- OWOX BI lets you focus on your business, not your data sources and their structure.
How to get started with OWOX BI Smart Data
In Smart Data, you can build any reports based on data you’ve collected in your Google BigQuery project.
Learn more:
- How to build a report in Smart Data
- How to connect data to Smart Data
- How to select data sources for Smart Data reports in Google BigQuery and how to download your data to BigQuery
- How to import transaction data into Google BigQuery
Data source schemes:
Export ready reports from Smart Data
If you’re used to working with data in Google Sheets or Data Studio, you can easily export a finished report from OWOX BI Smart Data and use it in these services. You can also save a finished report as a CSV file.
Get a ready SQL query
You can copy a SQL query from a report generated by Smart Data. You can then modify it or use it to automate a report in Google Sheets built on BigQuery data.

FAQ
-
What is OWOX BI?
OWOX BI helps businesses find insights and grow 22% faster than the market average. Our goal is to improve the quality of data-based business decisions. Today, OWOX BI is trusted by 27,000 users in 130 countries. We’re the leaders in the CIS region and are one of the top three solutions in the world for marketing analytics according to G2 Crowd. -
How does OWOX BI help businesses grow 22% faster than the market average?
Our product provides quality data to analysts, application reports to marketers, and insights for fast growth to business. -
How can I become an OWOX partner?
Join the partner program for agencies and freelancers. With this program, you can earn additional revenue and increase the value of your own services if you work in an advertising agency.