RFM Analysis: Learn more about your customers and RFM Segmentation
In this article (Updated in October 2023), we'll take a look at RFM (recency, frequency, monetary value) analysis, which is based on the behavior of customer groups (or segments).

This method of analysis allows you to study the behavior of users and how they make payments. As a result, you’ll receive valuable insights for direct marketing.
What is RFM analysis
Imagine you run a store, and you want to figure out who your best customers are. Instead of getting lost in a sea of data, RFM helps you categorize customers based on when they last shopped with you (that's the "Recency"), how often they shop (that's the "Frequency"), and how much they tend to spend when they do (and that's the "Monetary" part).
So, with RFM, you can give a little extra love to your top customers and maybe nudge those who haven't been around in a while. It's a neat way to make sense of your customer base!
The aim of marketing is to know and understand the customer so well the product or service fits him and sells itself.
- Peter Drucker
Understanding RFM: Recency, Frequency, and Monetary Value
Let's dive in what R-F-M stands for a bit deeper and with more context.
Recency: It’s all about the ‘when’. How long has it been since a customer made a purchase from you? If someone just bought something yesterday, they're probably more engaged with your brand than someone who hasn't shopped in a year. It's like remembering who came to your last party and who didn't. The ones who showed up recently are probably your closer buddies.
Frequency: Now, let's talk about the 'how often'. Some folks might pop into your store (or online site) regularly, like those coffee addicts who need their daily fix. Others might just drop by occasionally. Knowing how often someone shops with you can give you a good idea about their loyalty and how integral you are to their routine.
Monetary: Lastly, it’s about the 'how much'. This tells you about the buying power or spending habits of your customers. Some might be big buyers, always going for the premium items, while others might be more on the budget-friendly side. By understanding how much they typically spend, you can tailor your offers or promotions to suit their pocket.
By combining these three aspects, RFM Analysis helps businesses categorize their customers into different segments. For instance, a customer who scores high on all three aspects is a golden one — they shop frequently, they’ve shopped recently, and they spend a good amount. These are the buyers you’d want to roll out the red carpet for!
On the flip side, if someone hasn't shopped in ages, only comes by once in a lifetime, and barely spends anything, they might need a bit more incentive or engagement to get them back on track and increase their score.
Your most unhappy customers are your greatest source of learning.
- Bill Gates
All in all, RFM Analysis is a brilliant way to personalize your marketing efforts. Instead of treating all customers the same, you can understand their habits and preferences better and tailor your approach to match. It’s like having a cheat sheet for building stronger, more meaningful relationships with your customers and growing sales!
Why RFM Analysis Matters for Your Business
RFM Analysis is like a secret weapon in your business toolkit. Utilizing RFM Analysis allows businesses to segment their customers into various categories based on their purchasing behavior. This insight, based on Recency, Frequency, and Monetary value, can then be efficiently used for personalized marketing campaigns and strategies. Let's dive into what you can do with RFM analysis and why it's such a game-changer for businesses, whether it's a large established business with lots of data or a startup.
Understanding customers better
At its core, business is all about relationships. Think of RFM Analysis as a magnifying glass, helping you zoom in on what your customers truly want.
By understanding how recent, frequent, and how much they spend, you're essentially learning their buying behavior. This knowledge is power - it’s the difference between guessing what your customers might like and actually knowing it.
Tailoring marketing efforts
Imagine throwing a party. Would you serve the same drinks to everybody? Probably not, right? Similarly, RFM allows you to tailor your marketing campaigns.
Instead of sending generic promotions to your entire customer base, you can craft targeted promotions and special offers that resonate with specific customer segments. This increases engagement and, more importantly, sales.
Money and effort allocation
Let's face it, in business, resources - whether it's time or money - are always limited. RFM Analysis is like your savvy business advisor, guiding you on where to invest. Instead of spreading your efforts thinly across all customers and praying for success, focus on the ones who bring the most value, ensuring a better return on investment.
Predict future buying behavior
The beauty of RFM is that it's not just retrospective; it has a crystal ball quality*. By analyzing past behaviors, you can predict future ones. This means you can anticipate needs, preferences, and potential churn, putting you a step ahead in addressing them. Predictive modeling helps businesses forecast the customers' future actions, aiding in optimal strategy formation for marketing, sales, and customer management efforts.
* the quality of your reports always depend on the quality of data collected.
Building relationships
Last, but by no means least, RFM facilitates relationships. By understanding and catering to your customers' habits and preferences, you’re showing that you care. And in the world of business, a little bit of care goes a long way. It’s the difference between a one-time shopper and a loyal customer who raves about you to their friends.
In essence, RFM Analysis isn't just about numbers or data; it's about people. It’s a bridge that connects businesses to their customers in a deeper, more meaningful way. So, if you're aiming to be not just a business but a brand that's loved and treasured, RFM should be right up there in your strategy playbook!
At this point, you might be wondering how to get started with RFM analysis. Don’t worry, we've got you covered. Next, we'll guide your through a detailed step-by-step plan on how to sail through RFM Analysis, using common tools like Google Sheets. Ready? Let’s begin.
Getting Started with RFM Analysis: Step-by-Step Guide
When it comes to data analytics tasks, it all starts from the Plan: you define the Business Goals, the Questions you supposed to be asking and the Metrics you need to measure.
In our case - we already know all that information, we want to improve the revenue from existing list by segmenting the uses, so we can create more targeted campaigns. Out questions as well as the metrics are related to the whole R-F-M framework.
For each of these metrics, we assign customers to one of three groups, which are assigned a number from 1 to 3.
Recency:
- 1 – long-standing customers.
- 2 – relatively recent customers.
- 3 – recent customers.
Frequency:
- 1 – purchases rarely (single orders).
- 2 – purchases infrequently.
- 3 – purchases often.
Monetary value:
- 1 – low value of purchases.
- 2 – average value of purchases.
- 3 – high value of purchases.
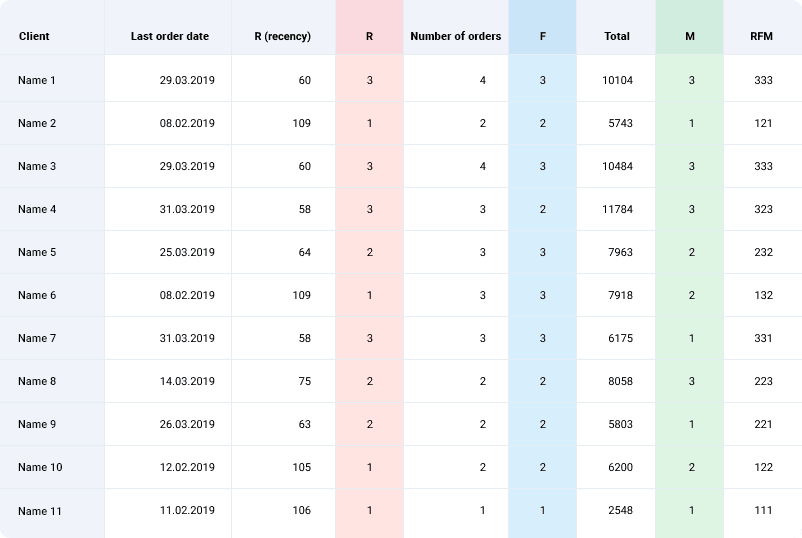
Customers are assigned RFM values by concatenating their numbers for Recency, Frequency, and Monetary value. For example, customer 111 made one order with a low monetary value a long time ago. Customer 333, on the other hand, often makes large-value orders and made a purchase recently. Customers with 3’s in every category are your best customers.
Now we need to Collect the data. We start from gathering the necessary data about your customers.
Step 1: Collect the necessary data
You will need data on customer transactions (orders), including the date of the transaction, the customer ID, and the monetary value of the transaction (order amount). This data can typically be obtained from your CRM, ERP or database.

Step 2: Prepare data for analysis
With purchasing behavior data collected, the next move is to prepare our data for RFM analysis, we need to make our raw data analysis ready.
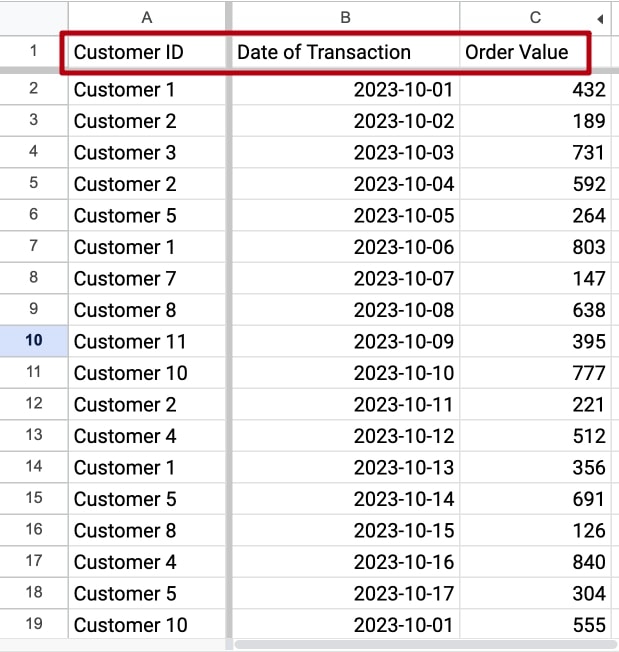
Let us assume you have a table of customer transactions.
- In Column A you have the Customer Identification - like userid,
- Column B - Date of Transaction,
- Column C - Order Value
RFM Data preparation in Google Sheets & Excel
To calculate the recency in Google Sheets or Microsoft Excel, first we need to find the lates transaction date for each of the customers. Let's create a new column and call it DaysSinceTransaction.
The formula would be =TODAY()-B2. Here, 'TODAY()' returns the current date, and 'B2' refers to the cell containing the date of the last transaction for a particular transaction. The result will be the number of days since the transaction.
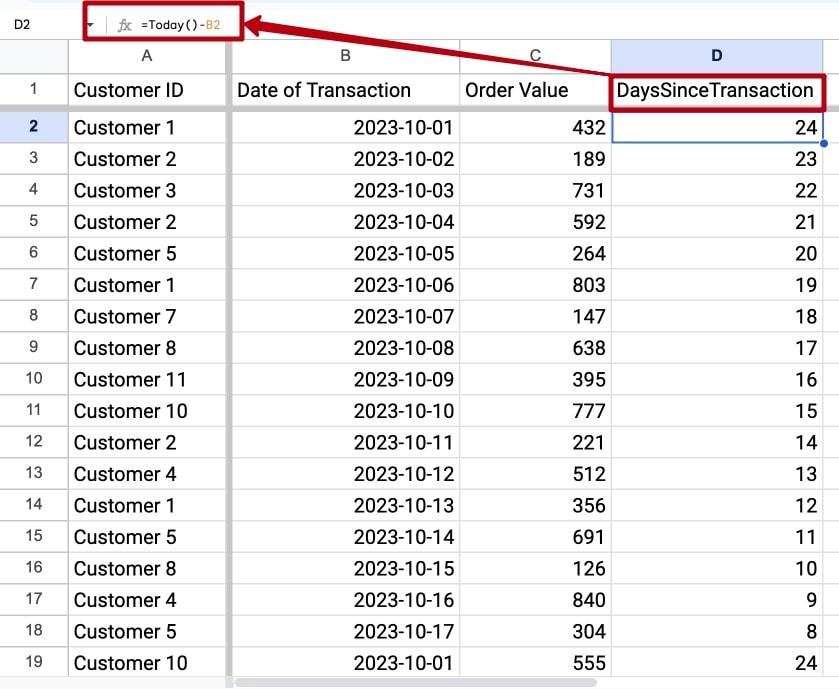
We’ve successfully gathered all the transactions and their corresponding customer IDs. Plus, we've also determined the number of days that have passed since each transaction.
Given that our database contains a list of multiple transactions for individual customers, it's important to select only the most recent transaction date for each customer when calculating Recency.
So how do you pinpoint the latest transaction date after establishing the number of days passed since each transaction?
Let's select the data range, click Insert -> Pivot Table.
Add Customer ID as Rows.
Add DaysSinceTransaction as a Value. And summarize by MIN.
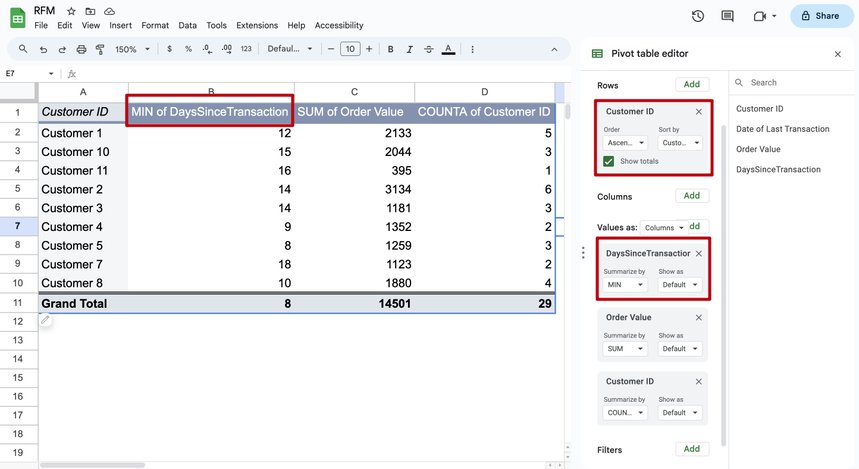
This would help us achieve us a smaller dataset with a single, latest transaction date per customer.
When the aforementioned steps are done correctly, Google Sheets will then generate a new pivot array. This dataset solely consists of rows showcasing each unique customer ID in tandem with their most recent transaction dates.
Next, add the Customer ID summarized by COUNTA to Values now to save our time later.
Let's also calculate the total value of all orders for each customer. To do this, add Order Value as a Value to get the total amount spent per customer, and in the Summarize by column, indicate SUM.
That’s it for analysis preparation.
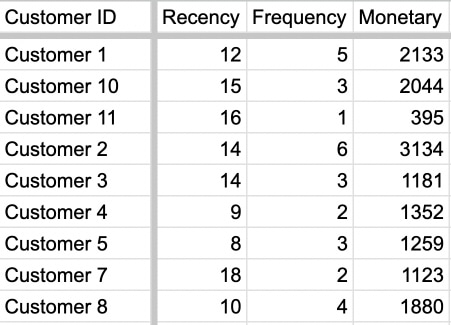
Now we need to copy this pivot table data to a new sheet to calculate RFM values, and rename the columns to Recency, Frequency and Moneraty.
RFM Data preparation with SQL
In SQL, you'd typically utilize the DATEDIFF function to get the DaysSinceTransaction.
Assuming your table of customer transactions contains a column named 'DateOfTransaction', the SQL query would be:
SELECT DATEDIFF(day,DateOfTransaction, GETDATE()) as DaysSinceTransaction FROM CustomerTransactions.This query returns a list of customers together with the transactions and the number of days since their last transaction.
You can utilize SQL to fine-tune your data. It allows you to pick the most recent date for each customer by grouping the transactions by customer ID and using the MIN function. This SQL function gives you the been the lowest value in the selected column, in this case, the least amount of days since last transaction.
Your SQL command may look like this:
SELECT customer_id, MIN(DaysSinceTransaction)
FROM CustomerTransactions
GROUP BY customer_id
After running this command, you'll have a list with each customer's most recent transaction identificator, which aligns perfectly with the recency aspect of RFM Analysis.
Once you've gathered the necessary data, you can pivot or group the 'customer_id' by the respective order value with SQL, helping you calculate the monetary value and frequency components of RFM. Start by running a simple query for this.
Here's a substance to illustrate:
SELECT customer_id, SUM(order_value) AS total_order_value, COUNT(*) AS no_of_transactions
FROM CustomerTransactions
GROUP BY customer_id
This SQL statement does two things. It first groups all orders that belong to each customer, represented by the 'customer_id'. Following that, it calculates the total order value and the number of orders for each customer.
The 'SUM(order_value)' expression calculates the total spent by each customer, thus representing the 'Monetary' part of RFM.
By applying 'COUNT(*)', the query counts the number of rows for each customer, thus representing the 'Frequency' part of RFM.
You can run this SQL query in typical SQL environments like Google BigQuery, Postgres, SQL Server, or OWOX BI and it should produce a list of your customers alongside their total purchase value and frequency of transactions.
Once you have the data, the next step is to assign RFM scores to each customer. This involves going through the data and categorizing each customer based on recency, frequency, and monetary (RFM) value.
Step 3: Calculate recency
The Recency score represents how recently a customer made a purchase, with a higher score indicating a more recent purchase.
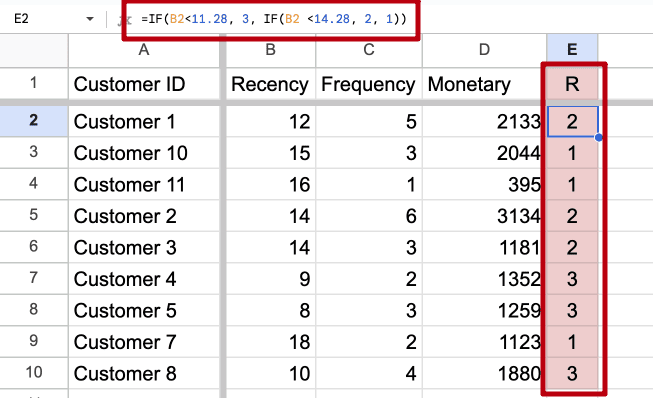
The first thing we need to do is calculate how long 33% and 66% of our customers have bought from us. This is easily done using the formula =PERCENTILE.INC ([range]; 0.33) and = PERCENTILE.INC ([range]; 0.66).
We now know that 33% of customers bought our products less than 11.28 days ago, and 66% bought less than 14.28 days ago.
- Accordingly we assign those customers who bought less than 11.28 days ago the highest value of 3.
- Those who placed an order from 11.28 to 14.28 days ago are assigned a value of 2.
- The rest, who bought more than 14.28 days ago, we assign a value of 1.
All this can be automatically calculated with the formula =IF(B2<11.28; 3; IF(B2 <14.28; 2, 1)).
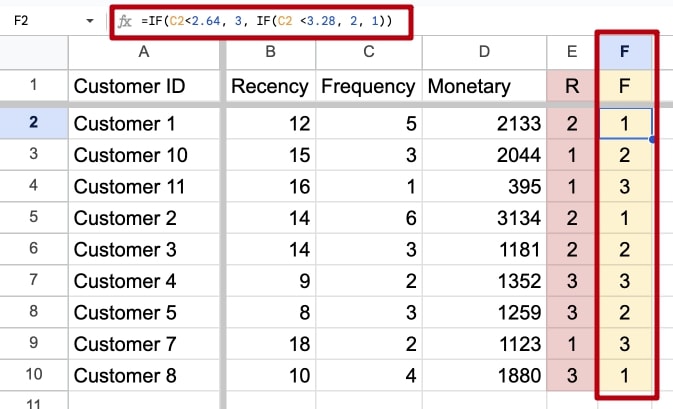
Step 4: Calculate frequency
The Frequency score measures how often a customer makes purchases, with a higher score indicating more frequent purchases.
Using the same principle, we calculate the values for F (Frequency): first, we calculate how many times 33% and 66% of our customers made a purchase and, based on the results, assign values from 1 to 3.
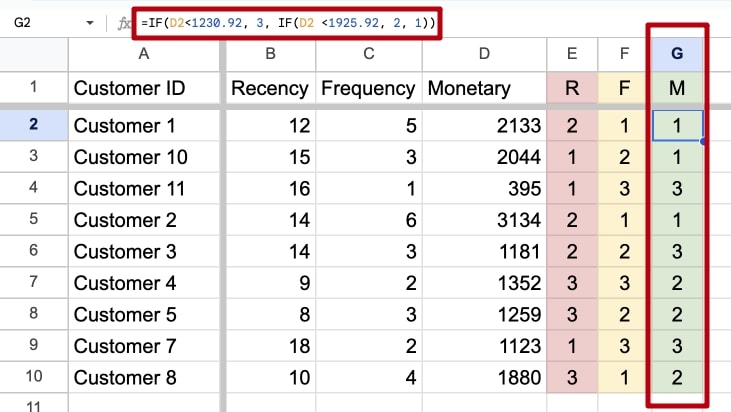
Step 5: Calculate monetary value
The Monetary score reflects the total value of a customer's purchases, with a higher score indicating higher spending.
Using the same principle, we calculate the values for M (Monetary Value): first, we calculate how much have 33% and 66% of our customers spent and, based on the results, assign values from 1 to 3.
Step 6: Calculate RFM Score
Once you have the R, F and M values, you need to calculate the RFM score for each customer. We concatenate all three values for each customer. We can do that using the formula =E2*100+F2* 10+G2.
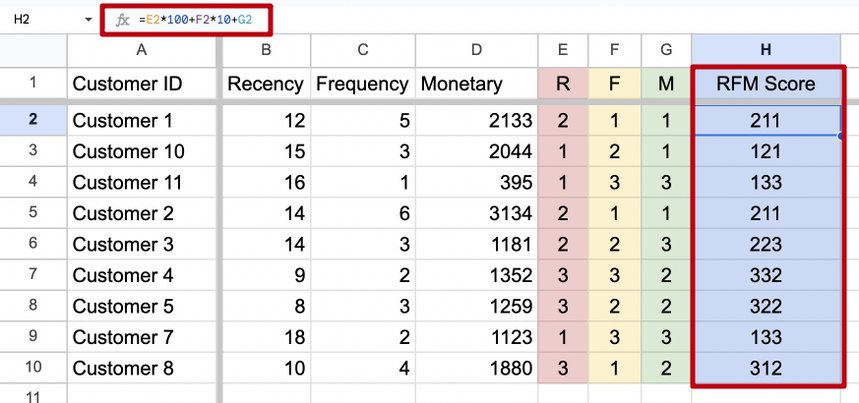
That’s it. We’ve made all the necessary calculations for RFM analysis in Google Sheets (or Excel).
All you have to do now is to sort range by RFM Score and plan on how to engage with those groups or segments based on priorities. Look for patterns and trends within each segment to understand their behavior and preferences. Tailor your marketing strategies and offerings to better serve each segment.
Now you can analyze each segment to gain insights.
Look for patterns and trends within each segment to understand their behavior and preferences. Tailor your marketing strategies and offerings to better serve each segment.
Bear in mind, that although these formulas help to automate some calculations, you still have to spend a lot of time calculating RFM score manually. Especially if you have a larger data set of hundreds, thousands or even millions of transactions over time.
Based on the insights gained from the RFM analysis, take action to improve customer engagement and retention. Develop targeted marketing campaigns for each segment, offer personalized promotions, and provide exceptional customer service to enhance the overall customer experience.
Remember, RFM analysis is an ongoing process, so regularly update your data and repeat the steps to keep refining your customer segmentation and strategies.
I hope this step-by-step guide helps you understand how to perform RFM analysis and leverage it to gain valuable insights about your customers!
How to use RFM analysis in marketing
When all the calculations are ready and you’ve segmented your customers, it’s time to move on to the marketing part.
By grouping customers by RFM values, you can immediately get a complete picture of what’s happening with your customer base. Let’s look at examples of some client groups.
Group 3R-3F-3M – the most active, buy often
These are your ideal customers. It’s possible to expand your engagement with them by launching a loyalty program, inviting them to special events, or asking them about how they would want the company to develop. It’s important to show these customers that they’re respected and welcome users.
Group 1R-1F-1M – the least active, bought once / never, spent little
Although these customers seem to be the least promising, you shouldn’t write them off completely: they showed interest in your products at least once. Most often, marketers prepare special provocative messages to divide these customers into “definitely disinterested in the product” and “promising.” Promising customers can be transferred to the next category.
1 in one of the categories
Some of your customers may have a value of 122 (lame Recency). This segment should be given a little time to decide about returning to you. Try to offer them products that are usually bought along with those that they purchased earlier in order to arouse a renewed interest in your company.
3 in one of the categories
These users are a promising segment for your research. They’re consistent enough for you to experiment and find a suitable way to raise their other indicators.
Useful materials to help you master the topic:

Key takeaways
- RFM (Recency, Frequency, and Monetary value) analysis is an essential business tool that helps understand customer behavior and identify high-value patrons and apply individual approach to your customers.
- This technique is beneficial for better understanding customers, tailoring marketing efforts, allocating money and effort accurately, predicting future buying behavior, and fostering customer relationships.
- Performing an RFM analysis involves a sequence of steps including data collection, data preparation, calculation of recency, frequency, and monetary value, and finally calculating the RFM score. This process can be facilitated through common tools such as Google Sheets, Excel, or using SQL.
- RFM analysis aids in uncovering high-value customers which helps optimize marketing strategies and increase profitability.
- The Recency element of this analysis focuses on buyer habits and tendencies, while the Monetary value aspect highlights the direct financial impact of customers on your business. This comprehensive view enables a more targeted approach in customer management and marketing.
- At the same time, keep in mind that data is influenced by seasons, promotions, and holidays. If a customer with an extensive purchase history for the current month doesn’t buy anything next month, this doesn’t mean you should immediately transfer them to another segment. Perhaps this is just the effect of seasonality, and after a while, they’ll resume purchasing.
FAQ
-
What is RFM analysis?
RFM analysis is a technique used in customer segmentation to identify and target the most valuable customers based on their purchase behavior. It uses three measures: recency, frequency, and monetary value. -
How is RFM analysis conducted?
To conduct RFM analysis, customers are segmented into groups based on recency, frequency, and monetary value scores. These scores are calculated based on the time since the customer's last purchase, the number of purchases made, and the total amount spent. -
What are the benefits of using RFM analysis?
RFM analysis can help businesses identify their most valuable customers and target them with personalized marketing campaigns. It can also help businesses improve customer retention and loyalty by identifying customers who are at risk of churning.