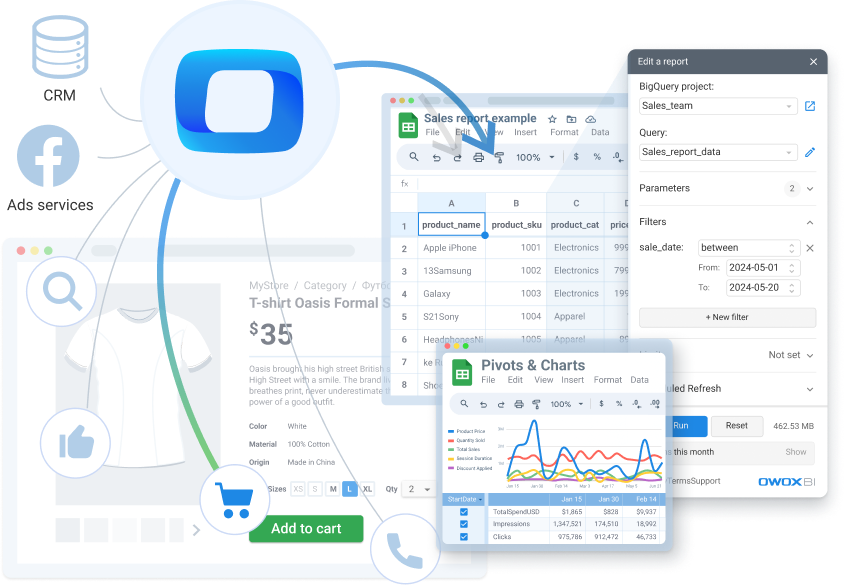
Own your data connectivity
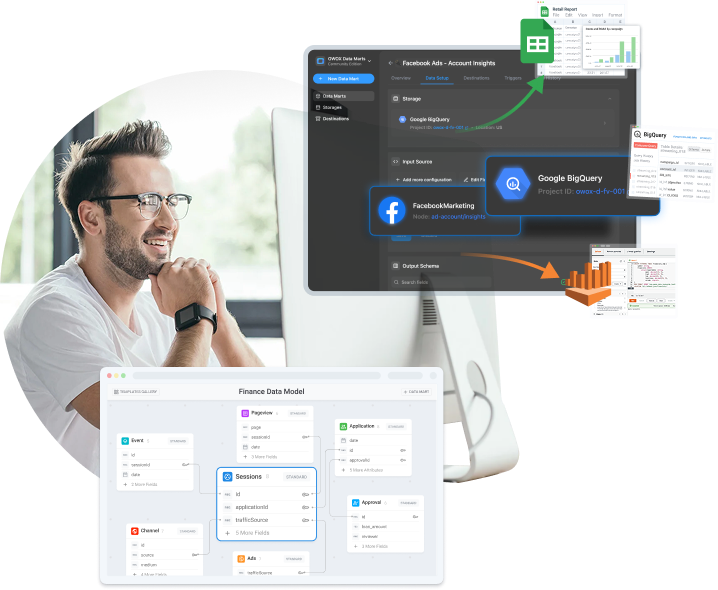
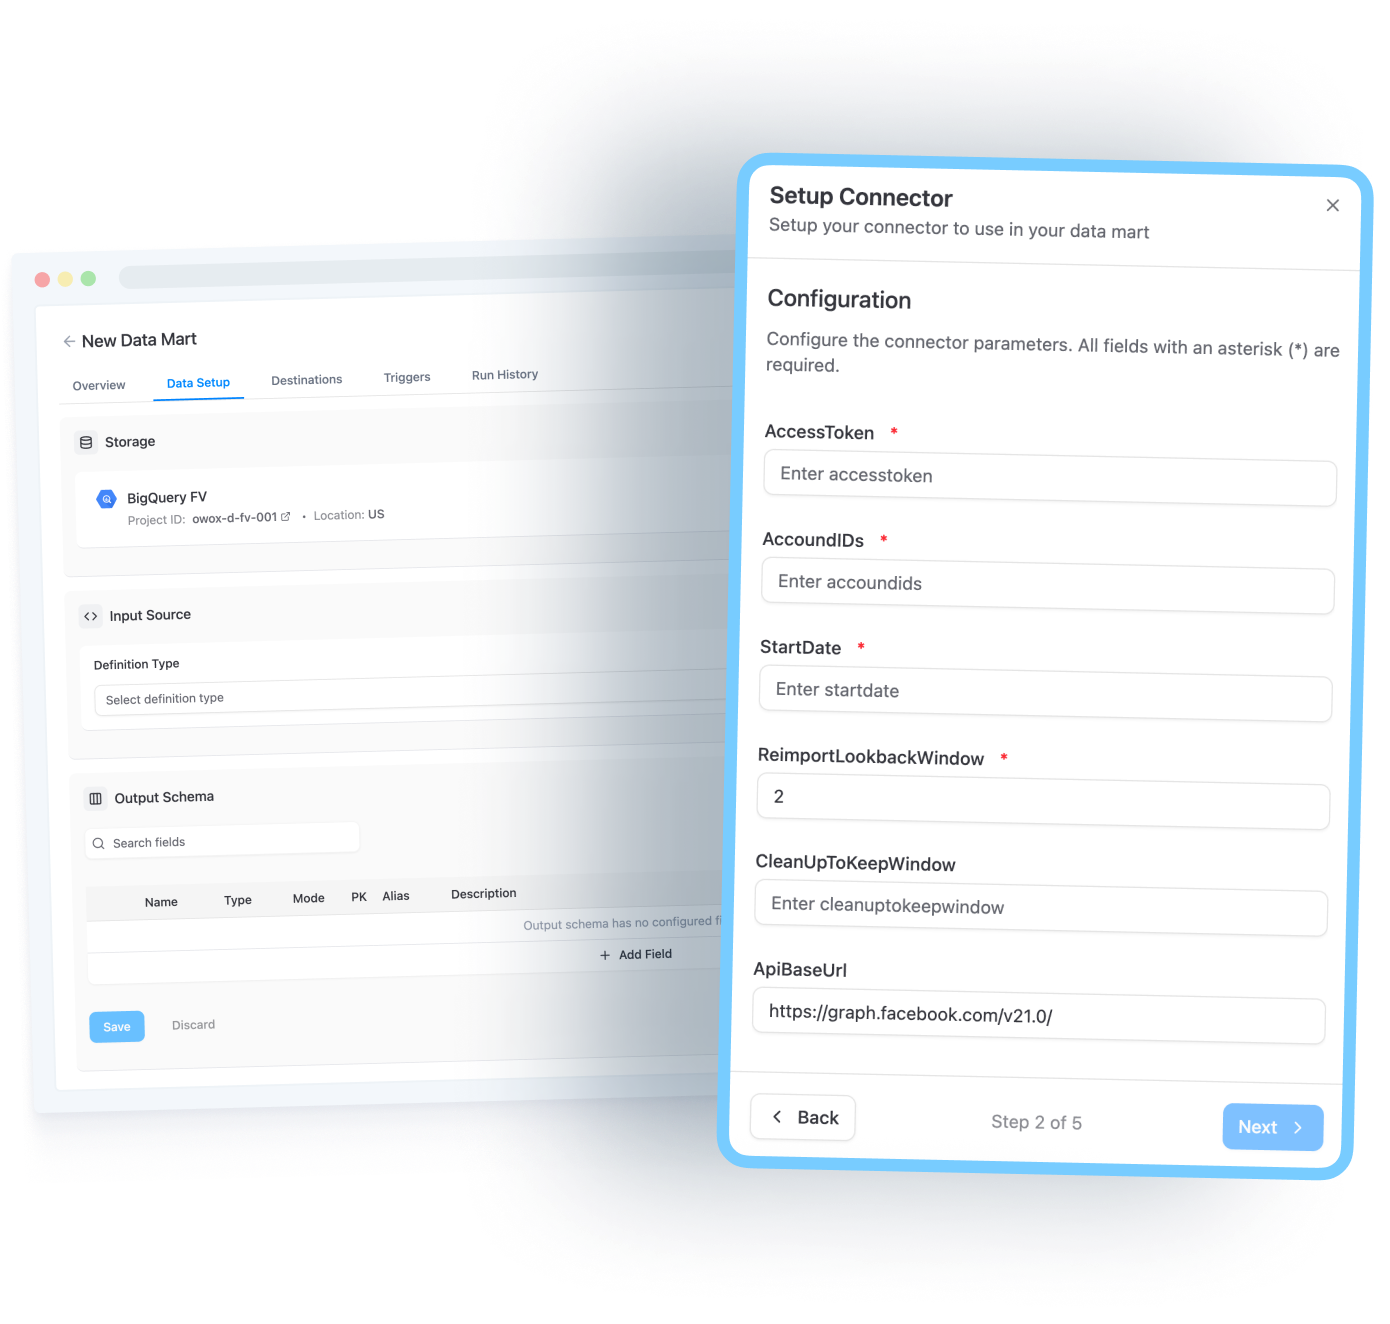
Use OWOX Data Sources to extract data from any ads platform, CRM, database or any platform with API – with transparent logic, full visibility, credentials stored on your side and zero vendor lock-in.
Whether it’s Facebook Ads, or your Quickbooks you decide what’s exactly pulled, how, and when.
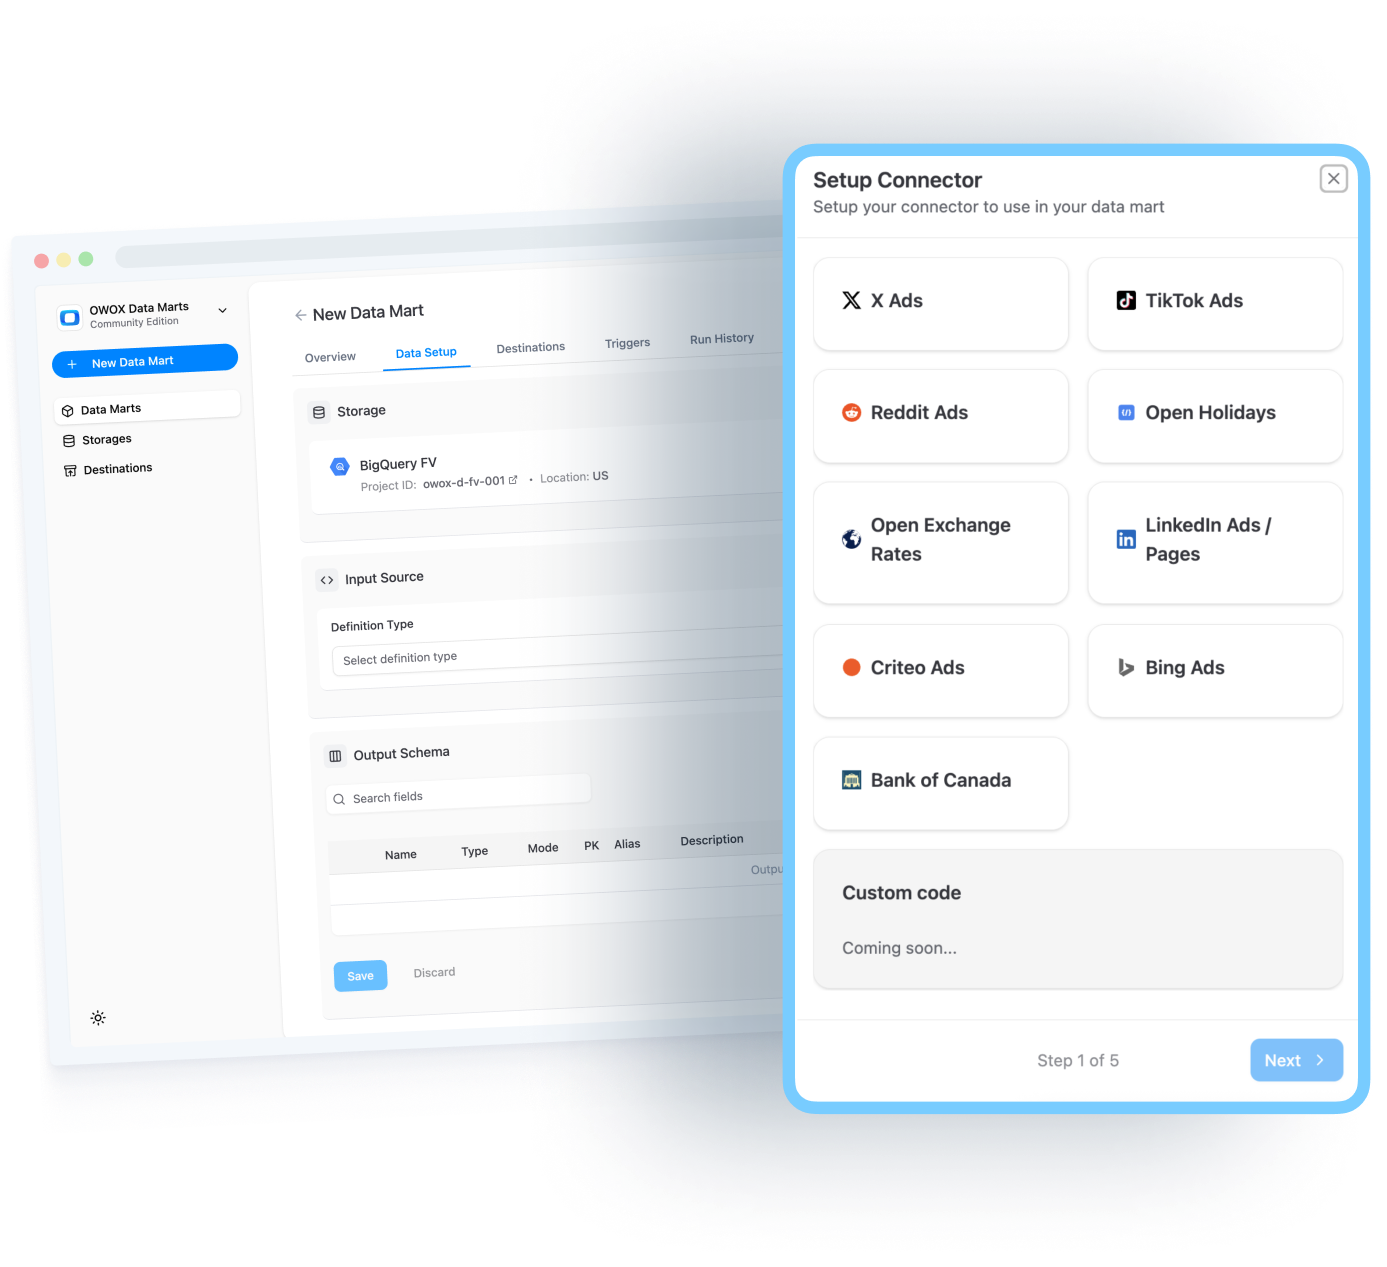
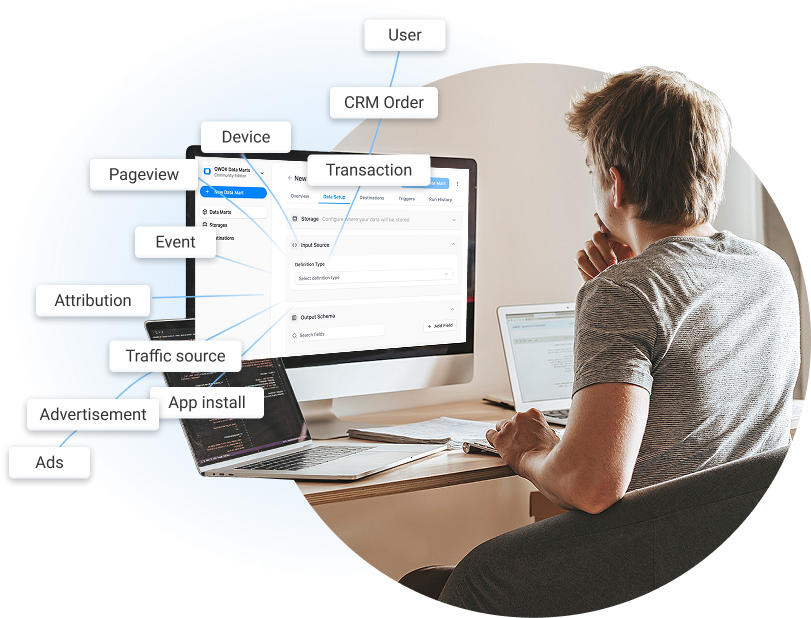
Move beyond standard data sources
With support for any API, structured schema, and custom-built logic, OWOX enables you to connect not only most of the popular ads platforms (Facebook, TikTok, Linkedin Ads, Criteo Bing or much more), but also your financial systems (like Quickbooks or Xero), CRMs (like Hubspot or Salesforce), and databases (like PostgreSQL or MySQL).
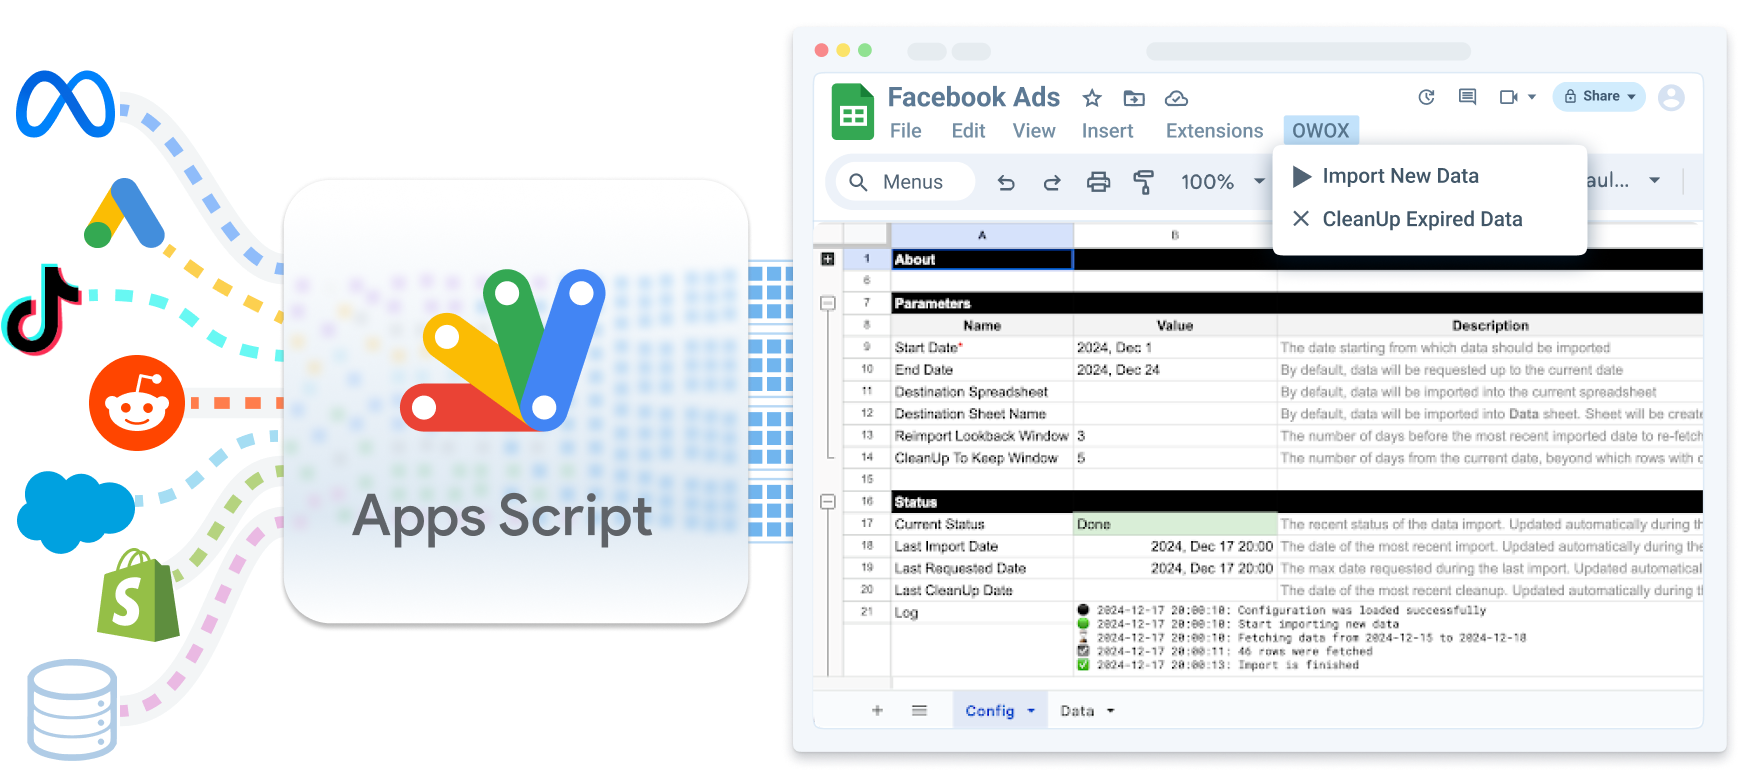
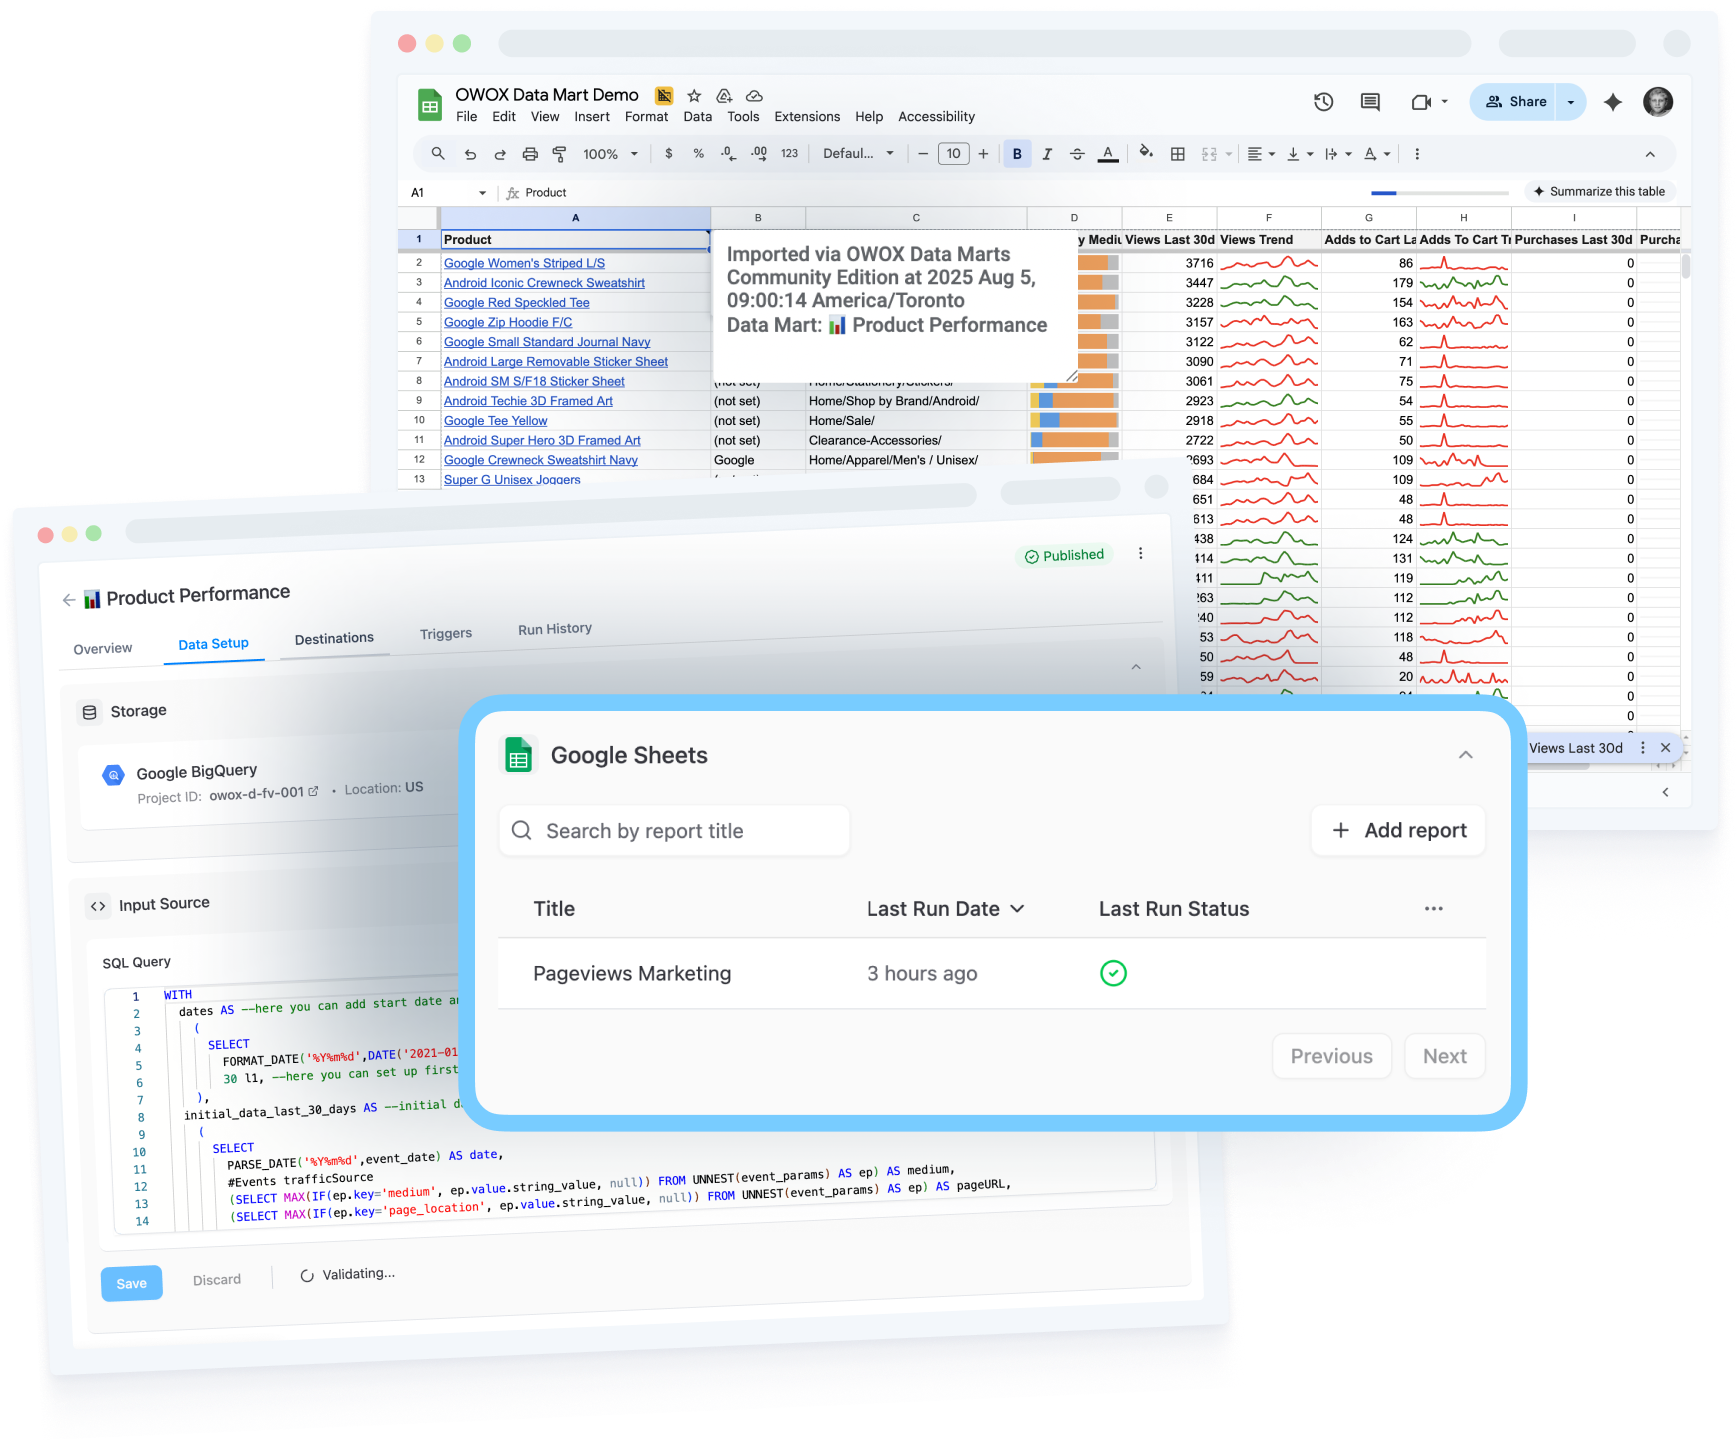
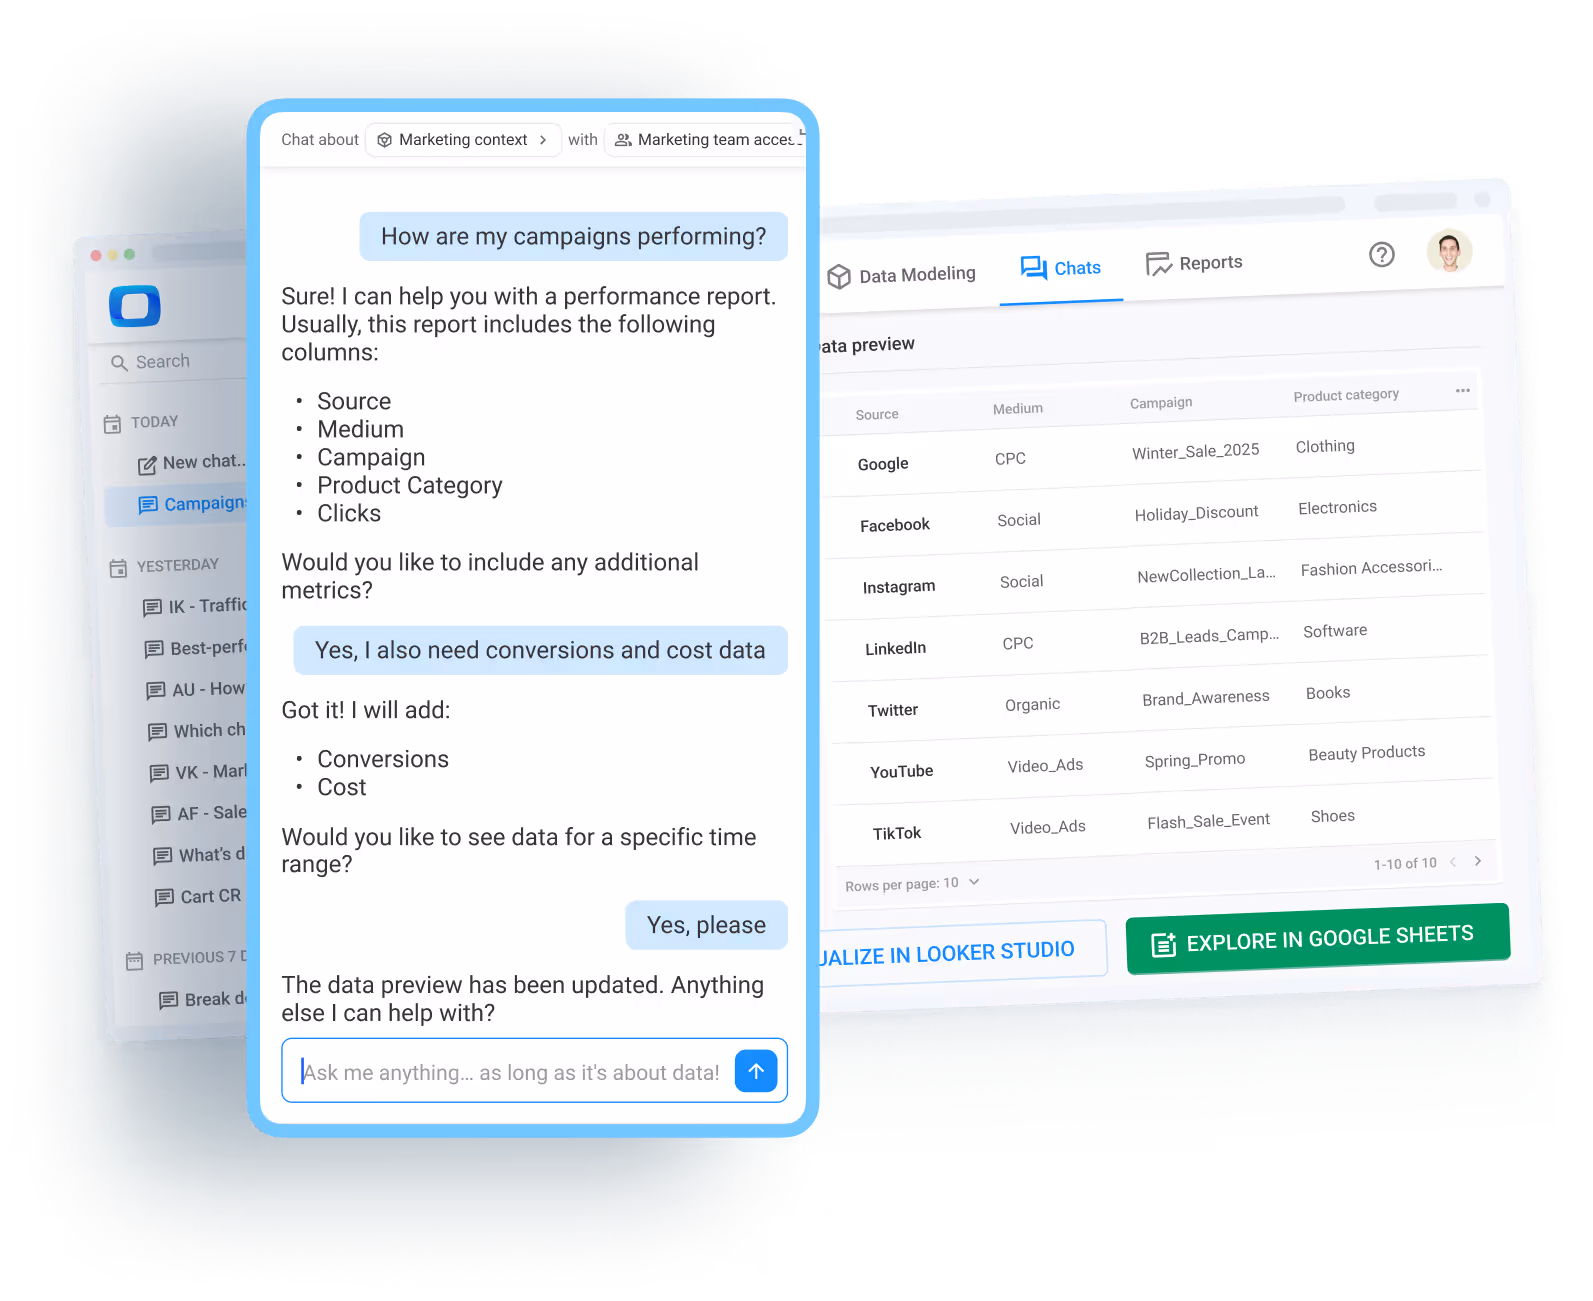
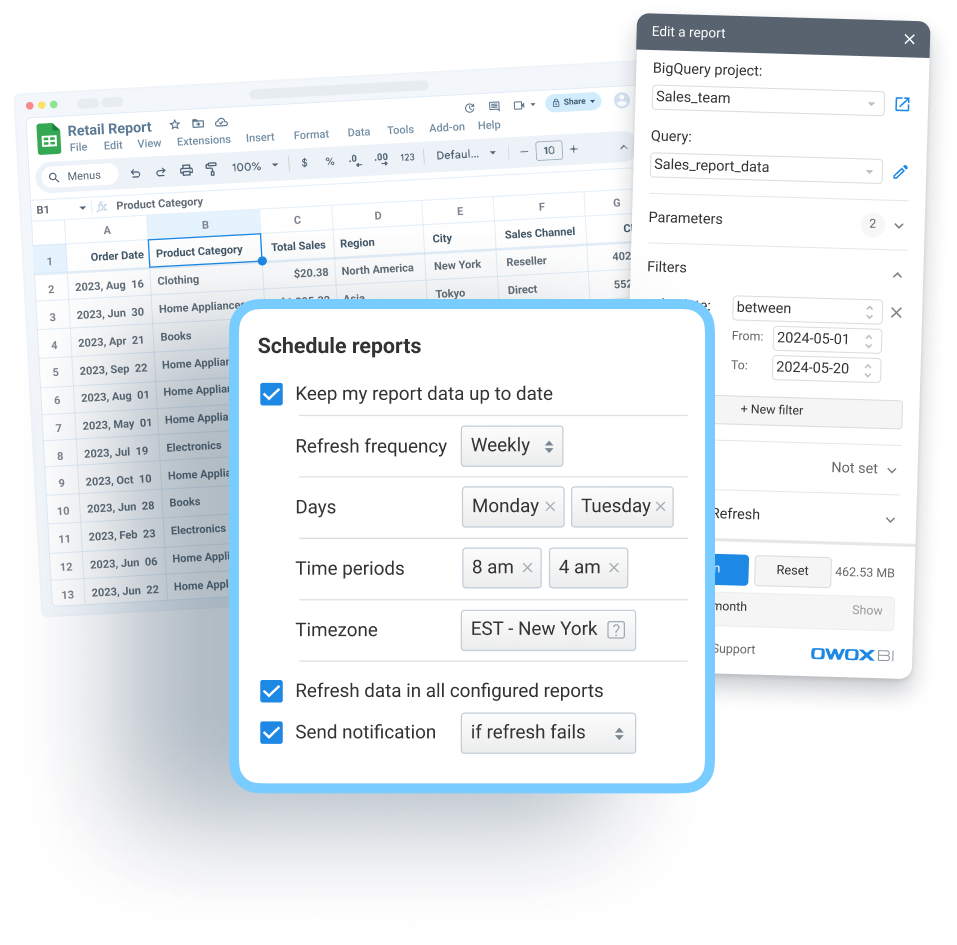
Bring data to where humans work
Import data from your data warehouse directly into Google Sheets. Enable automatic refresh schedules, and give teams instant access to real-time, trusted business reports.
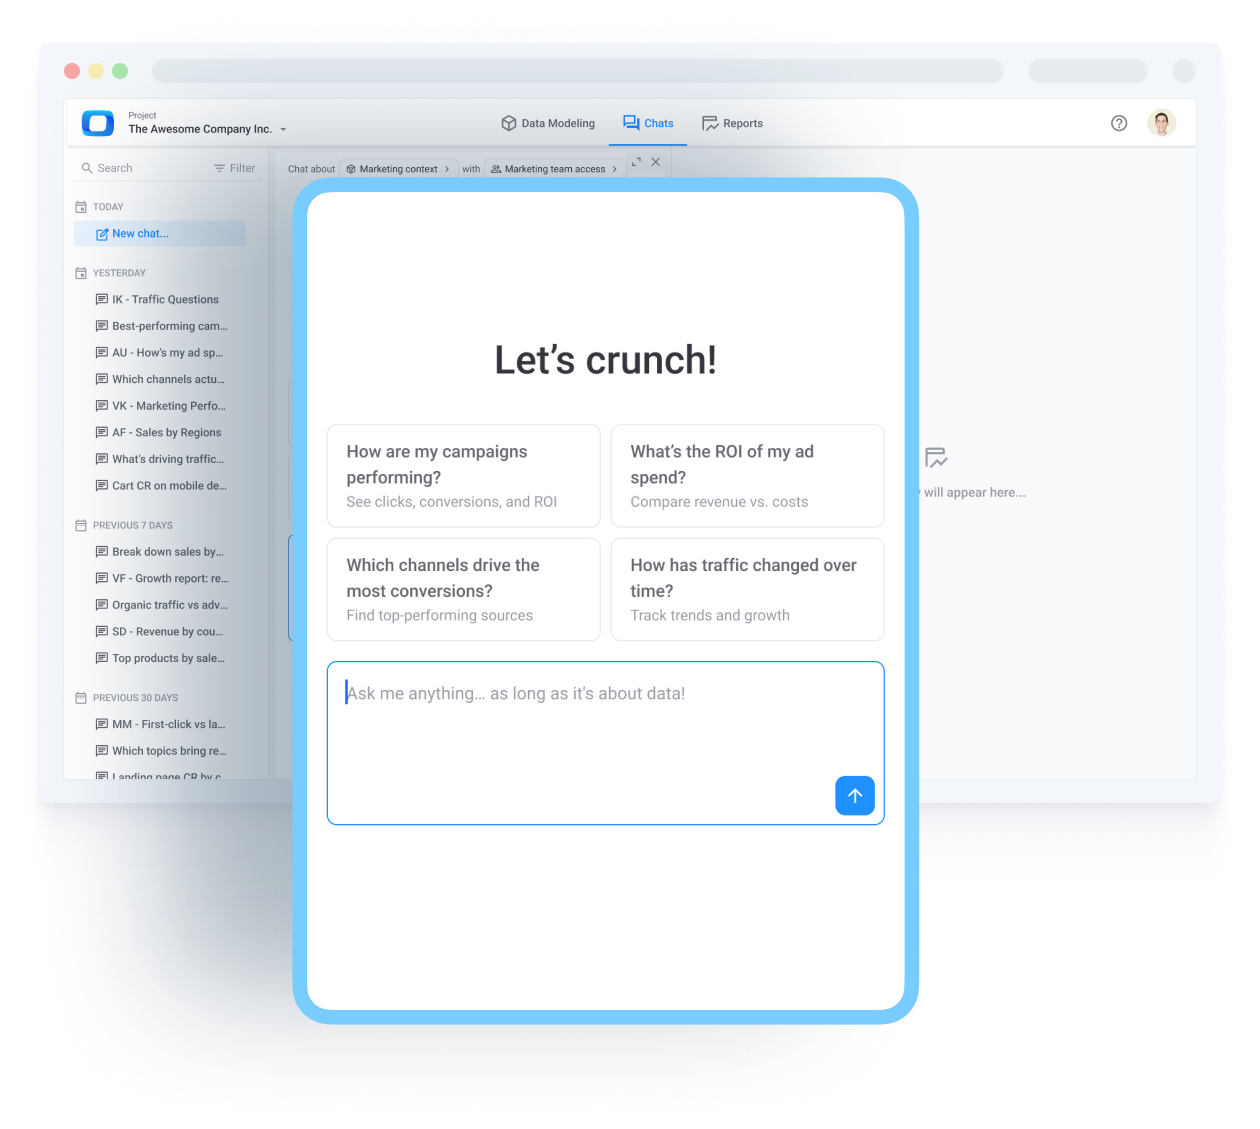
Semantize your data & enable business users to use coversational UI to get trusted reports on their own.
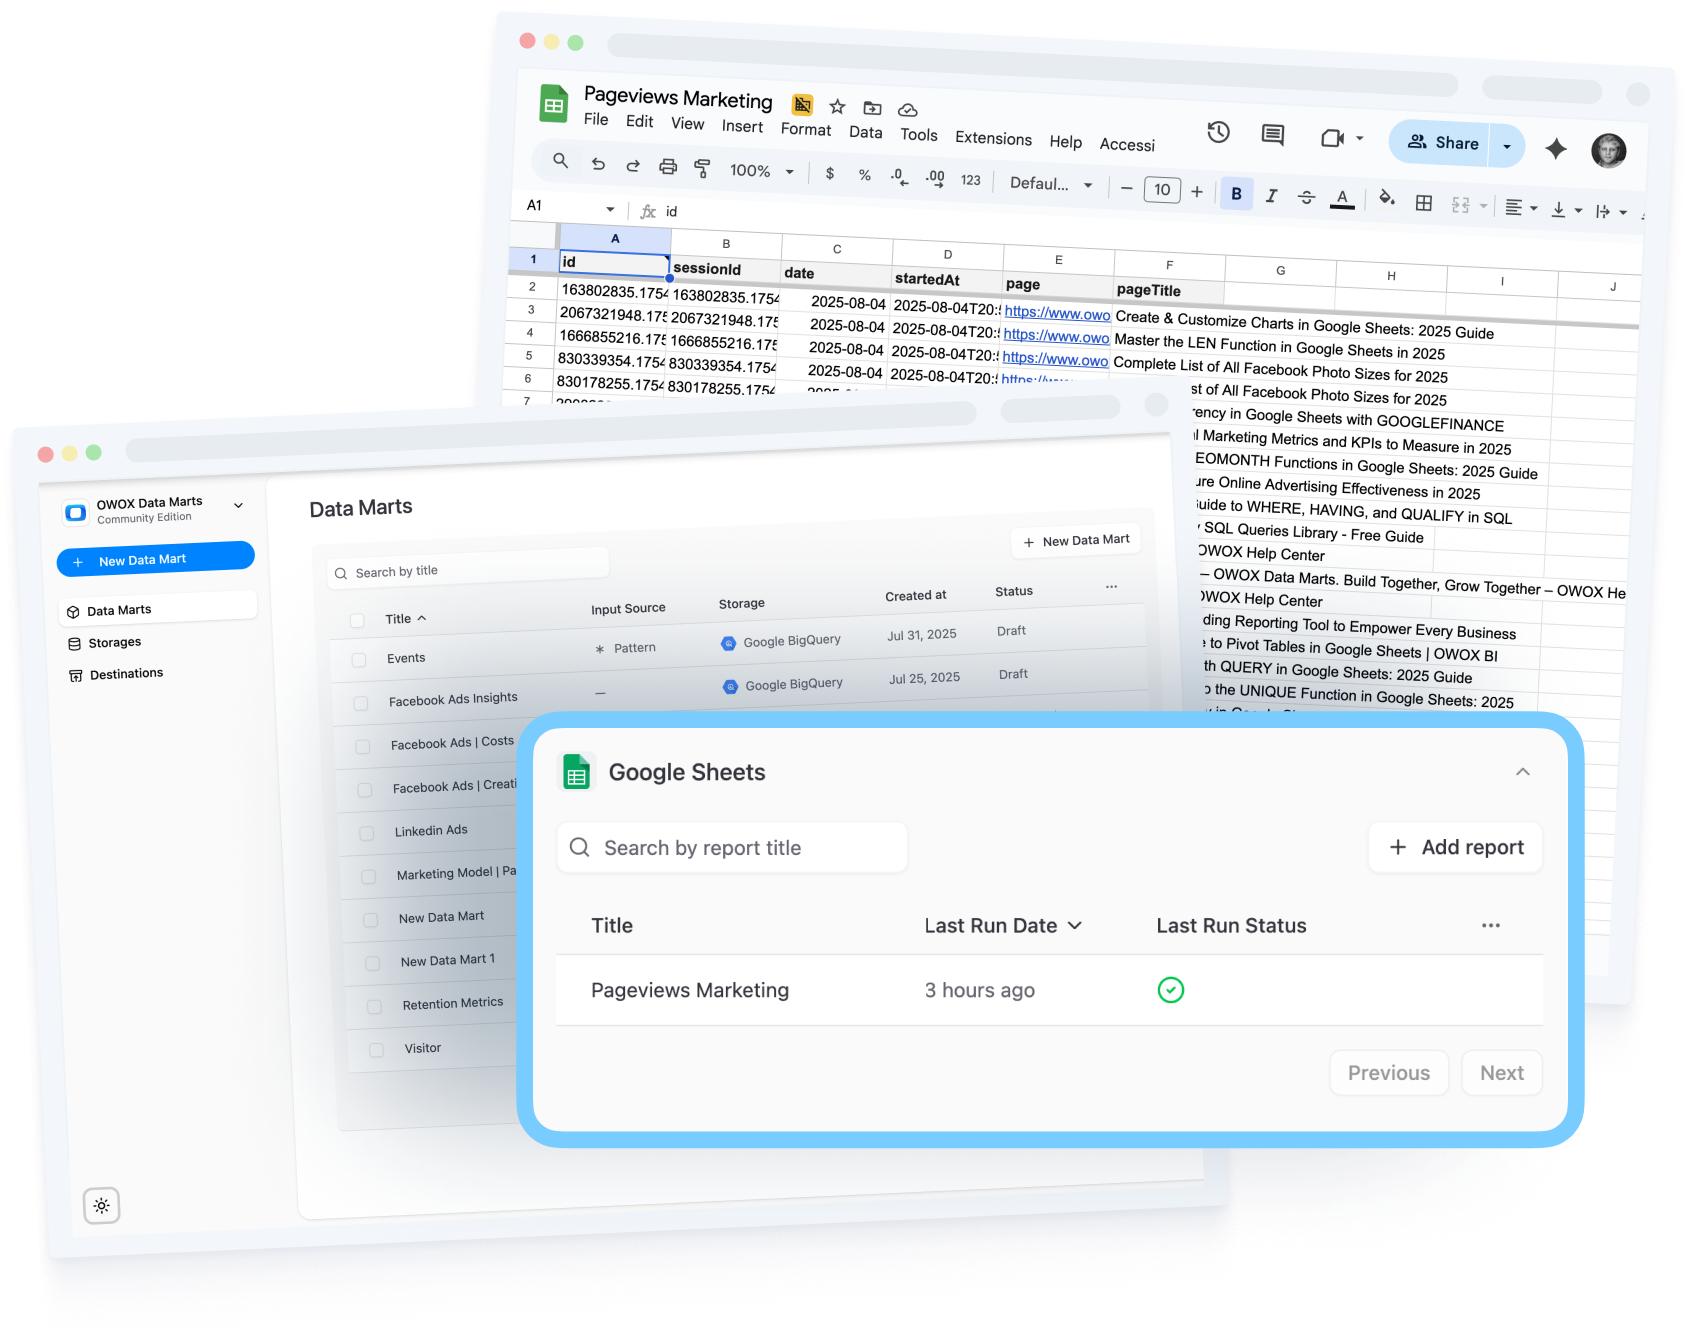
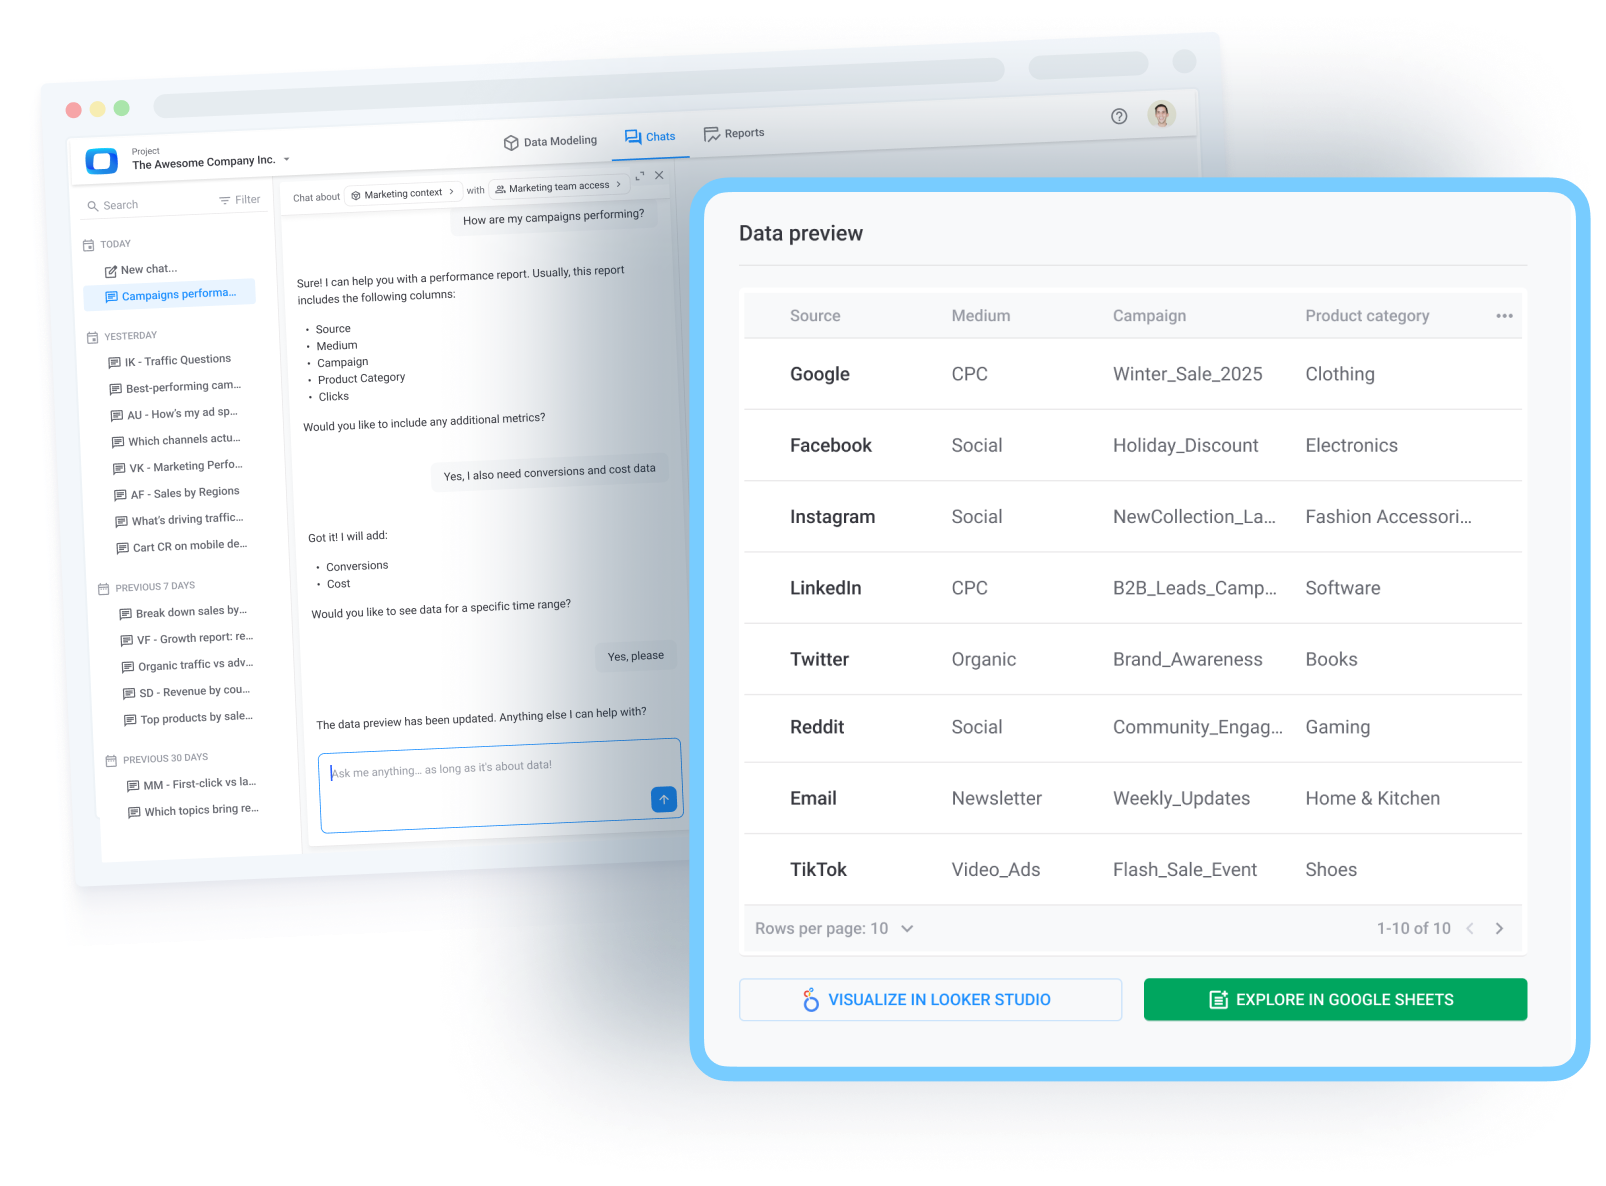
Supercharge spreadsheet business reporting
Transform Google Sheets into a live, governed reporting layer connected to your data warehouse:
(1) Build a shared library of data marts for your team;
(2) Instantly connect OWOX Data Marts to Google Sheets;
(3) Apply filters, create pivots, and build formulas – all powered by live data.
No more outdated data or fragile spreadsheet logic.
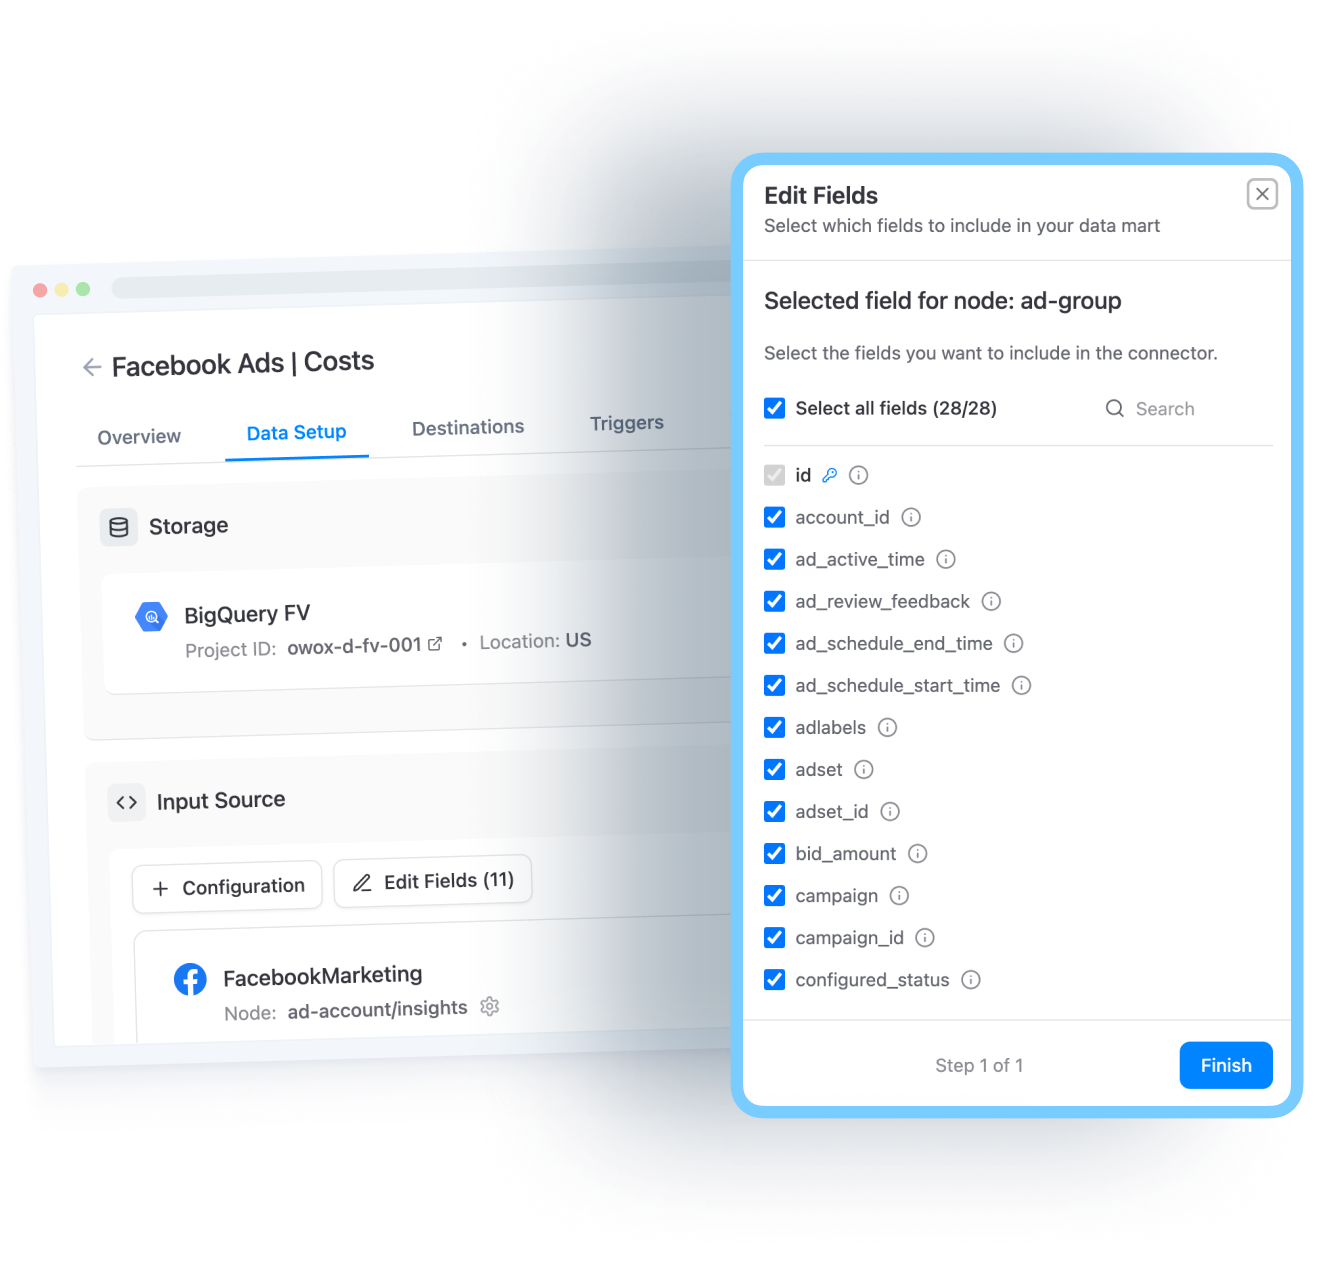
Tailor reports to match business goals
Give teams the flexibility to filter, shape, and manage their own reports:
(1) Apply filters to pull only relevant data from broader data marts;
(2) Select the fields and metrics that matter to your business;
(3) Save and reuse filter sets for consistent views across teams.
OWOX Data Marts detects field types and suggests relevant filters automatically.
‘Date’ and ‘Limit’ filters come pre-configured, while every user can build on top.

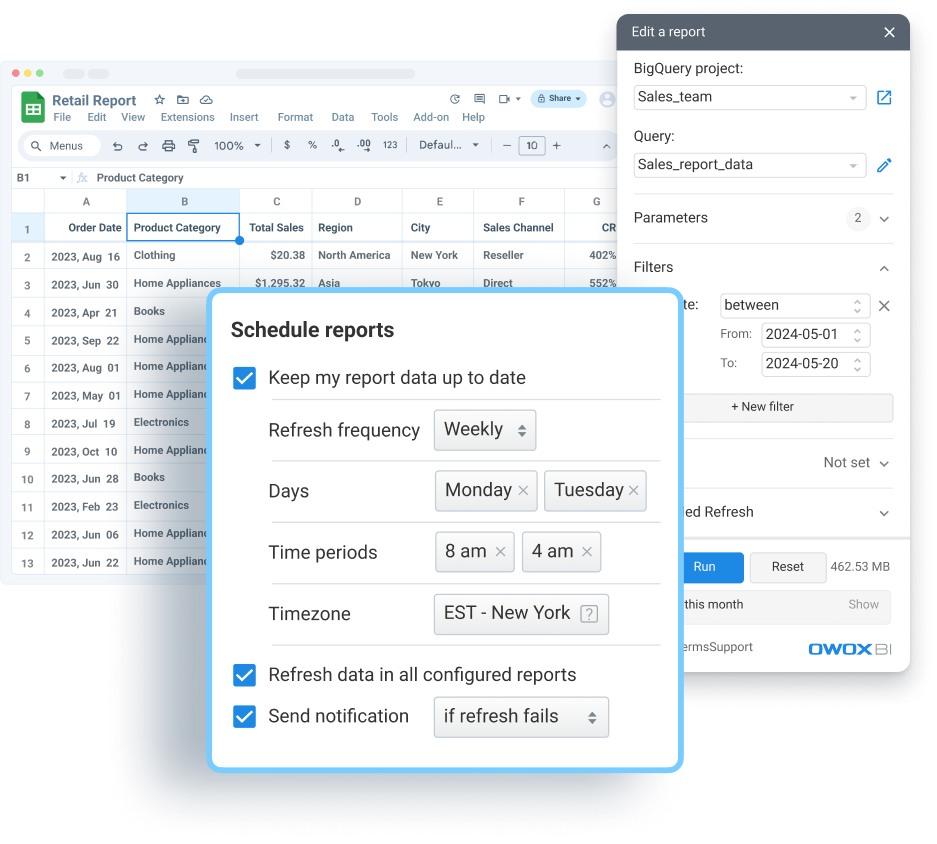
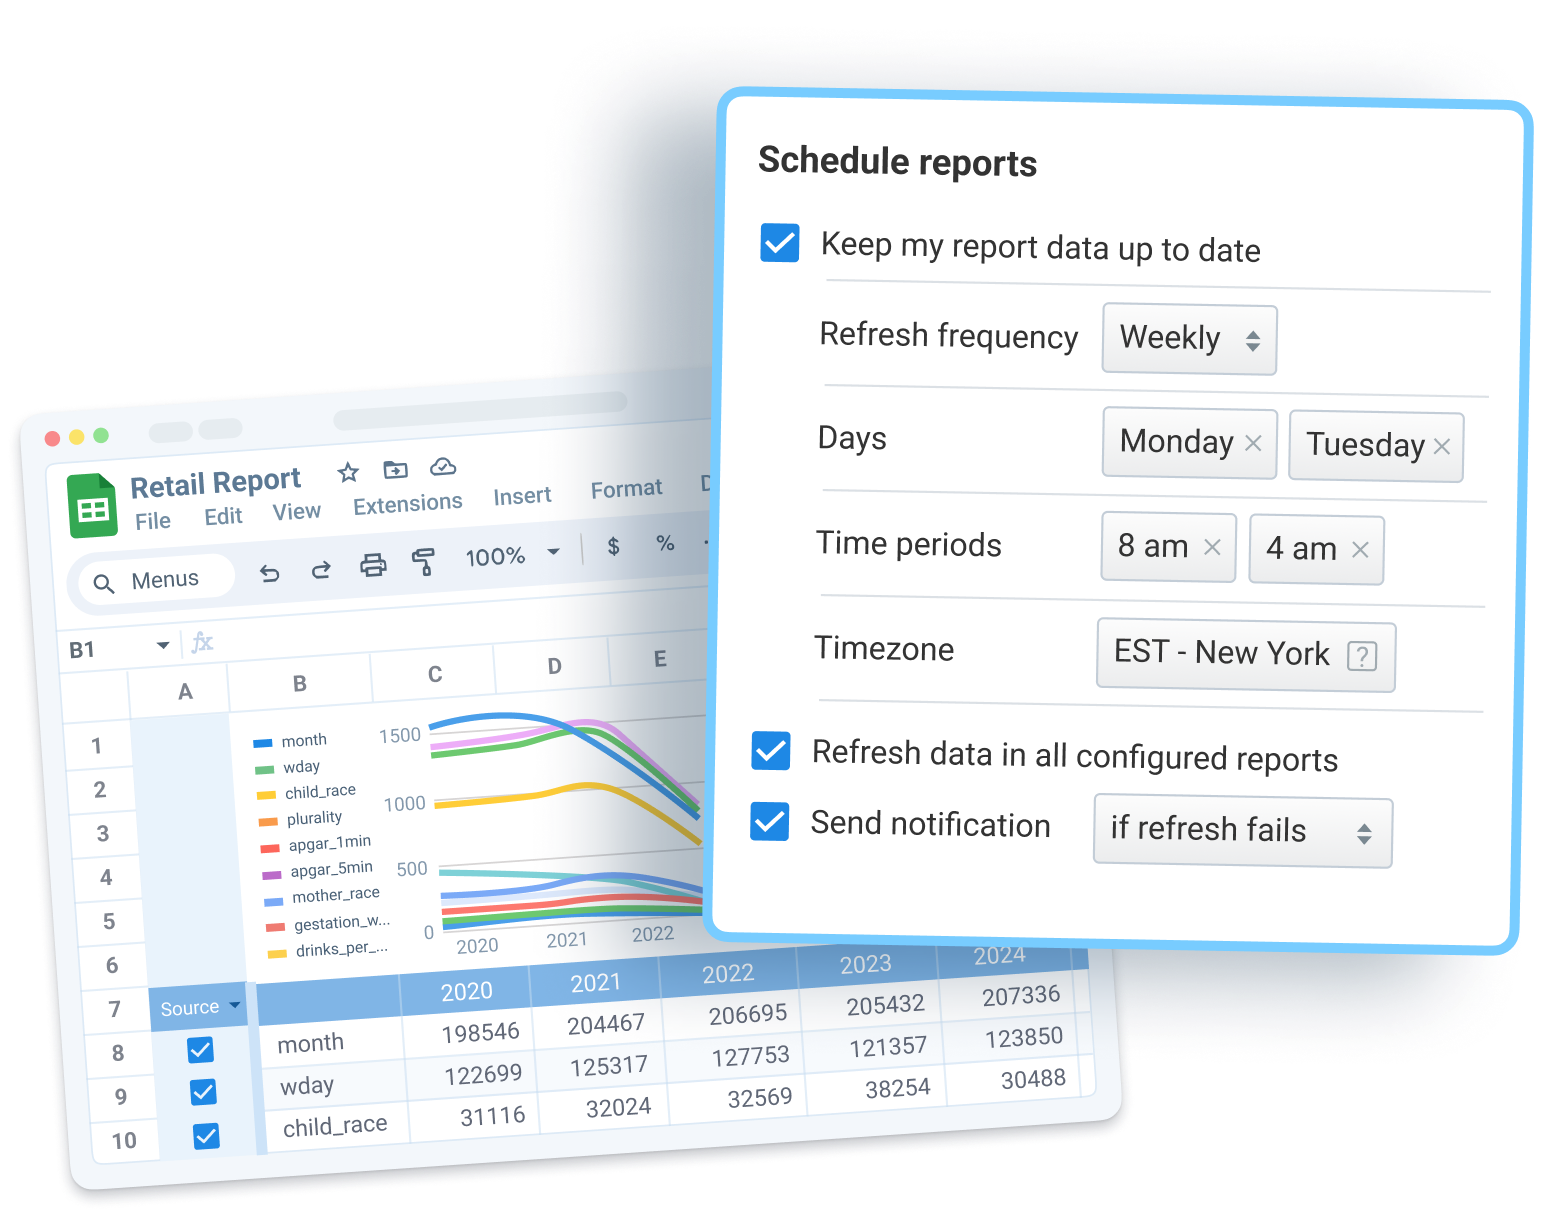
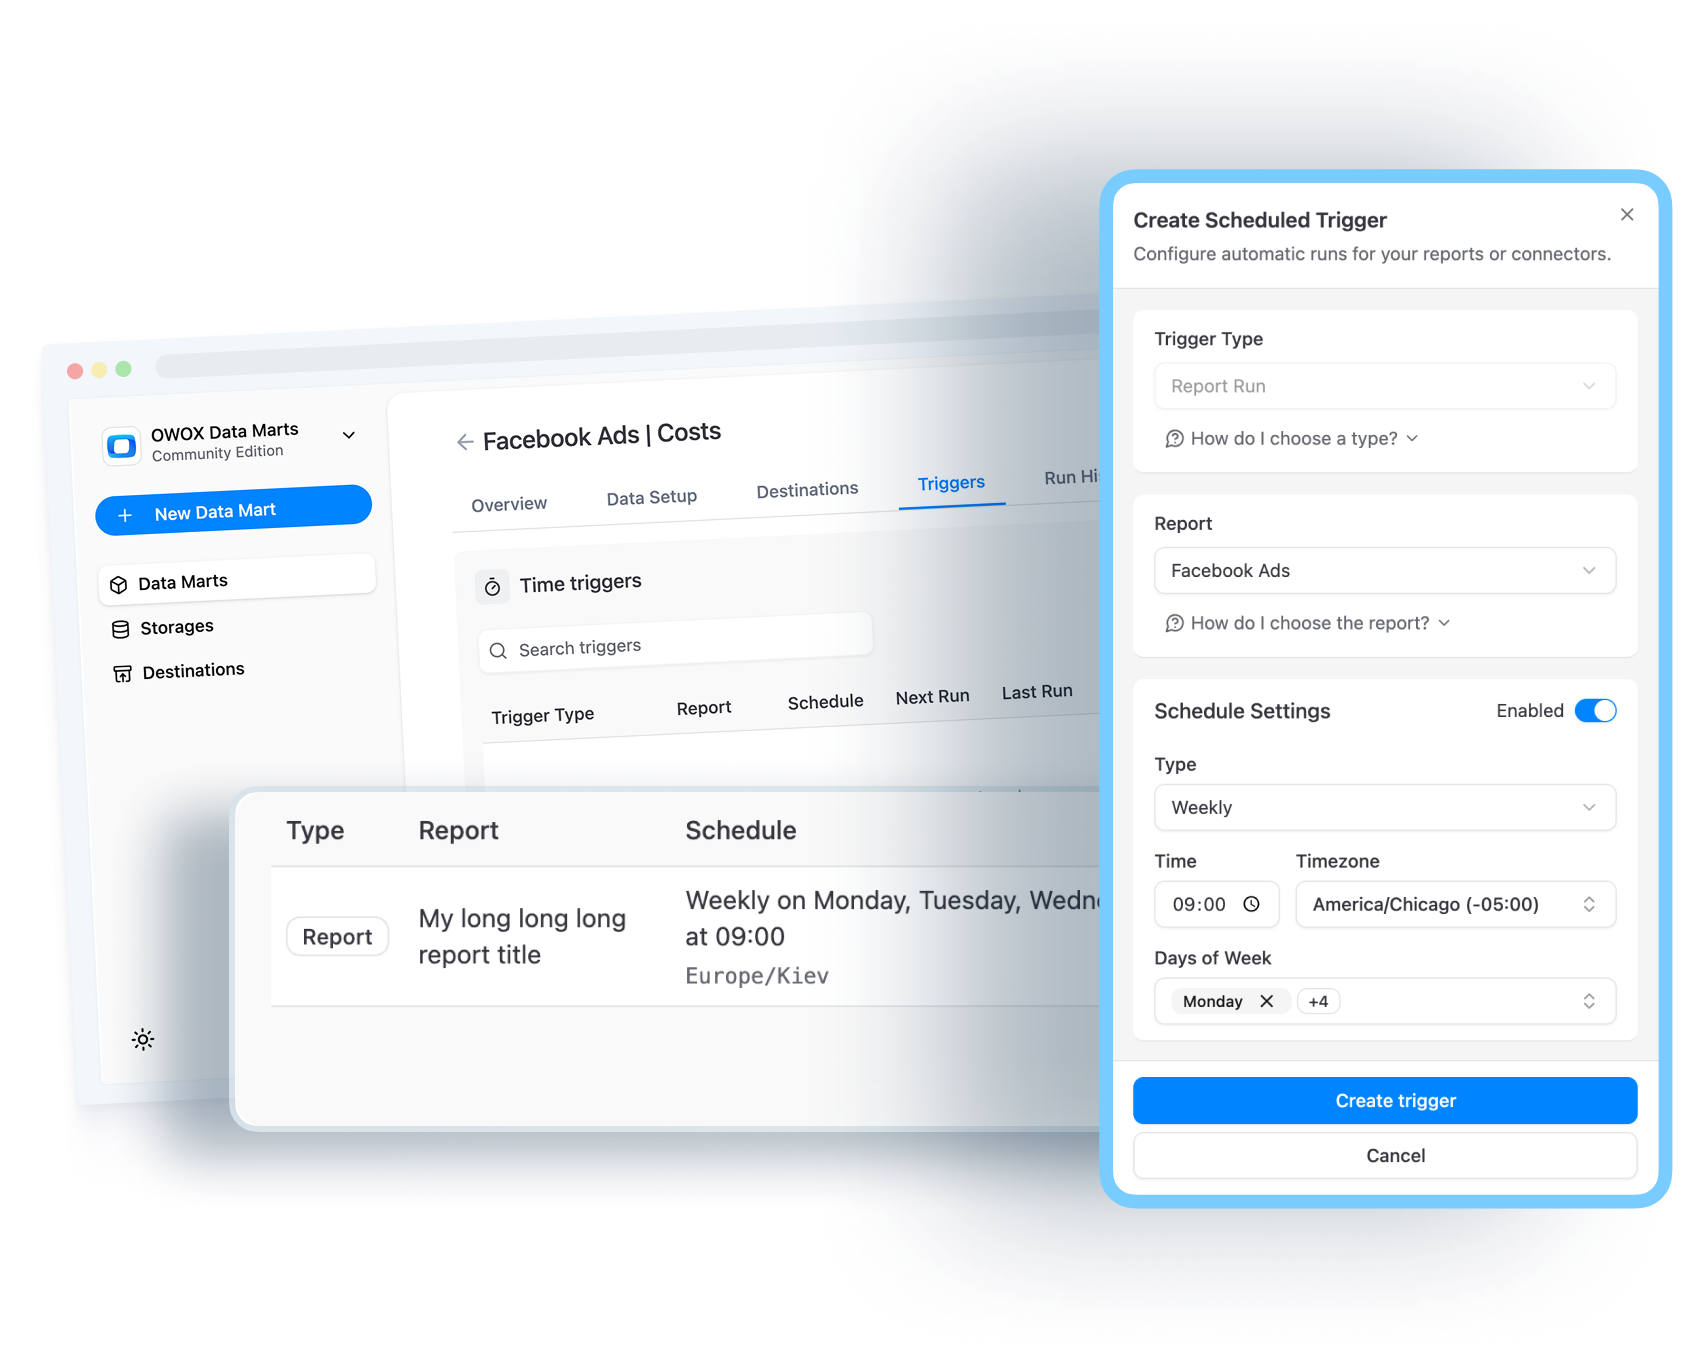
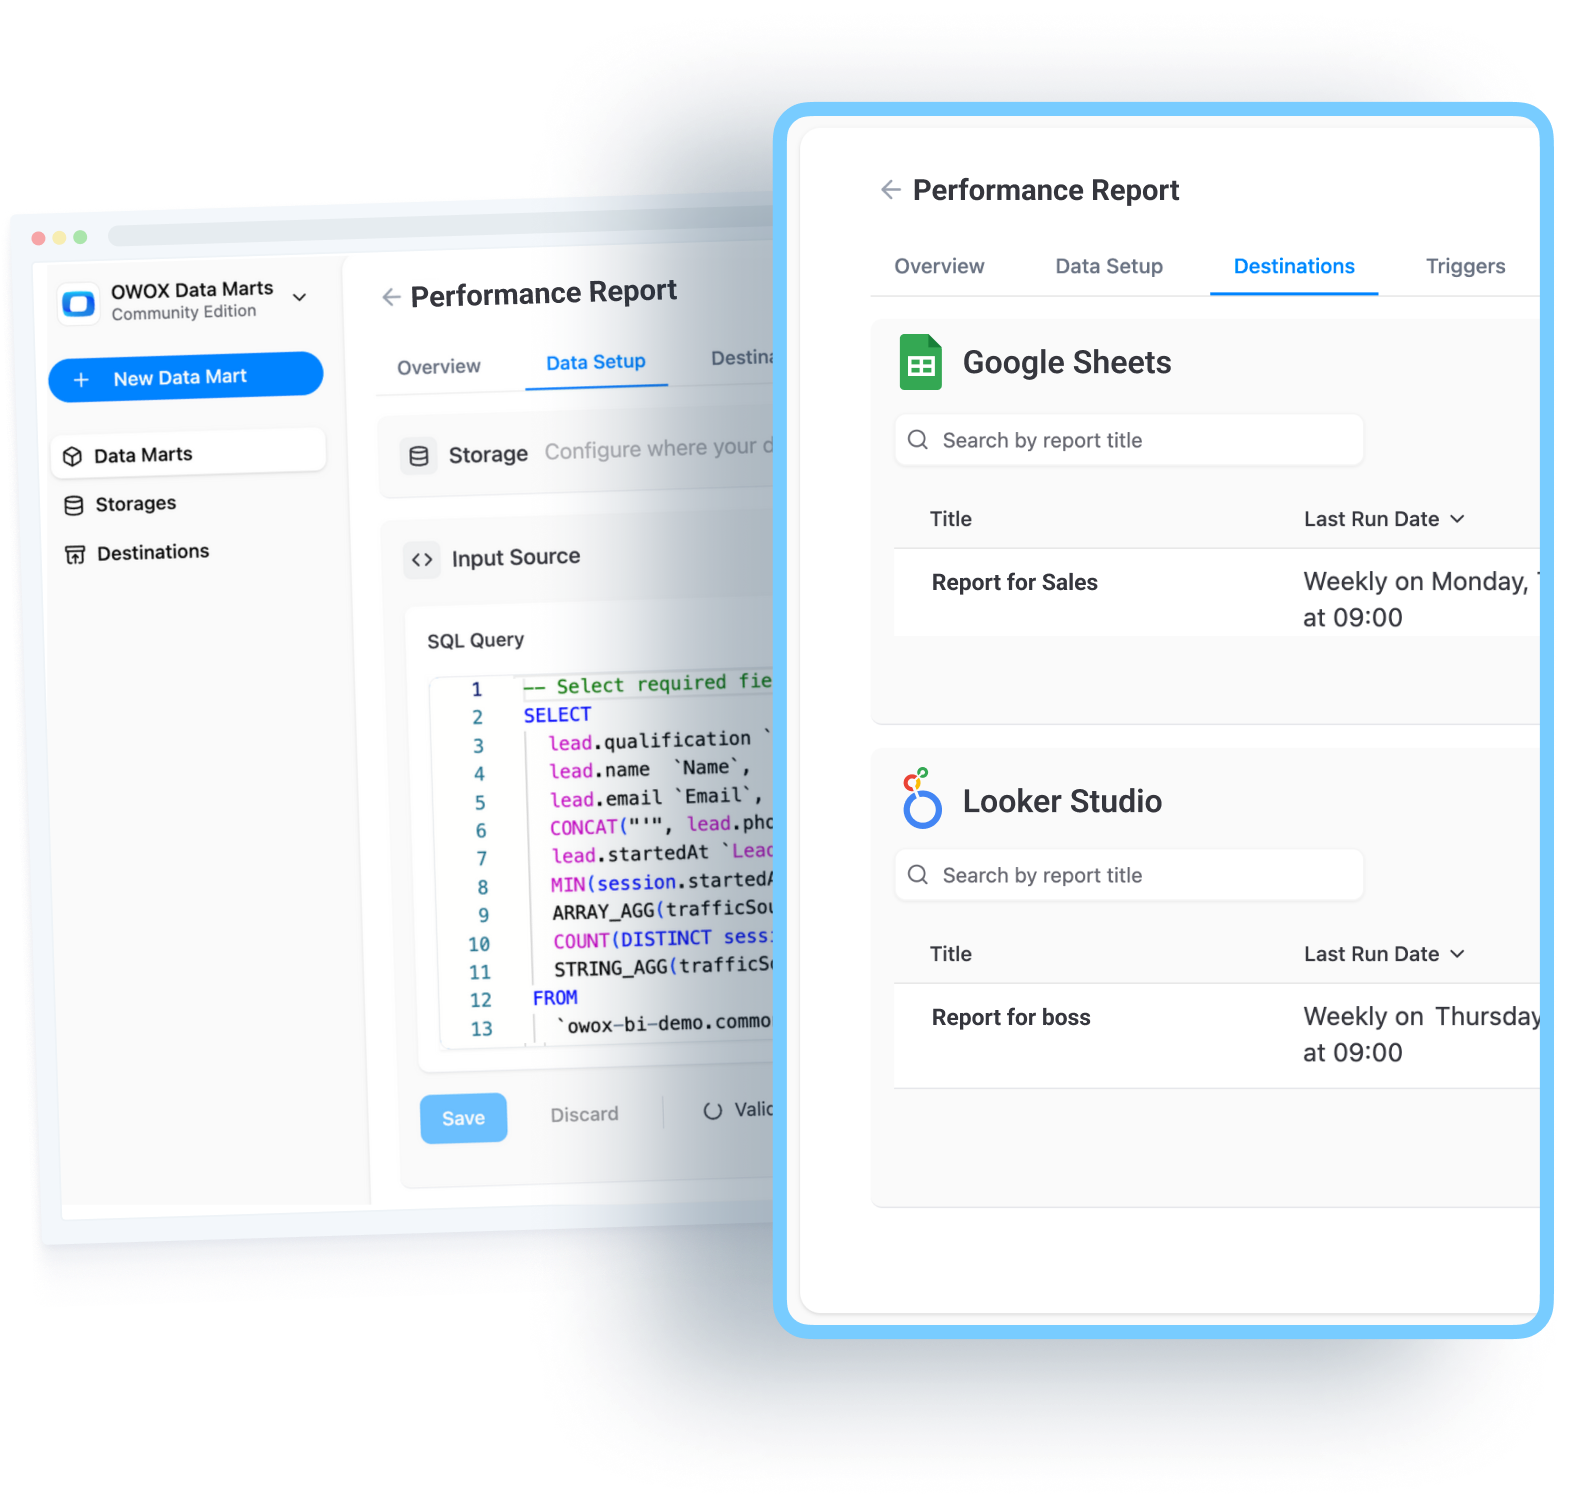
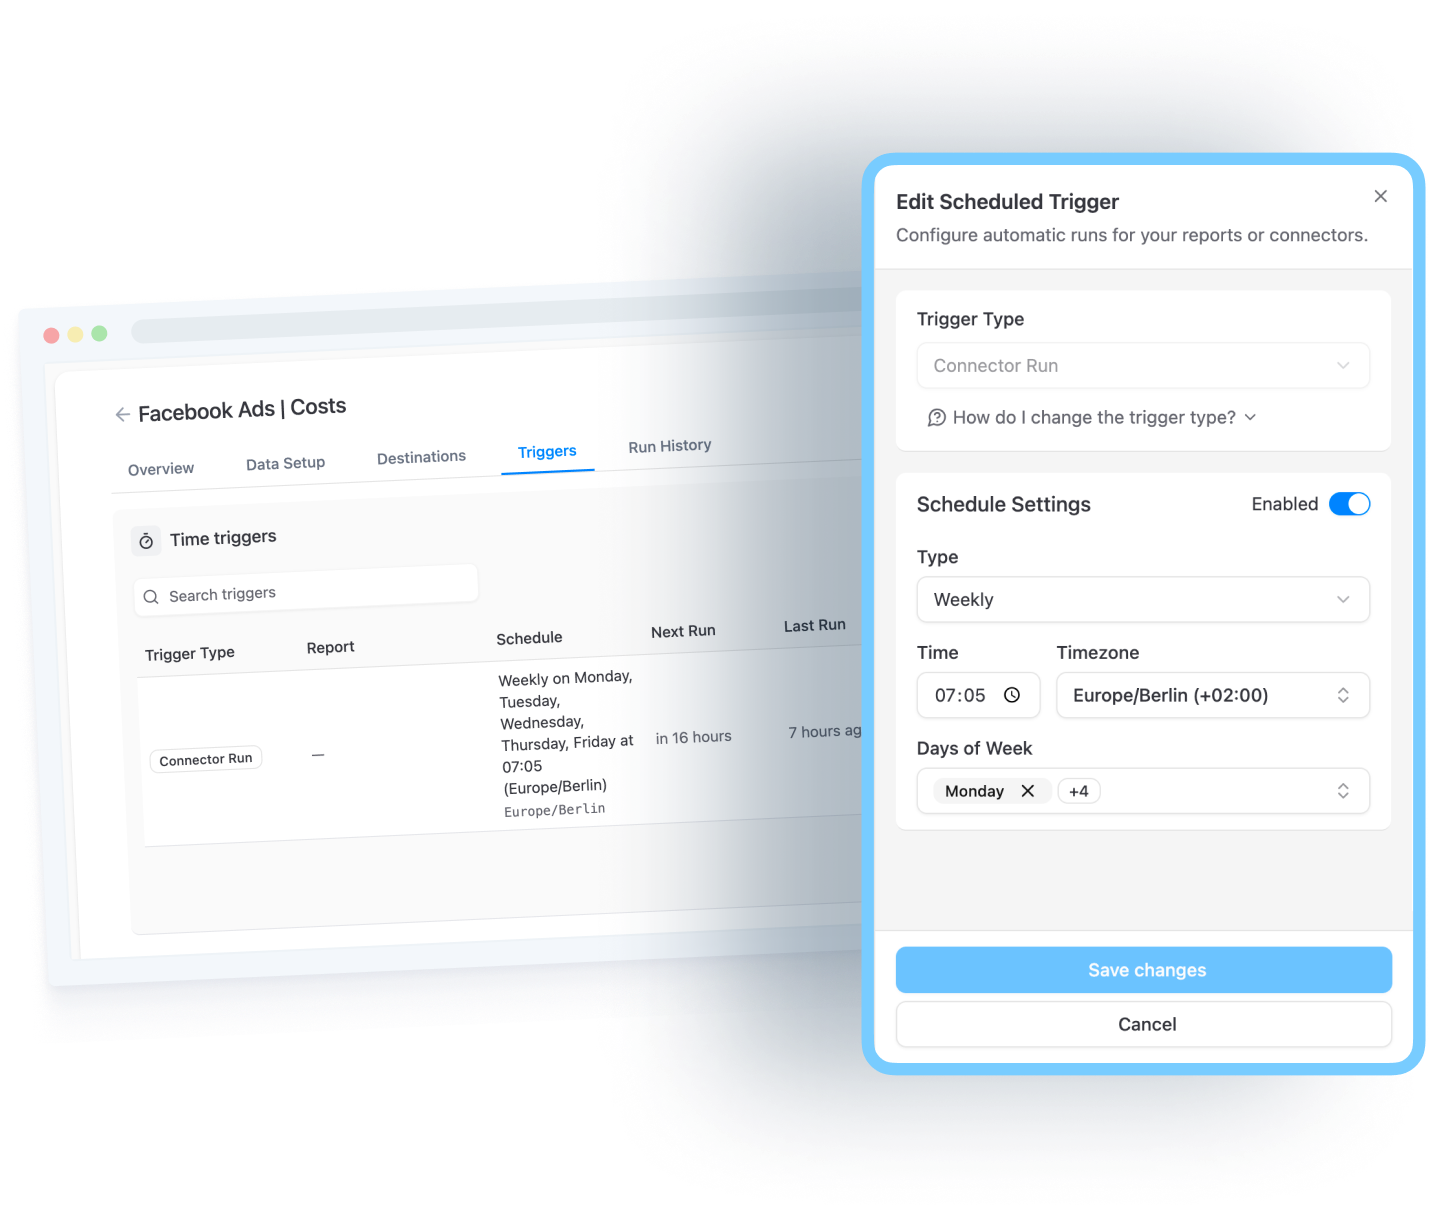
Own the reporting schedule, not the other way around
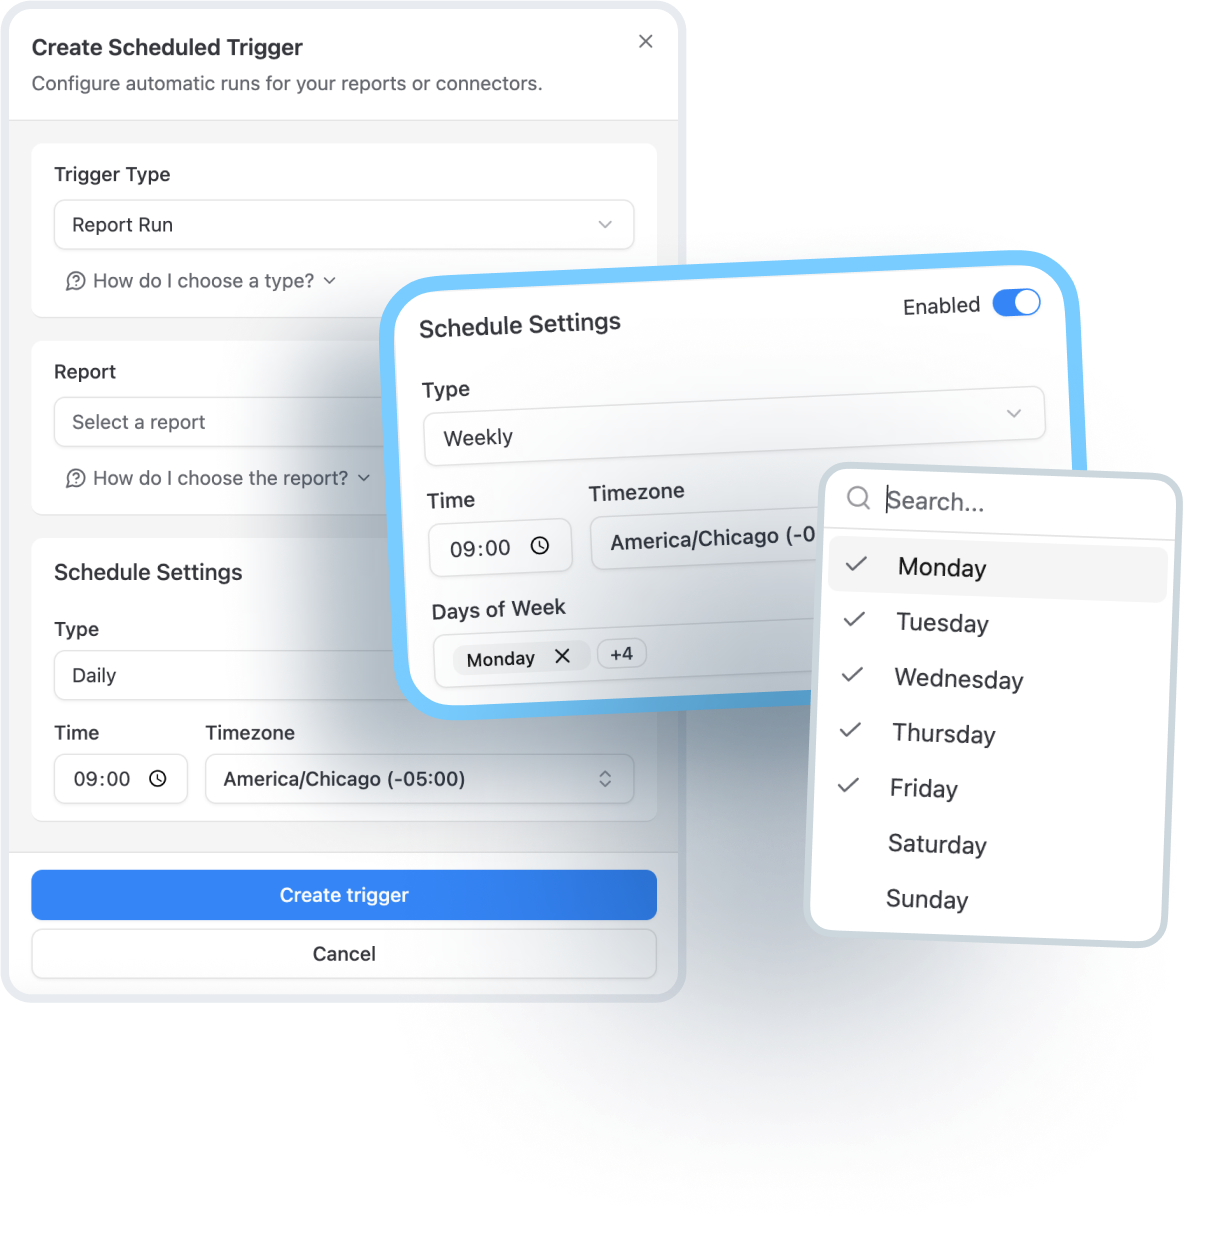
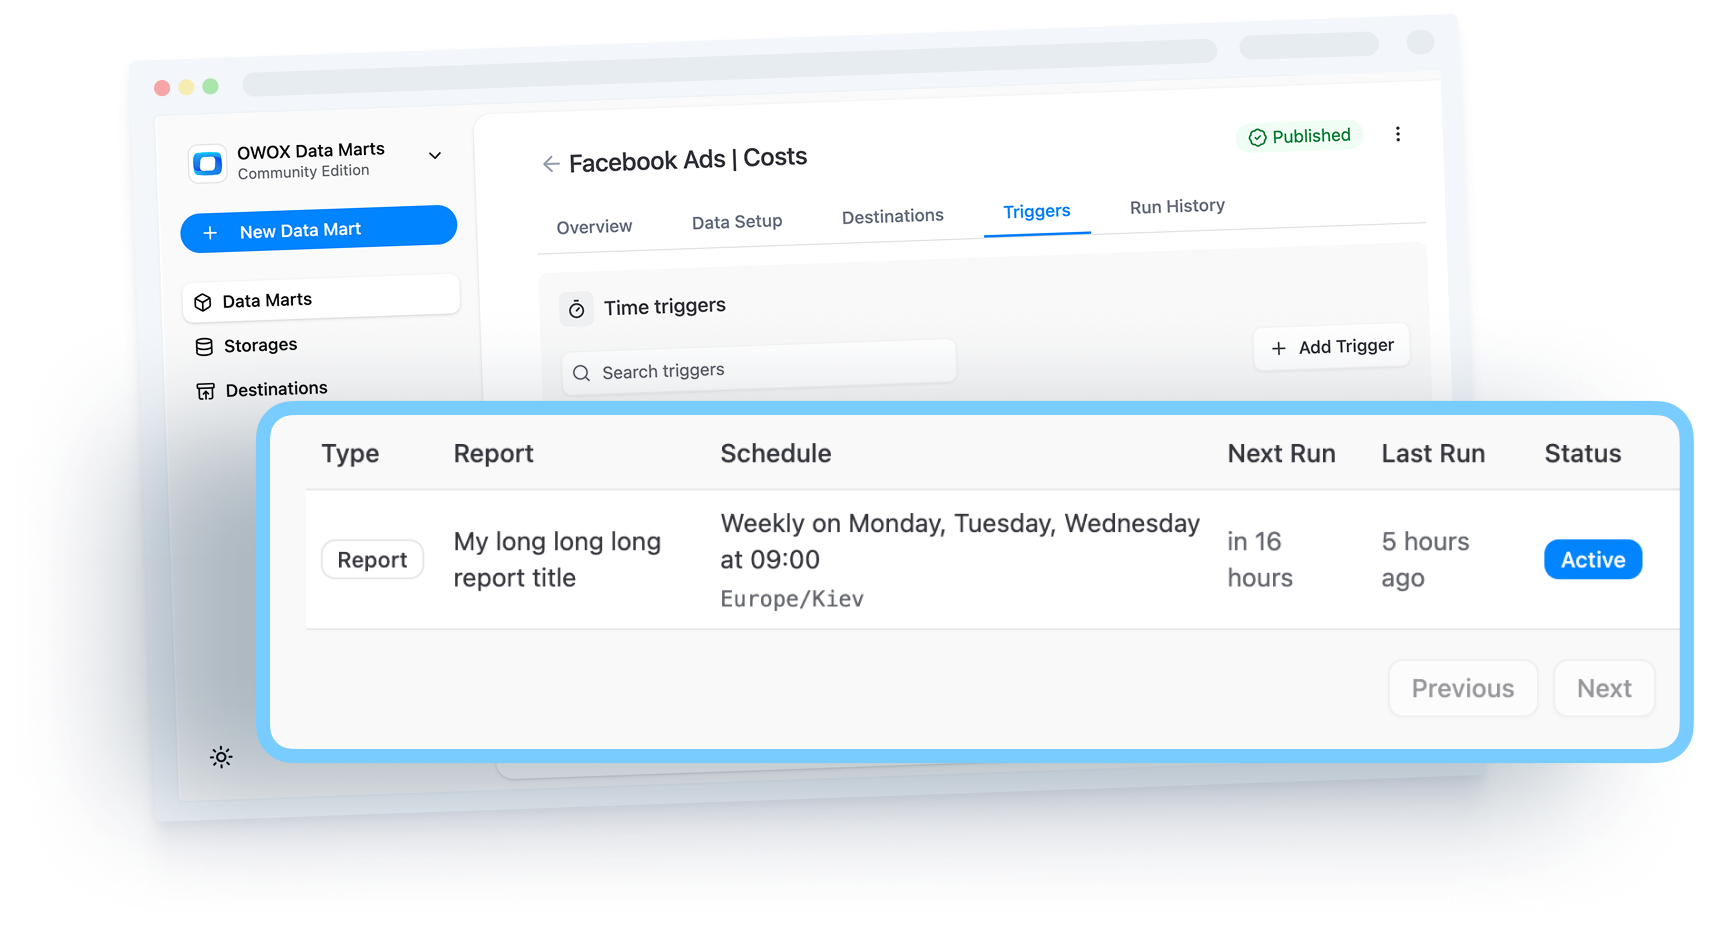
Take full control of every export across your organization from a single control panel:set up, manage, and monitor exports from multiple data marts in one place.
Schedule updates for Sheets, Looker Studio, and Excel (via OData) – no manual refreshes needed.
Ensure business teams always get fresh data, without pinging you for updates.
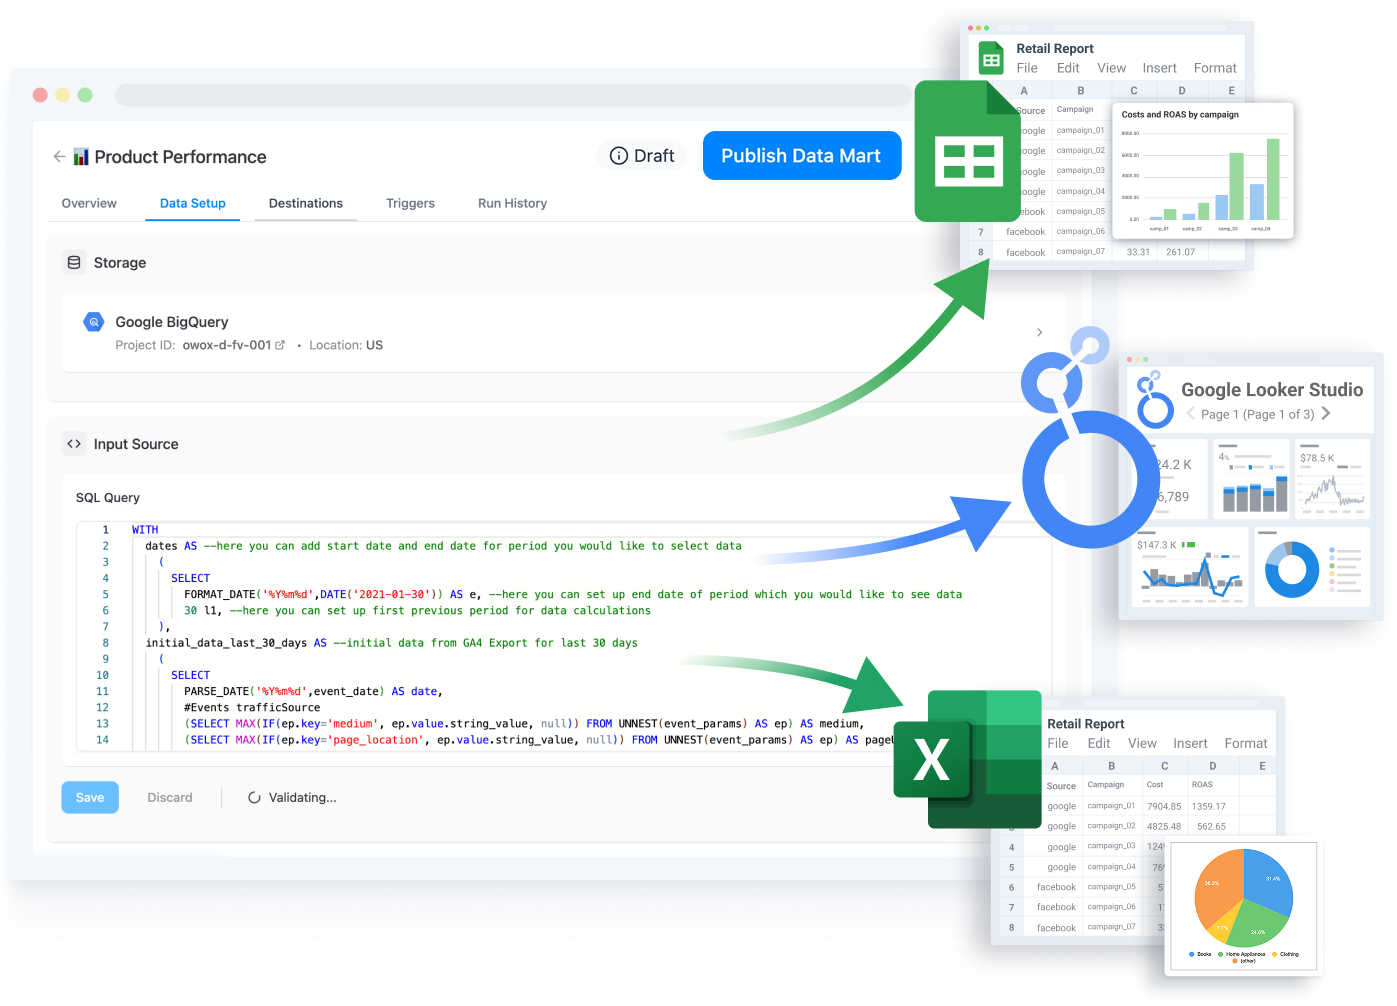
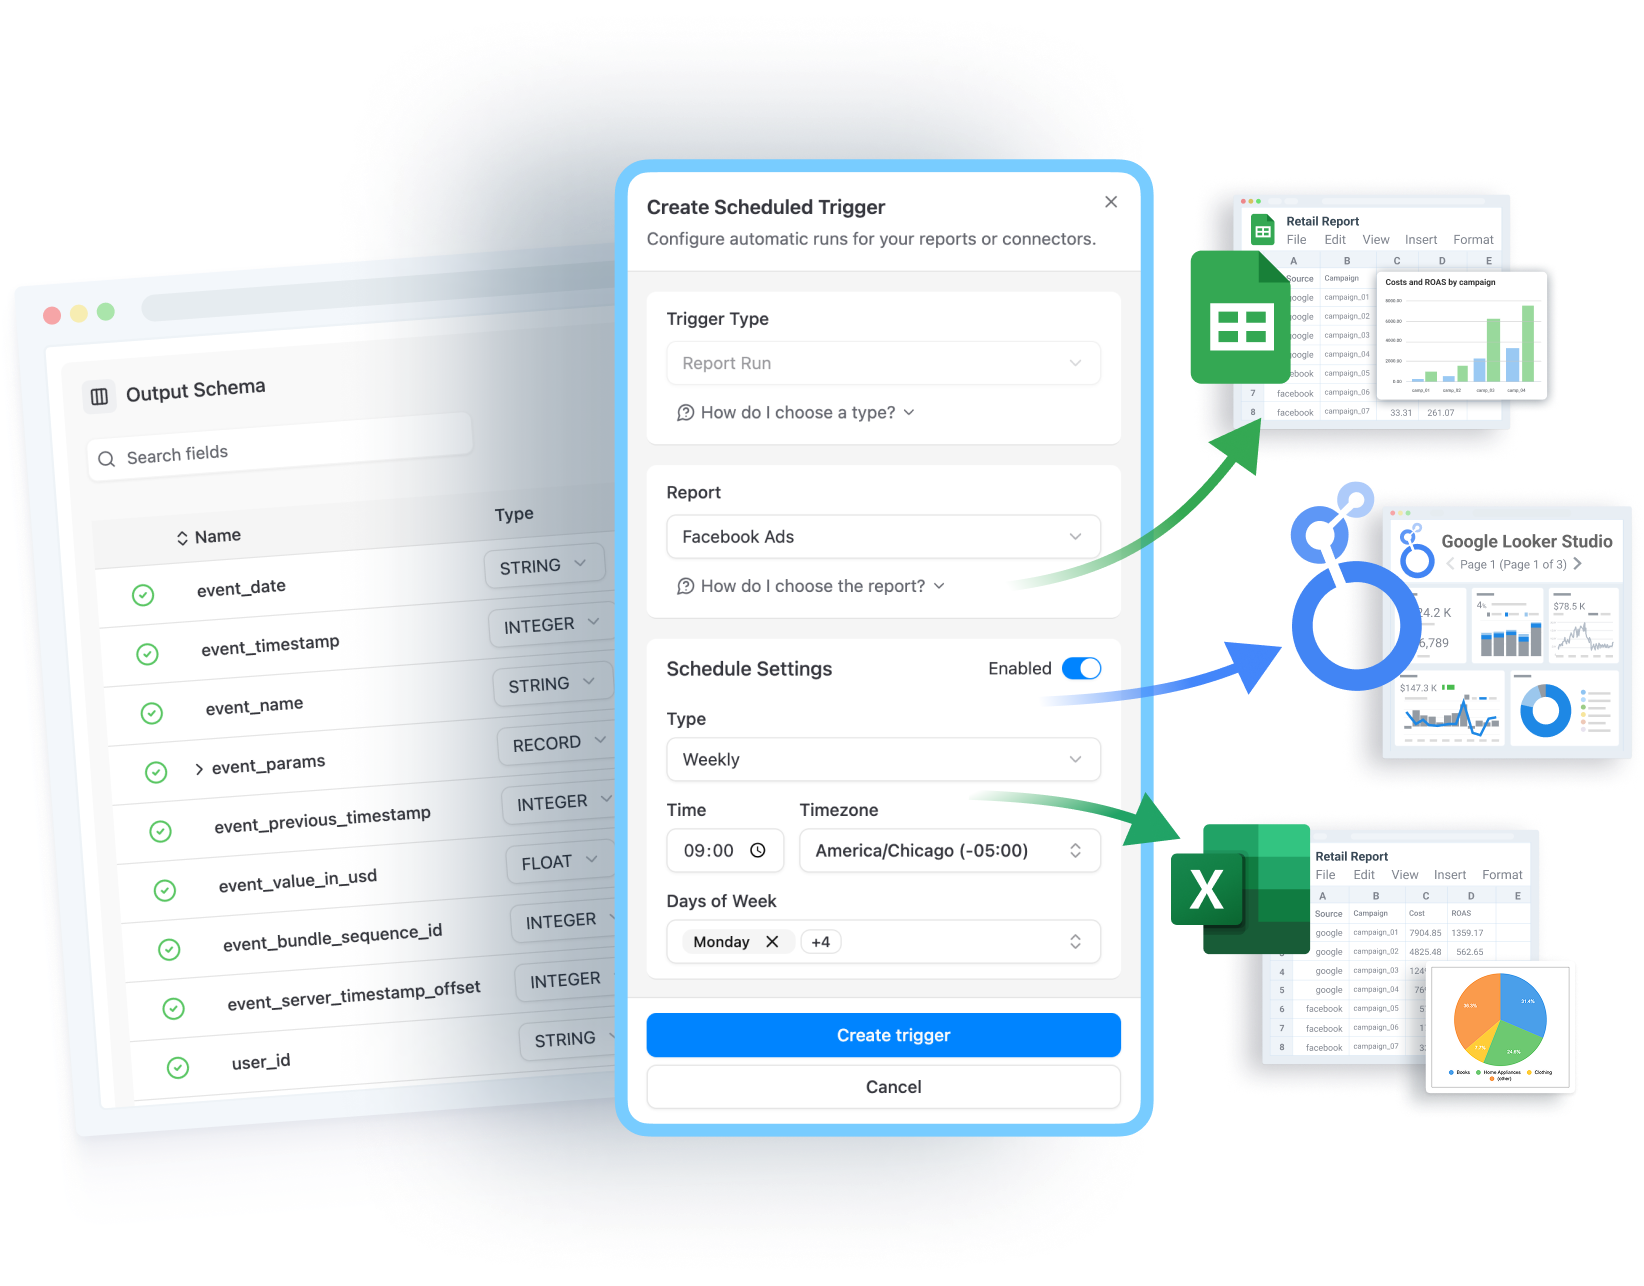
Centralize data delivery across tools
Unify your export logic into a single system that powers Sheets, Looker Studio, and Excel: manage all data delivery & reporting pipelines in one place.
Set different schedules, ranges, and formats for each report, stakeholder or destination.
Maintain consistency across tools – no more conflicting numbers in dashboards vs spreadsheets
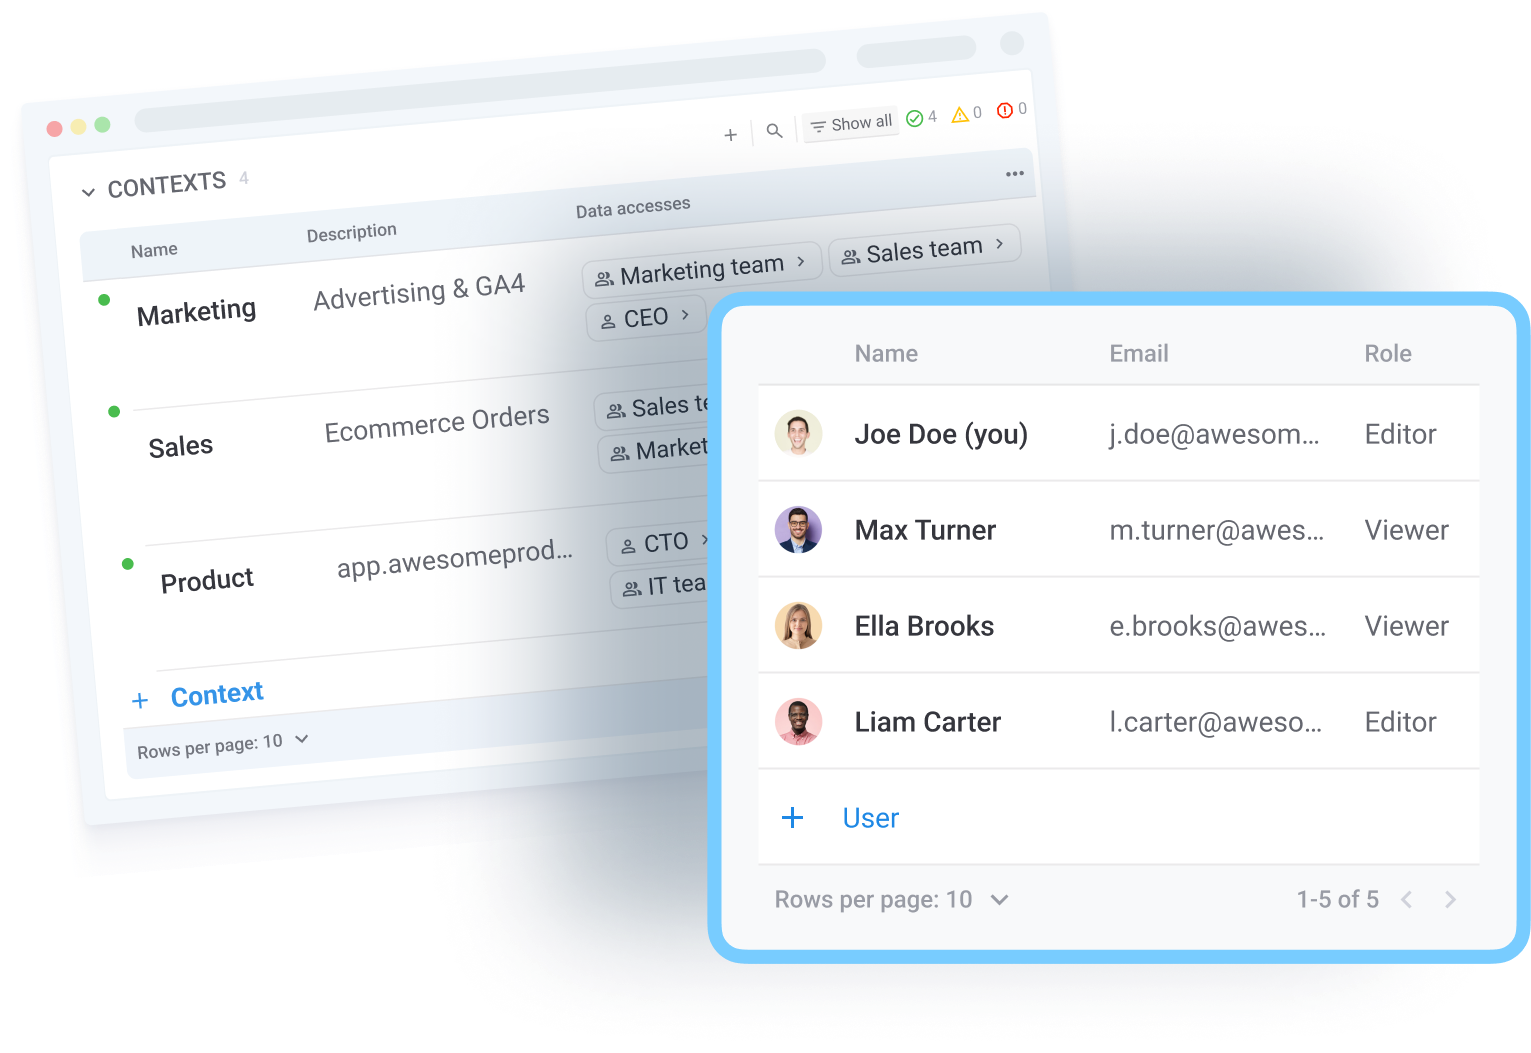
Control who sees what, even in dashboards
Not with OWOX Data Marts.
You can power multiple Looker Studio dashboards with the same data mart that allows you to filter configurations:
(1) Analysts set visibility rules at the data mart layer;
(2) Business users explore only what’s relevant to them;
(3) Everyone can no safely duplicate the dashboard and set their own filters without you being responsible for the result.
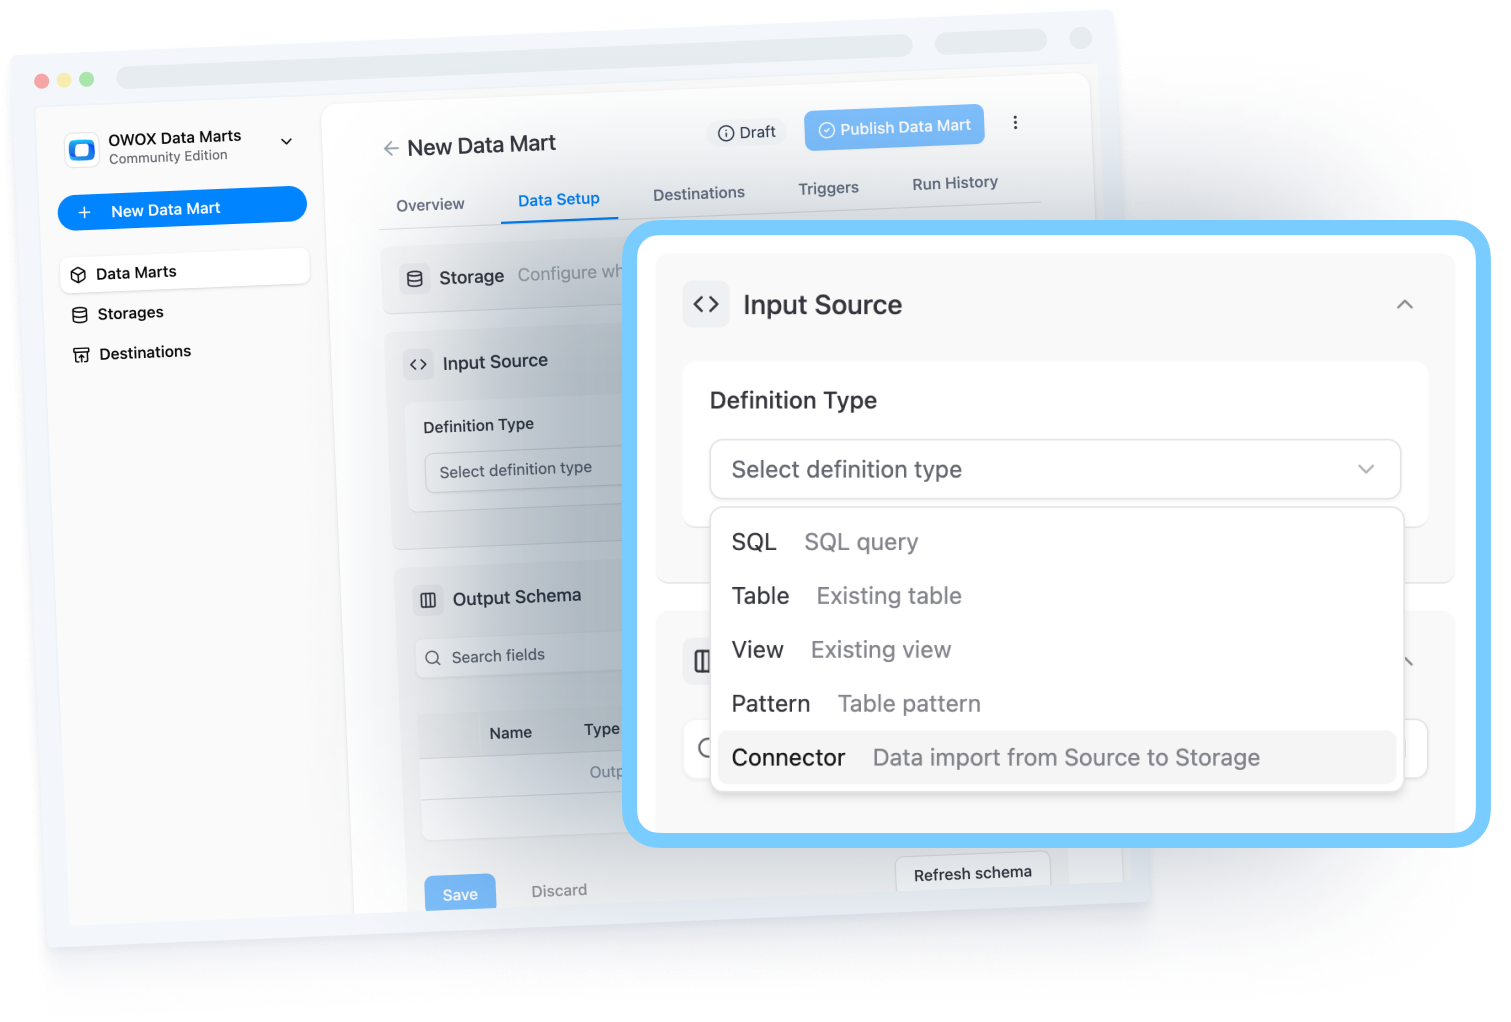
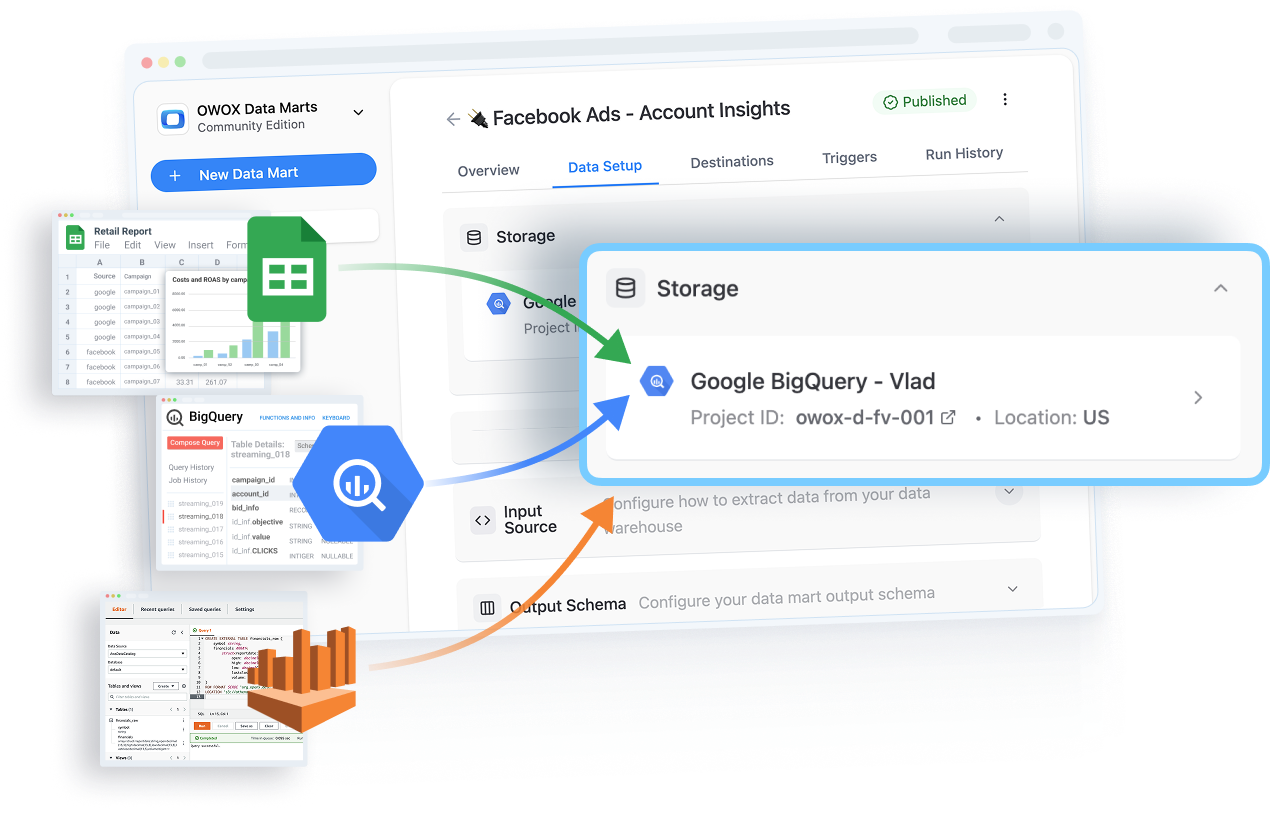
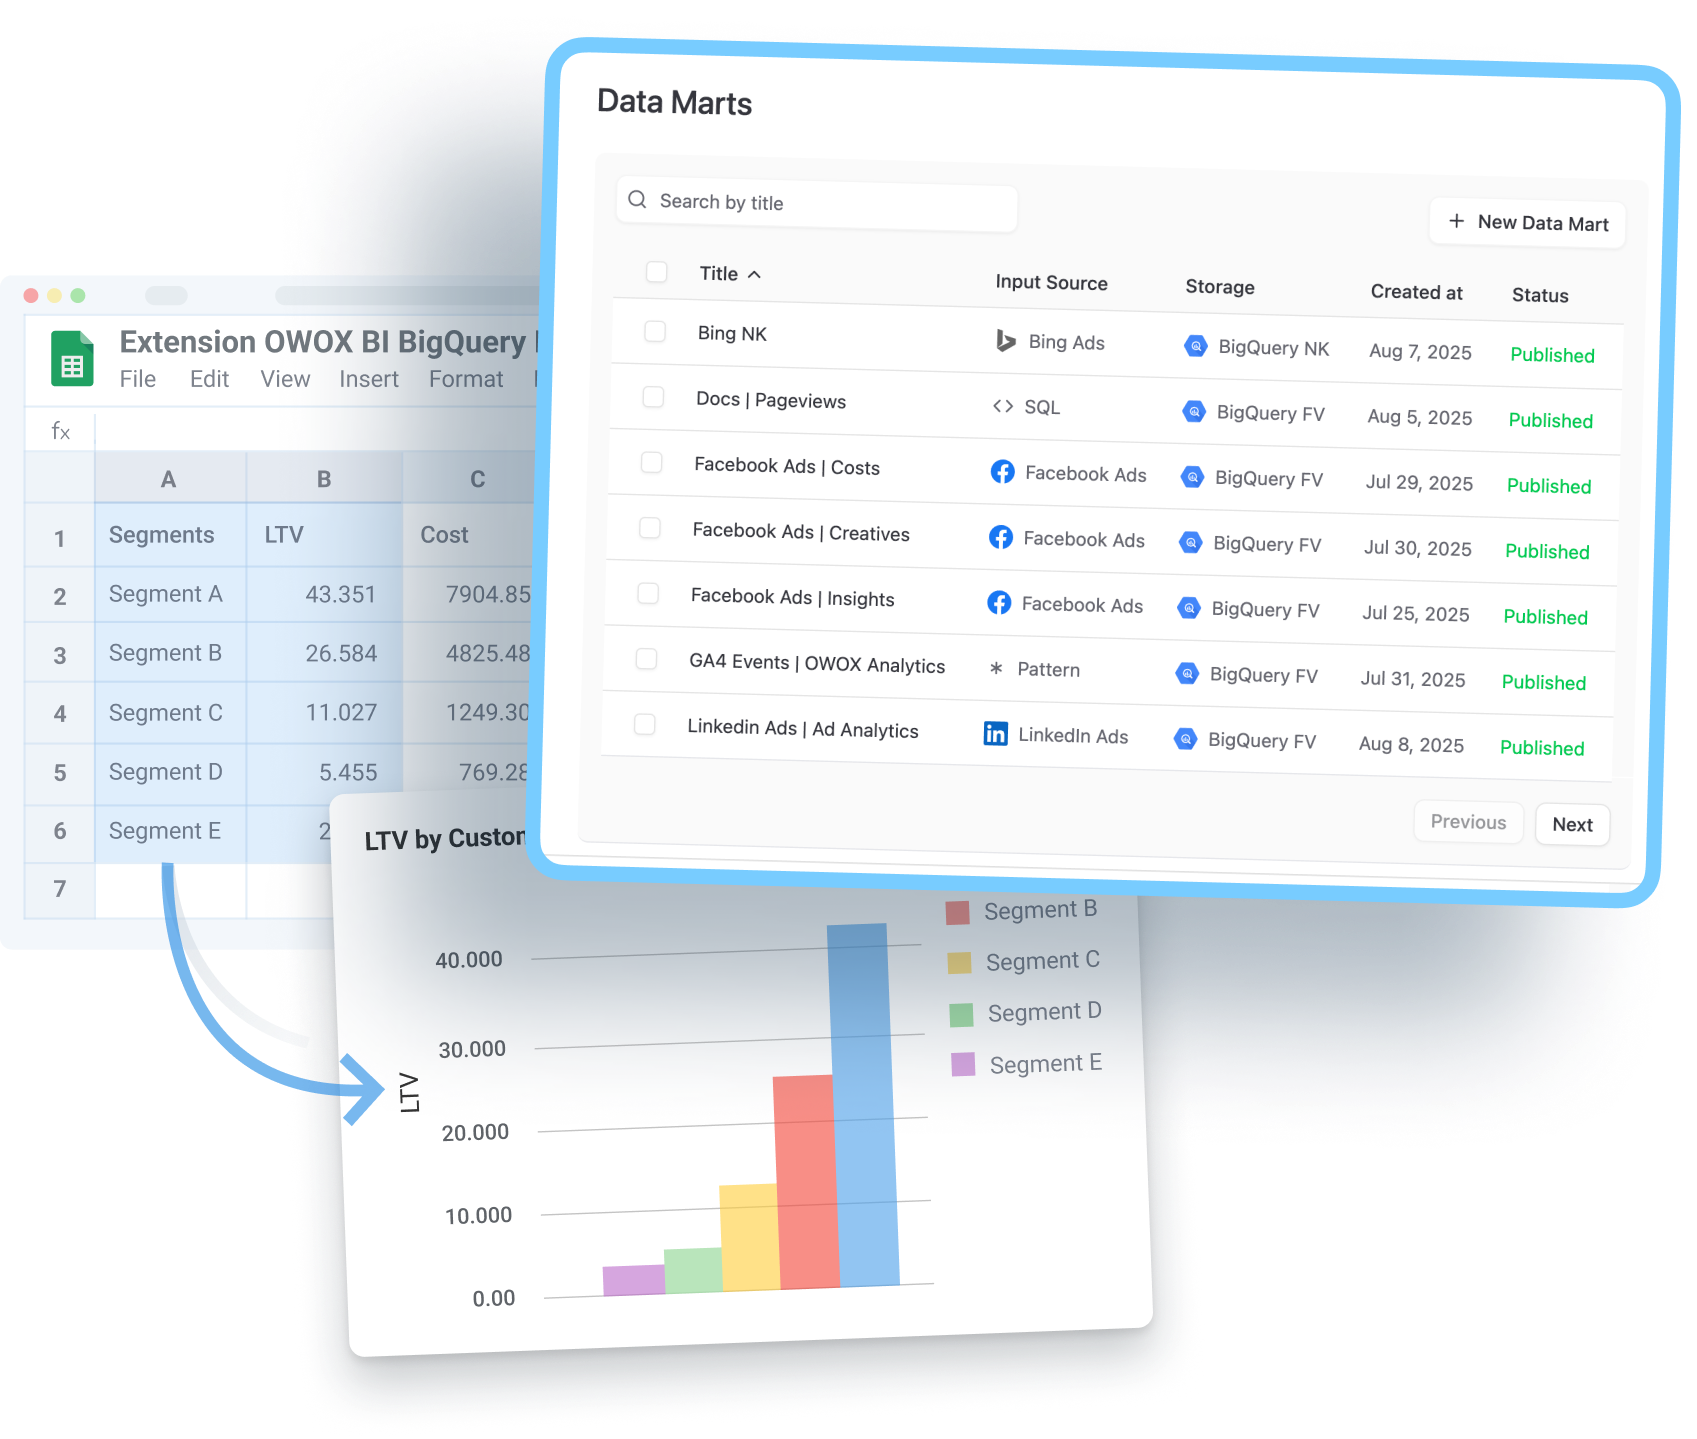
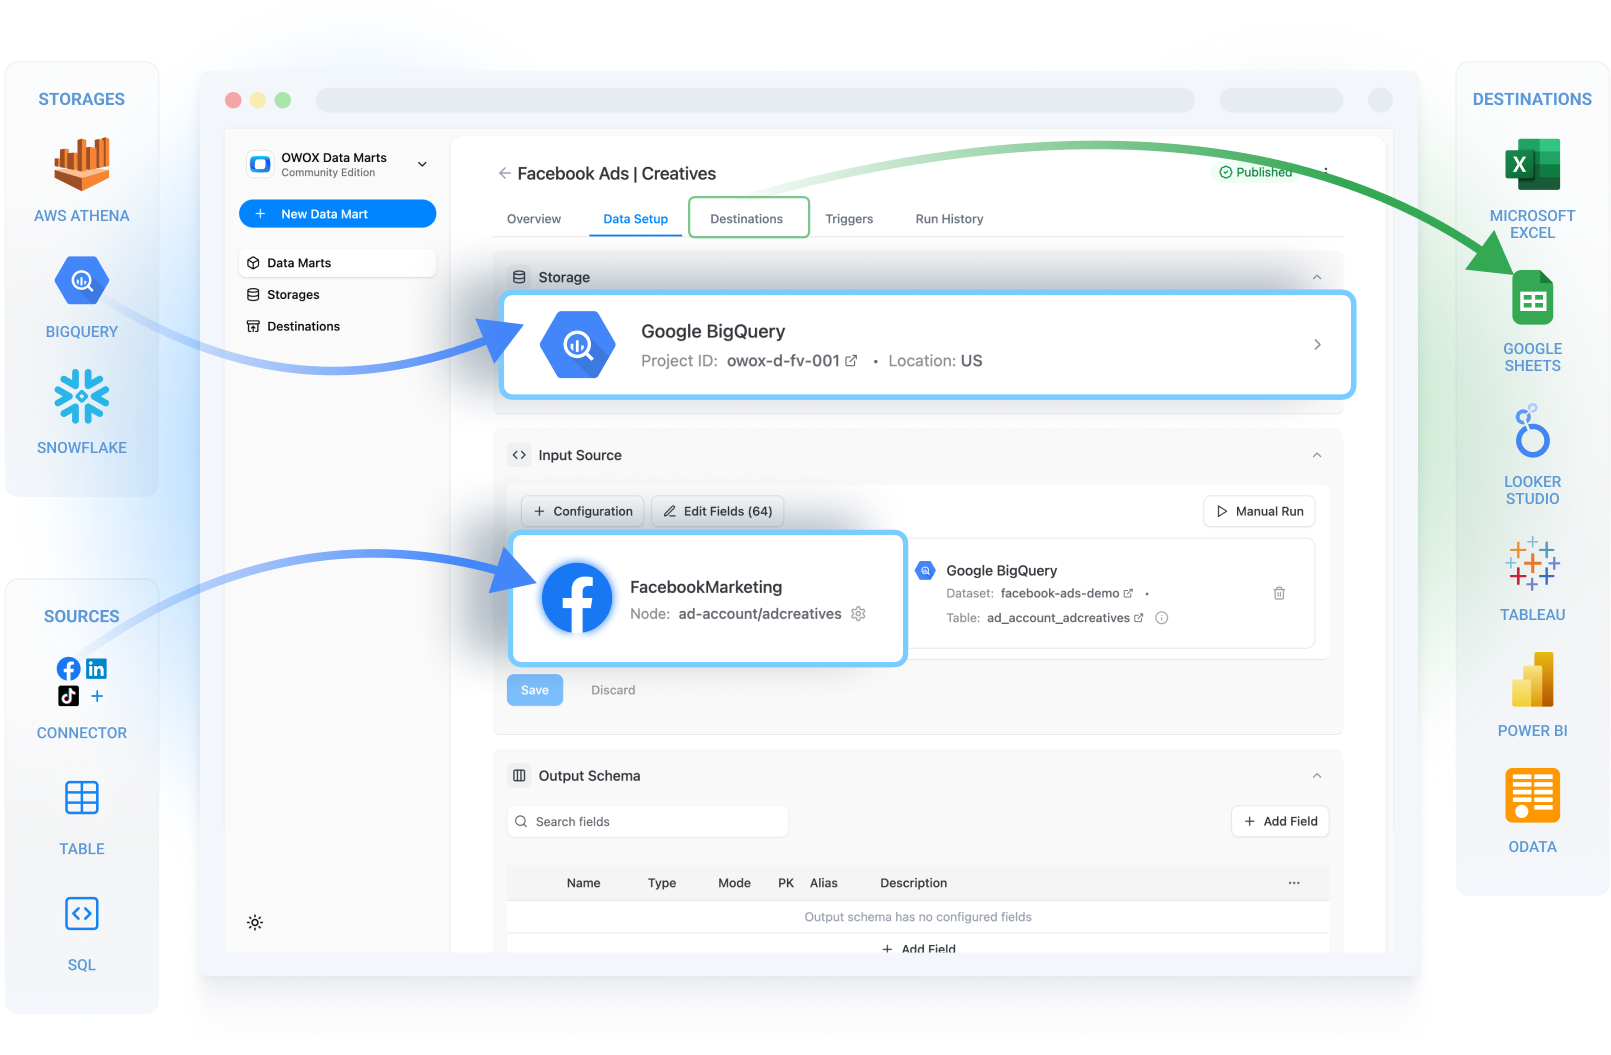
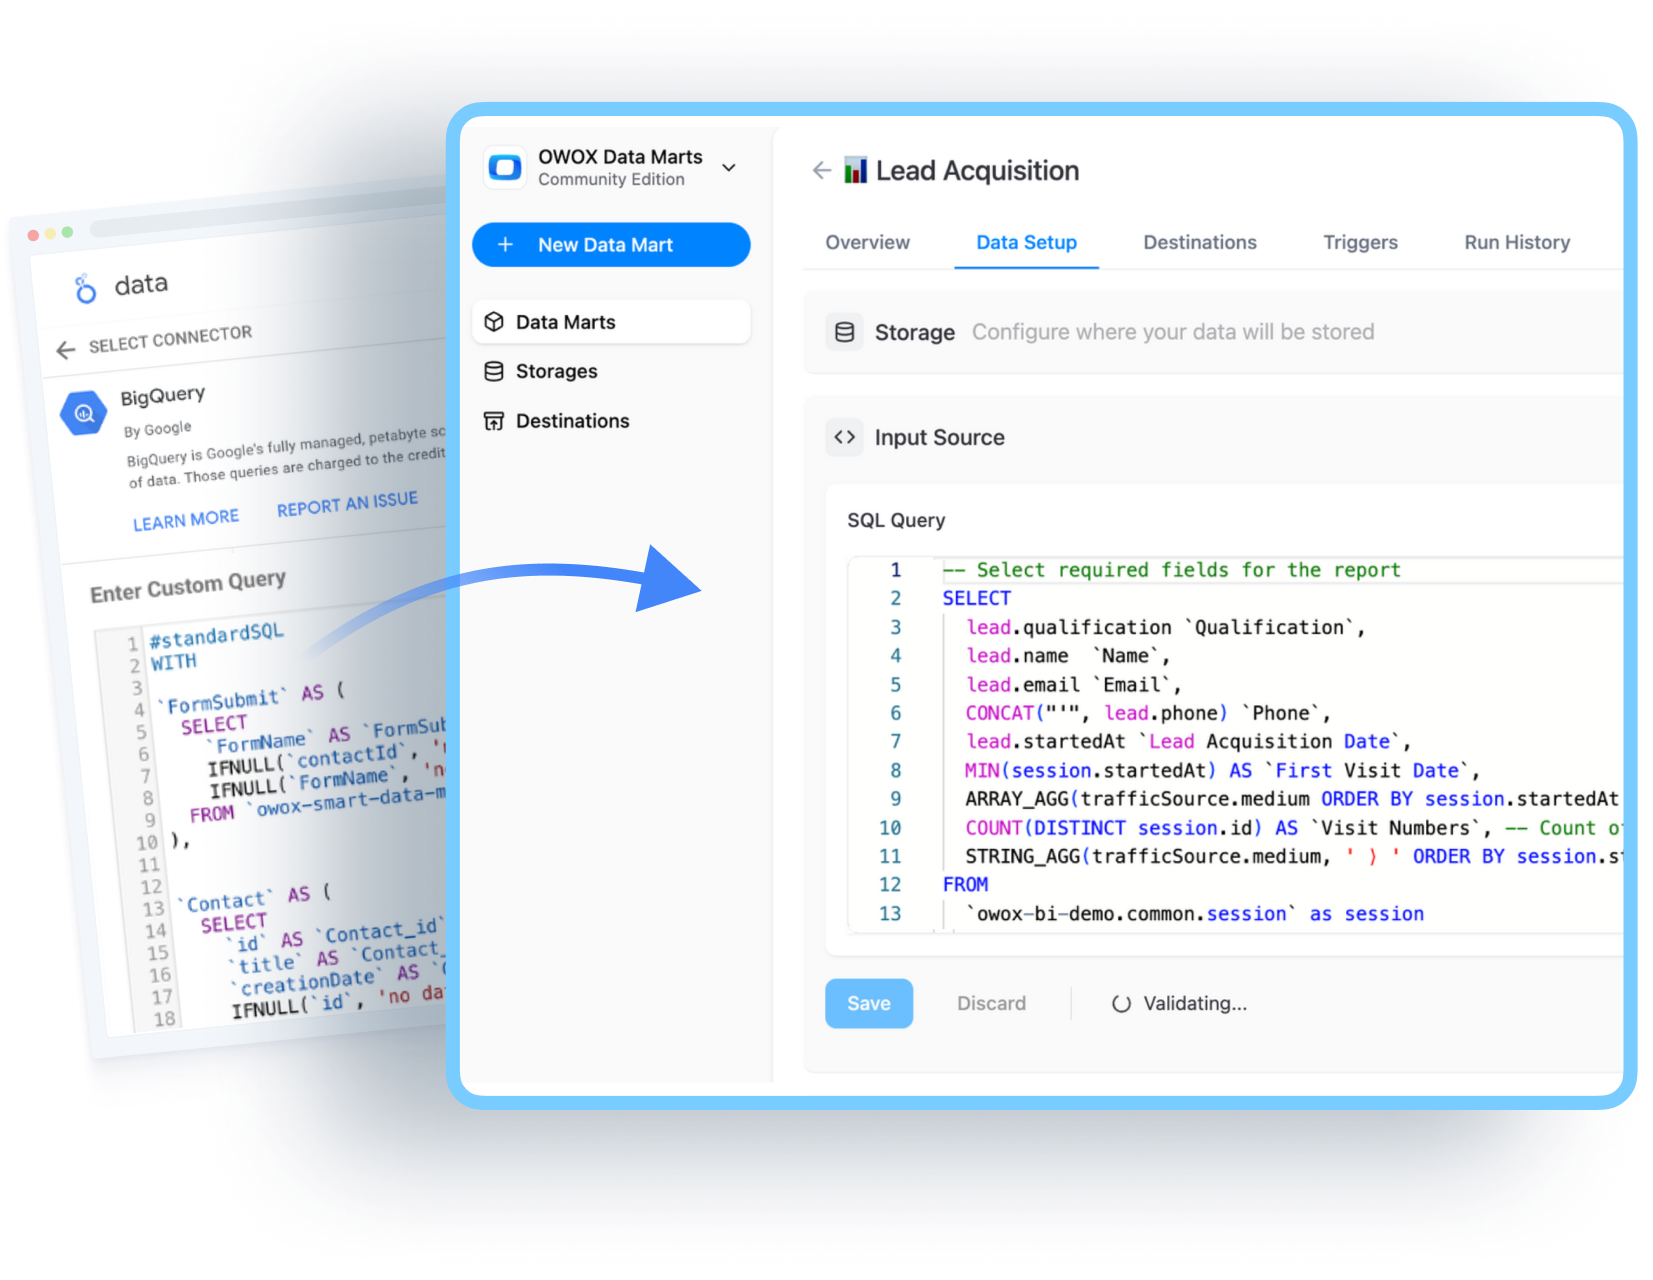
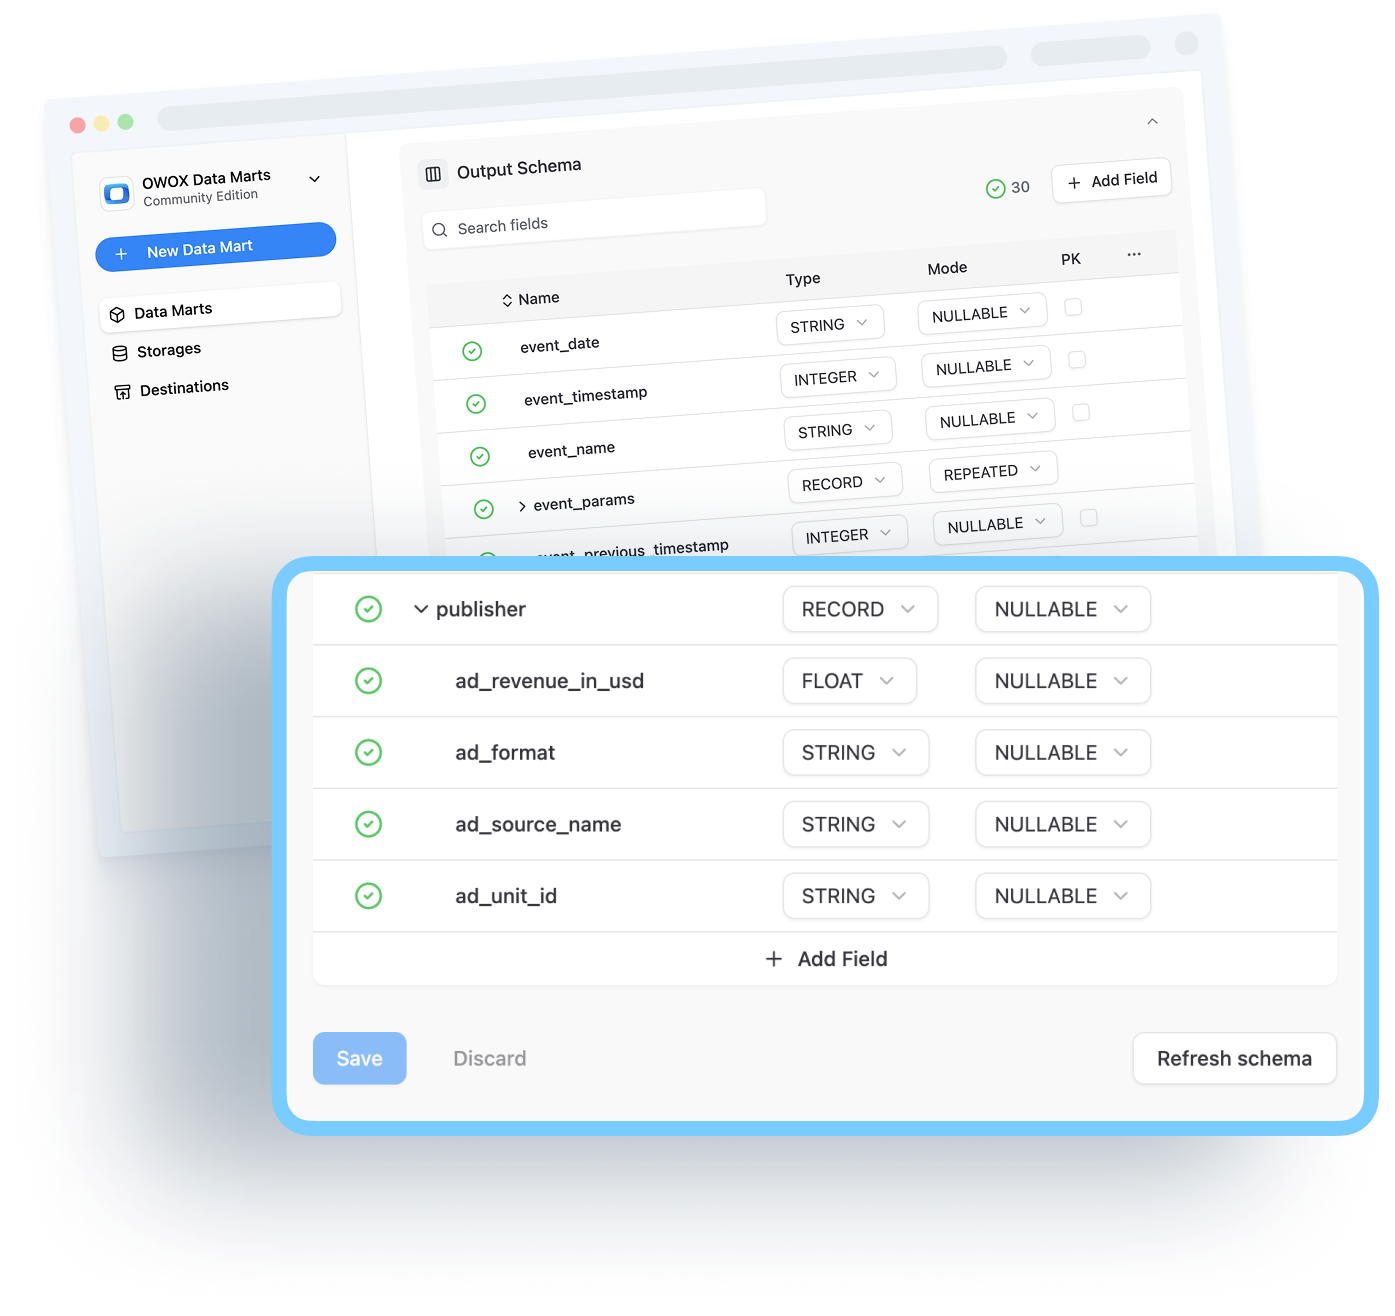
Build data marts that scale with you
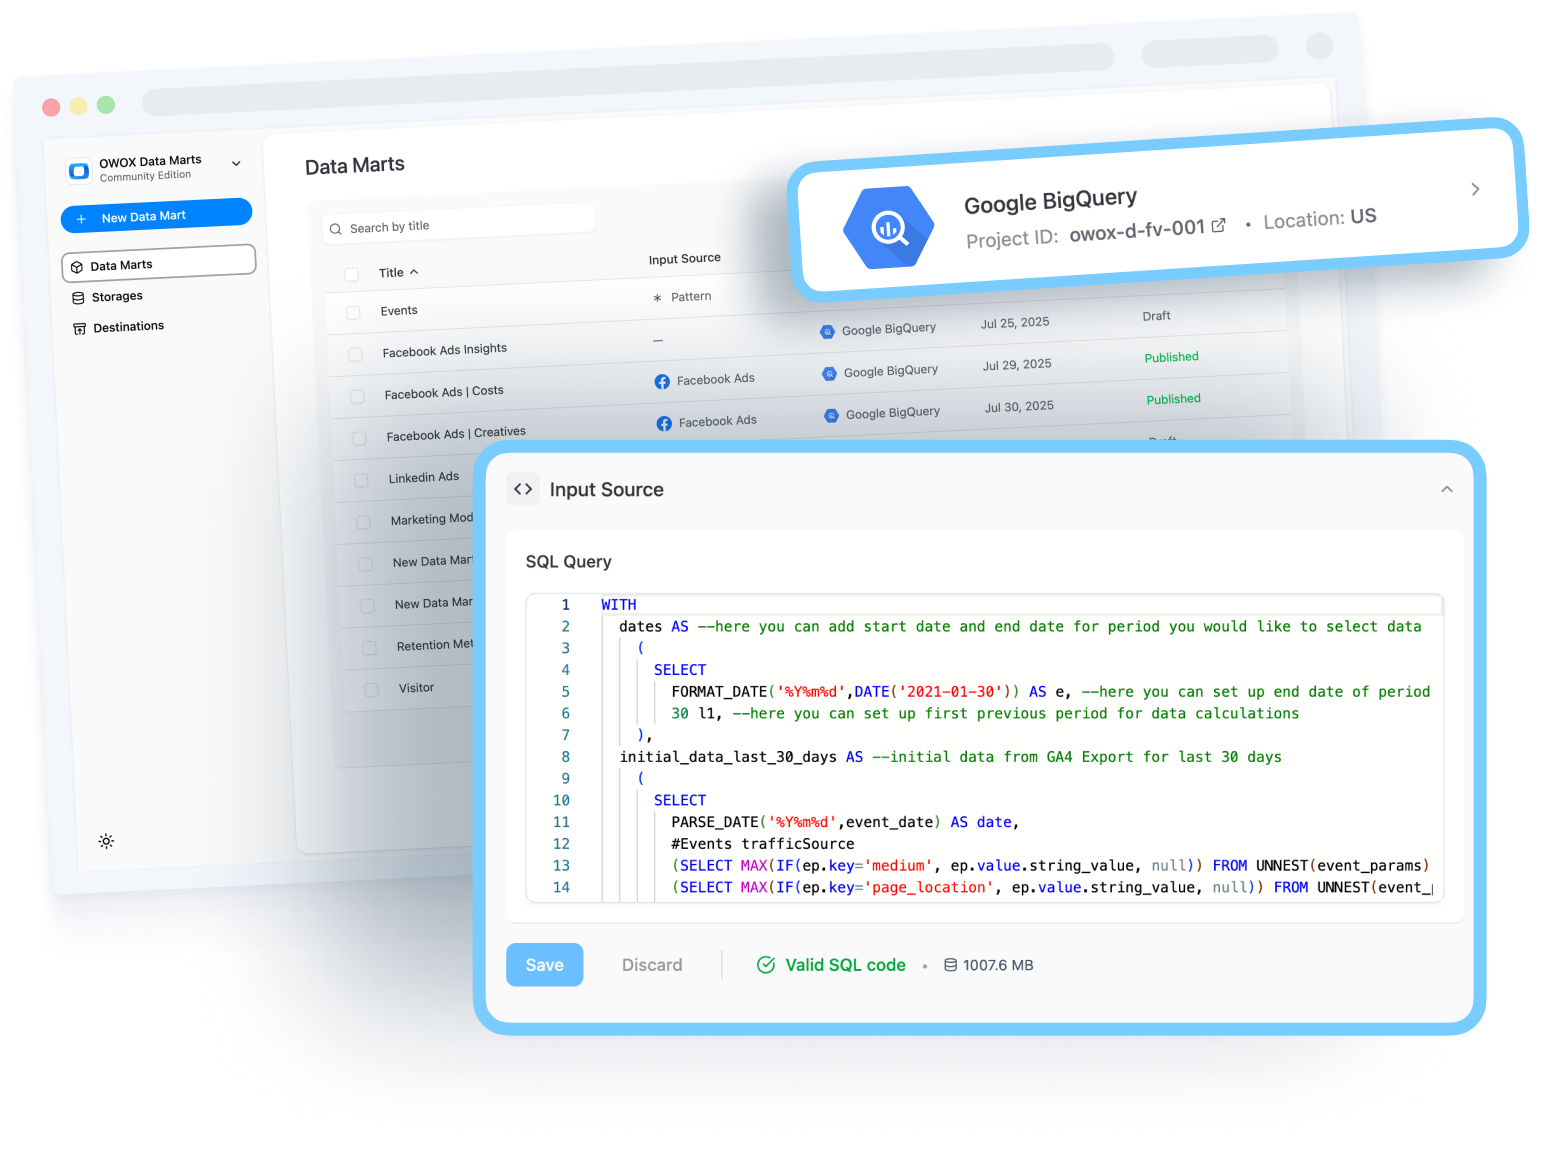
Deliver trusted, reusable data marts to business users while keeping full control. With OWOX you can build data marts using:
(1) SQL queries;
(2) Source tables, views or patterns;
(3) Connectors to 3-rd party APIs (like Facebook Ads)
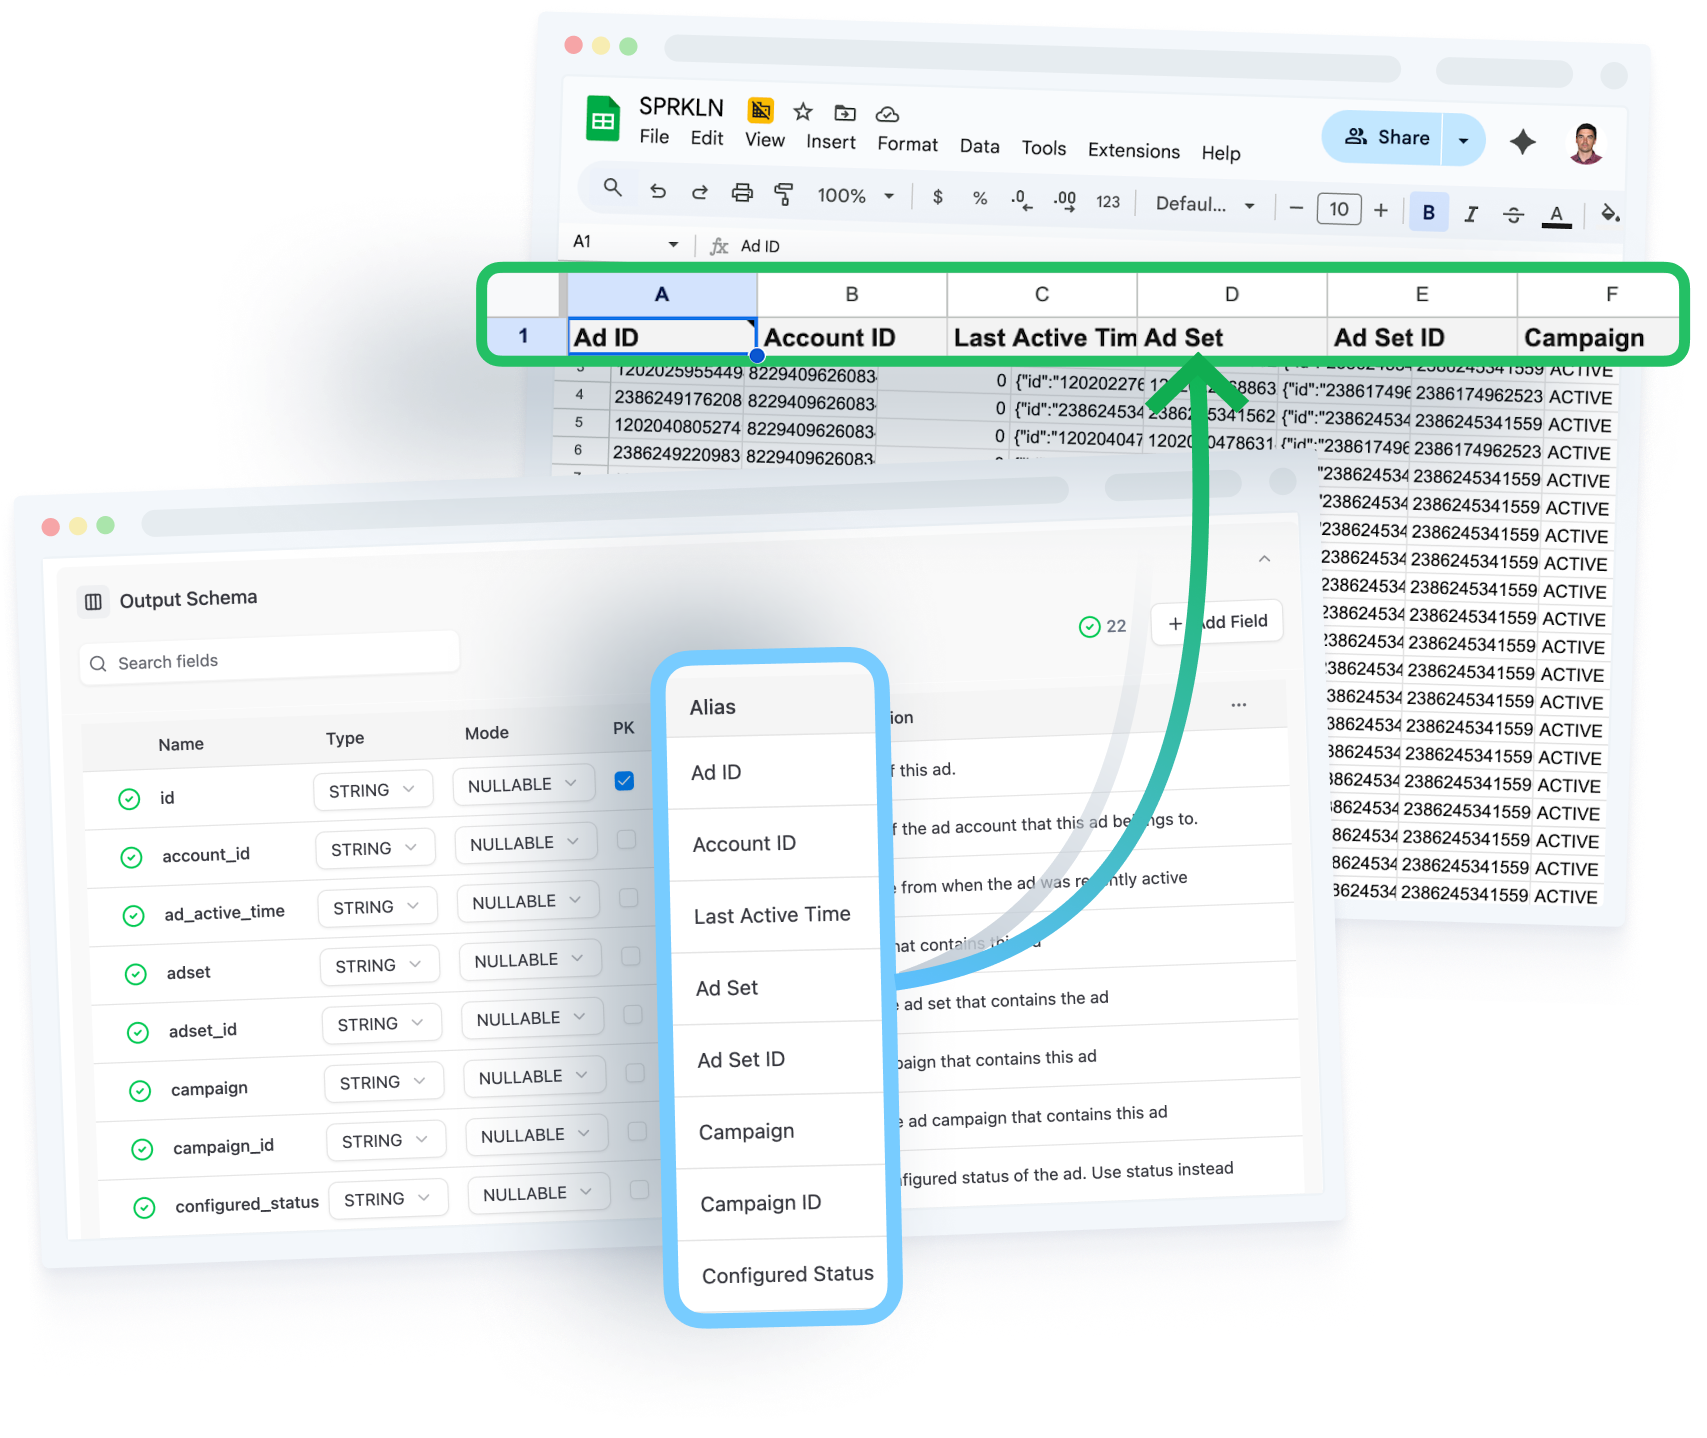
Monitor, version, and publish changes from a single UI.
Describe fields with aliases, metadata, and documentation – like an internal API for analytics.
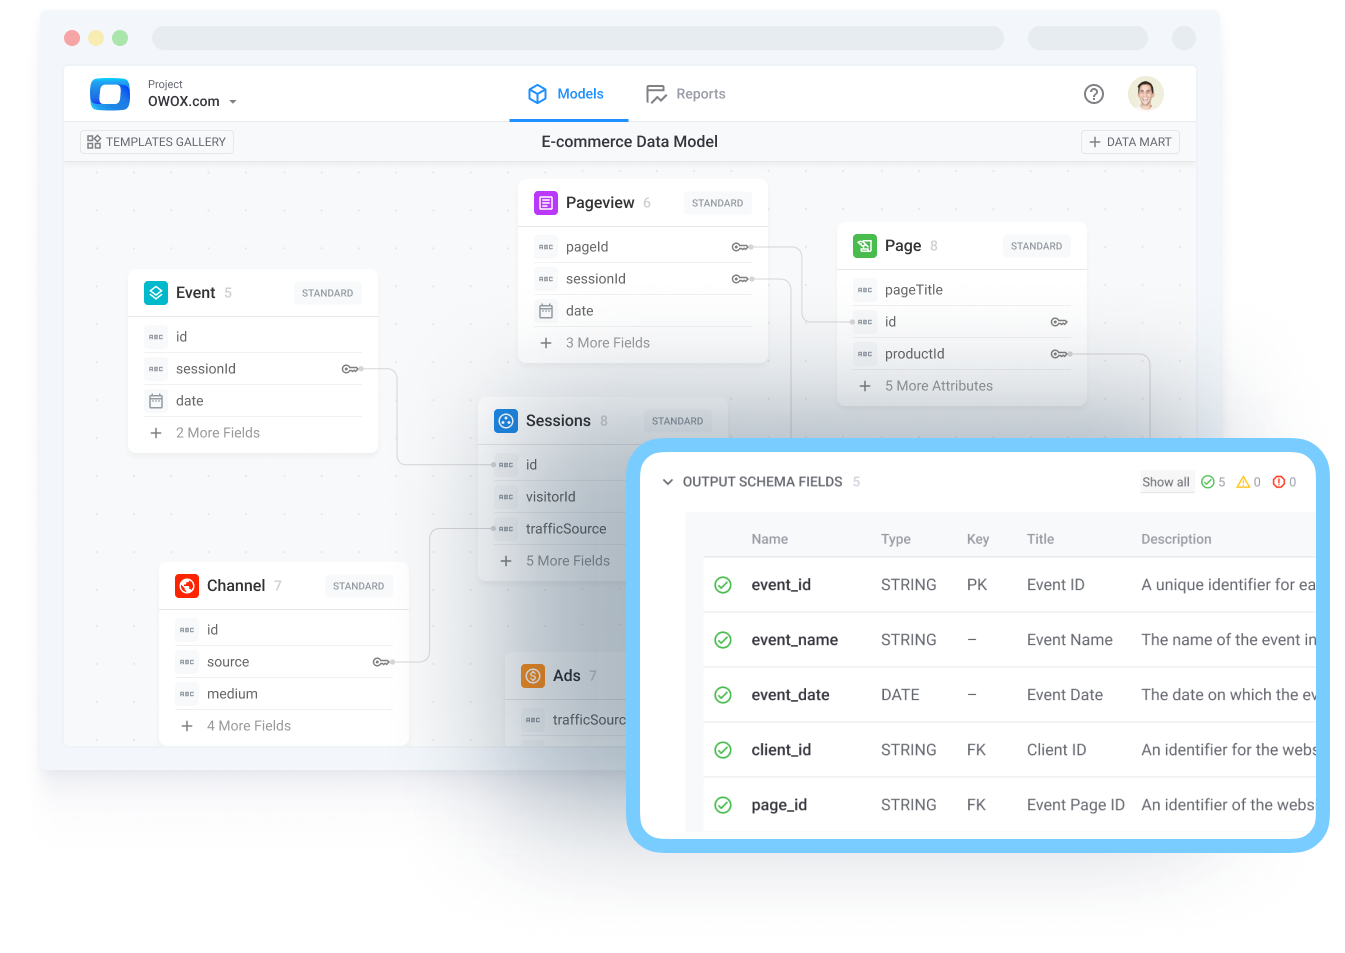
Simplify reporting with seamless modeling
Connect existing data marts and define relationships once – no need to restructure your data warehouse: set primary keys and join paths visually.
Blend warehouse tables, SQL results, and connector-based data.
Enable reusable, trusted logic that scales across dashboards, Sheets, and AI tools.

Centralize metrics definitions across teams
Unify your company’s KPIs in one semantic layer so everyone works from the same definitions:
(1) Centralize metrics, dimensions, and business terms in a single data catalog;
(2) Reuse logic across data marts, dashboards, and reports;
(3) Align teams and stakeholders by eliminating duplicate logic and manual patchwork.
.avif)
Turn your data into a reusable playbook
Structure your model once and reuse it across the business
(1) Define metrics by business context - e.g., funnel, campaign, cohort, etc.;
(2) Map relationships between objects and data marts;
(3) Empower others to build reports without redefining logic – every time.
%201.avif)
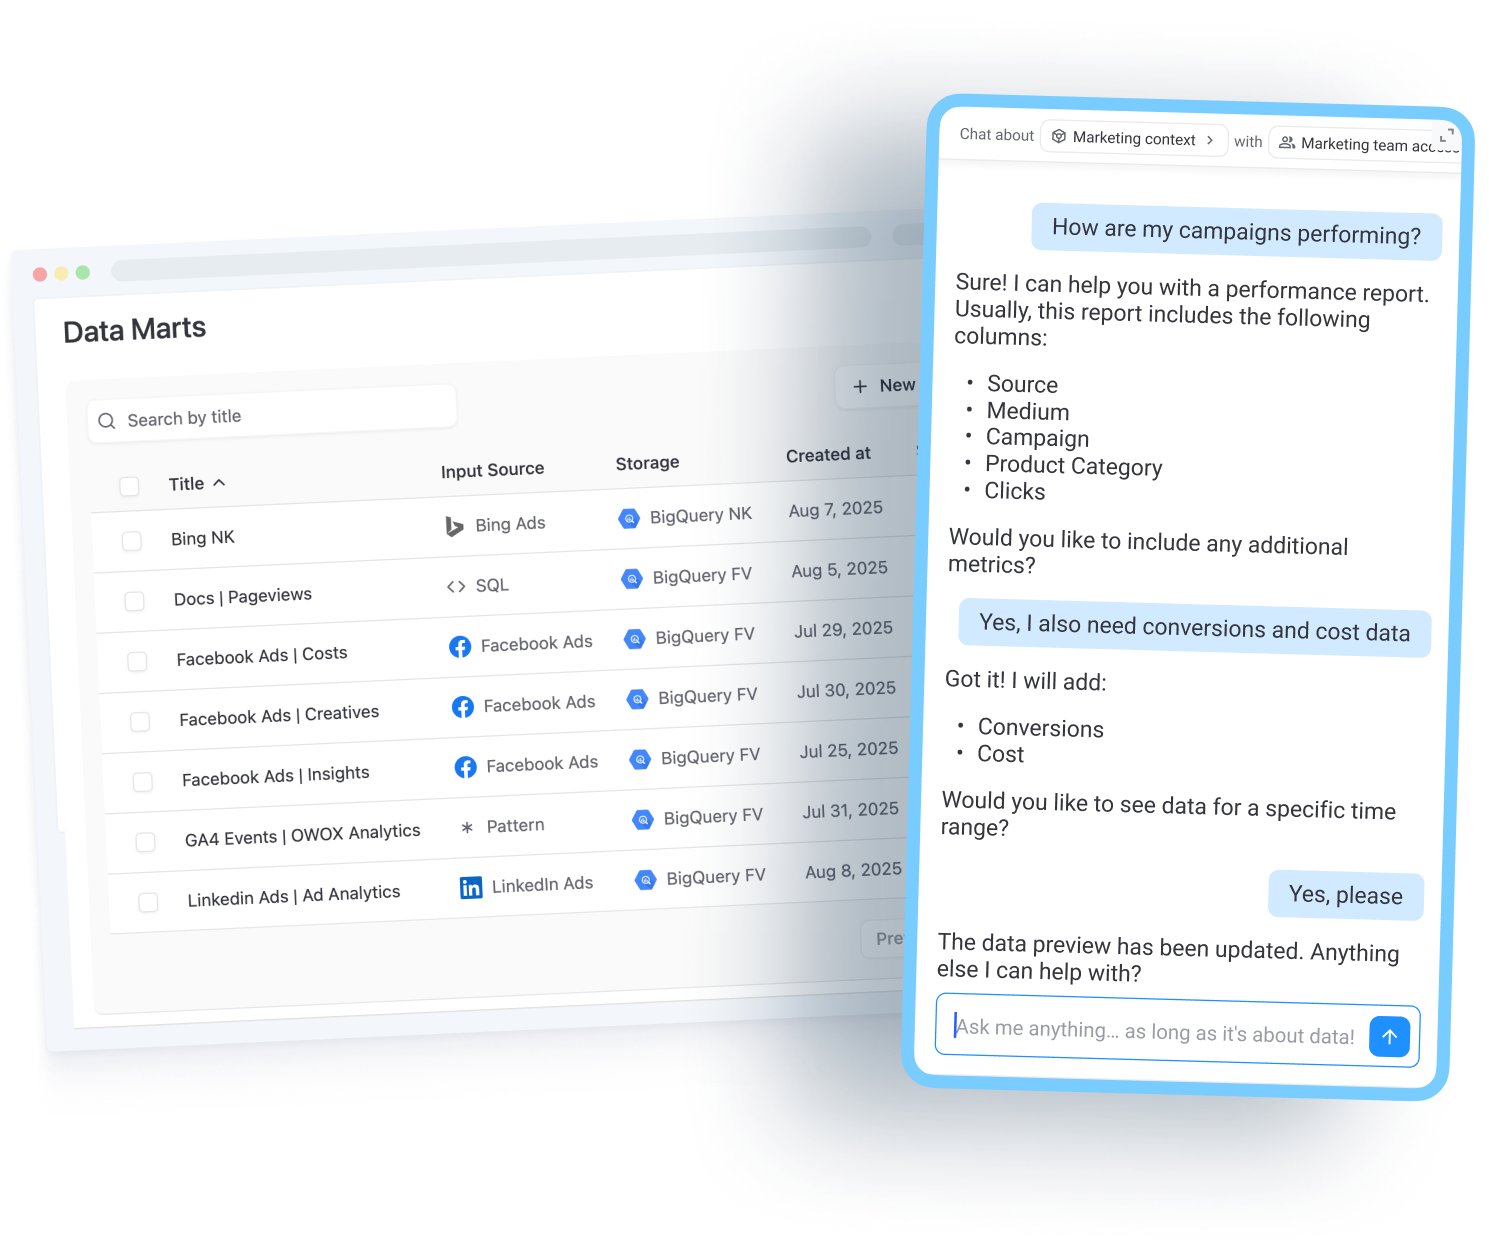
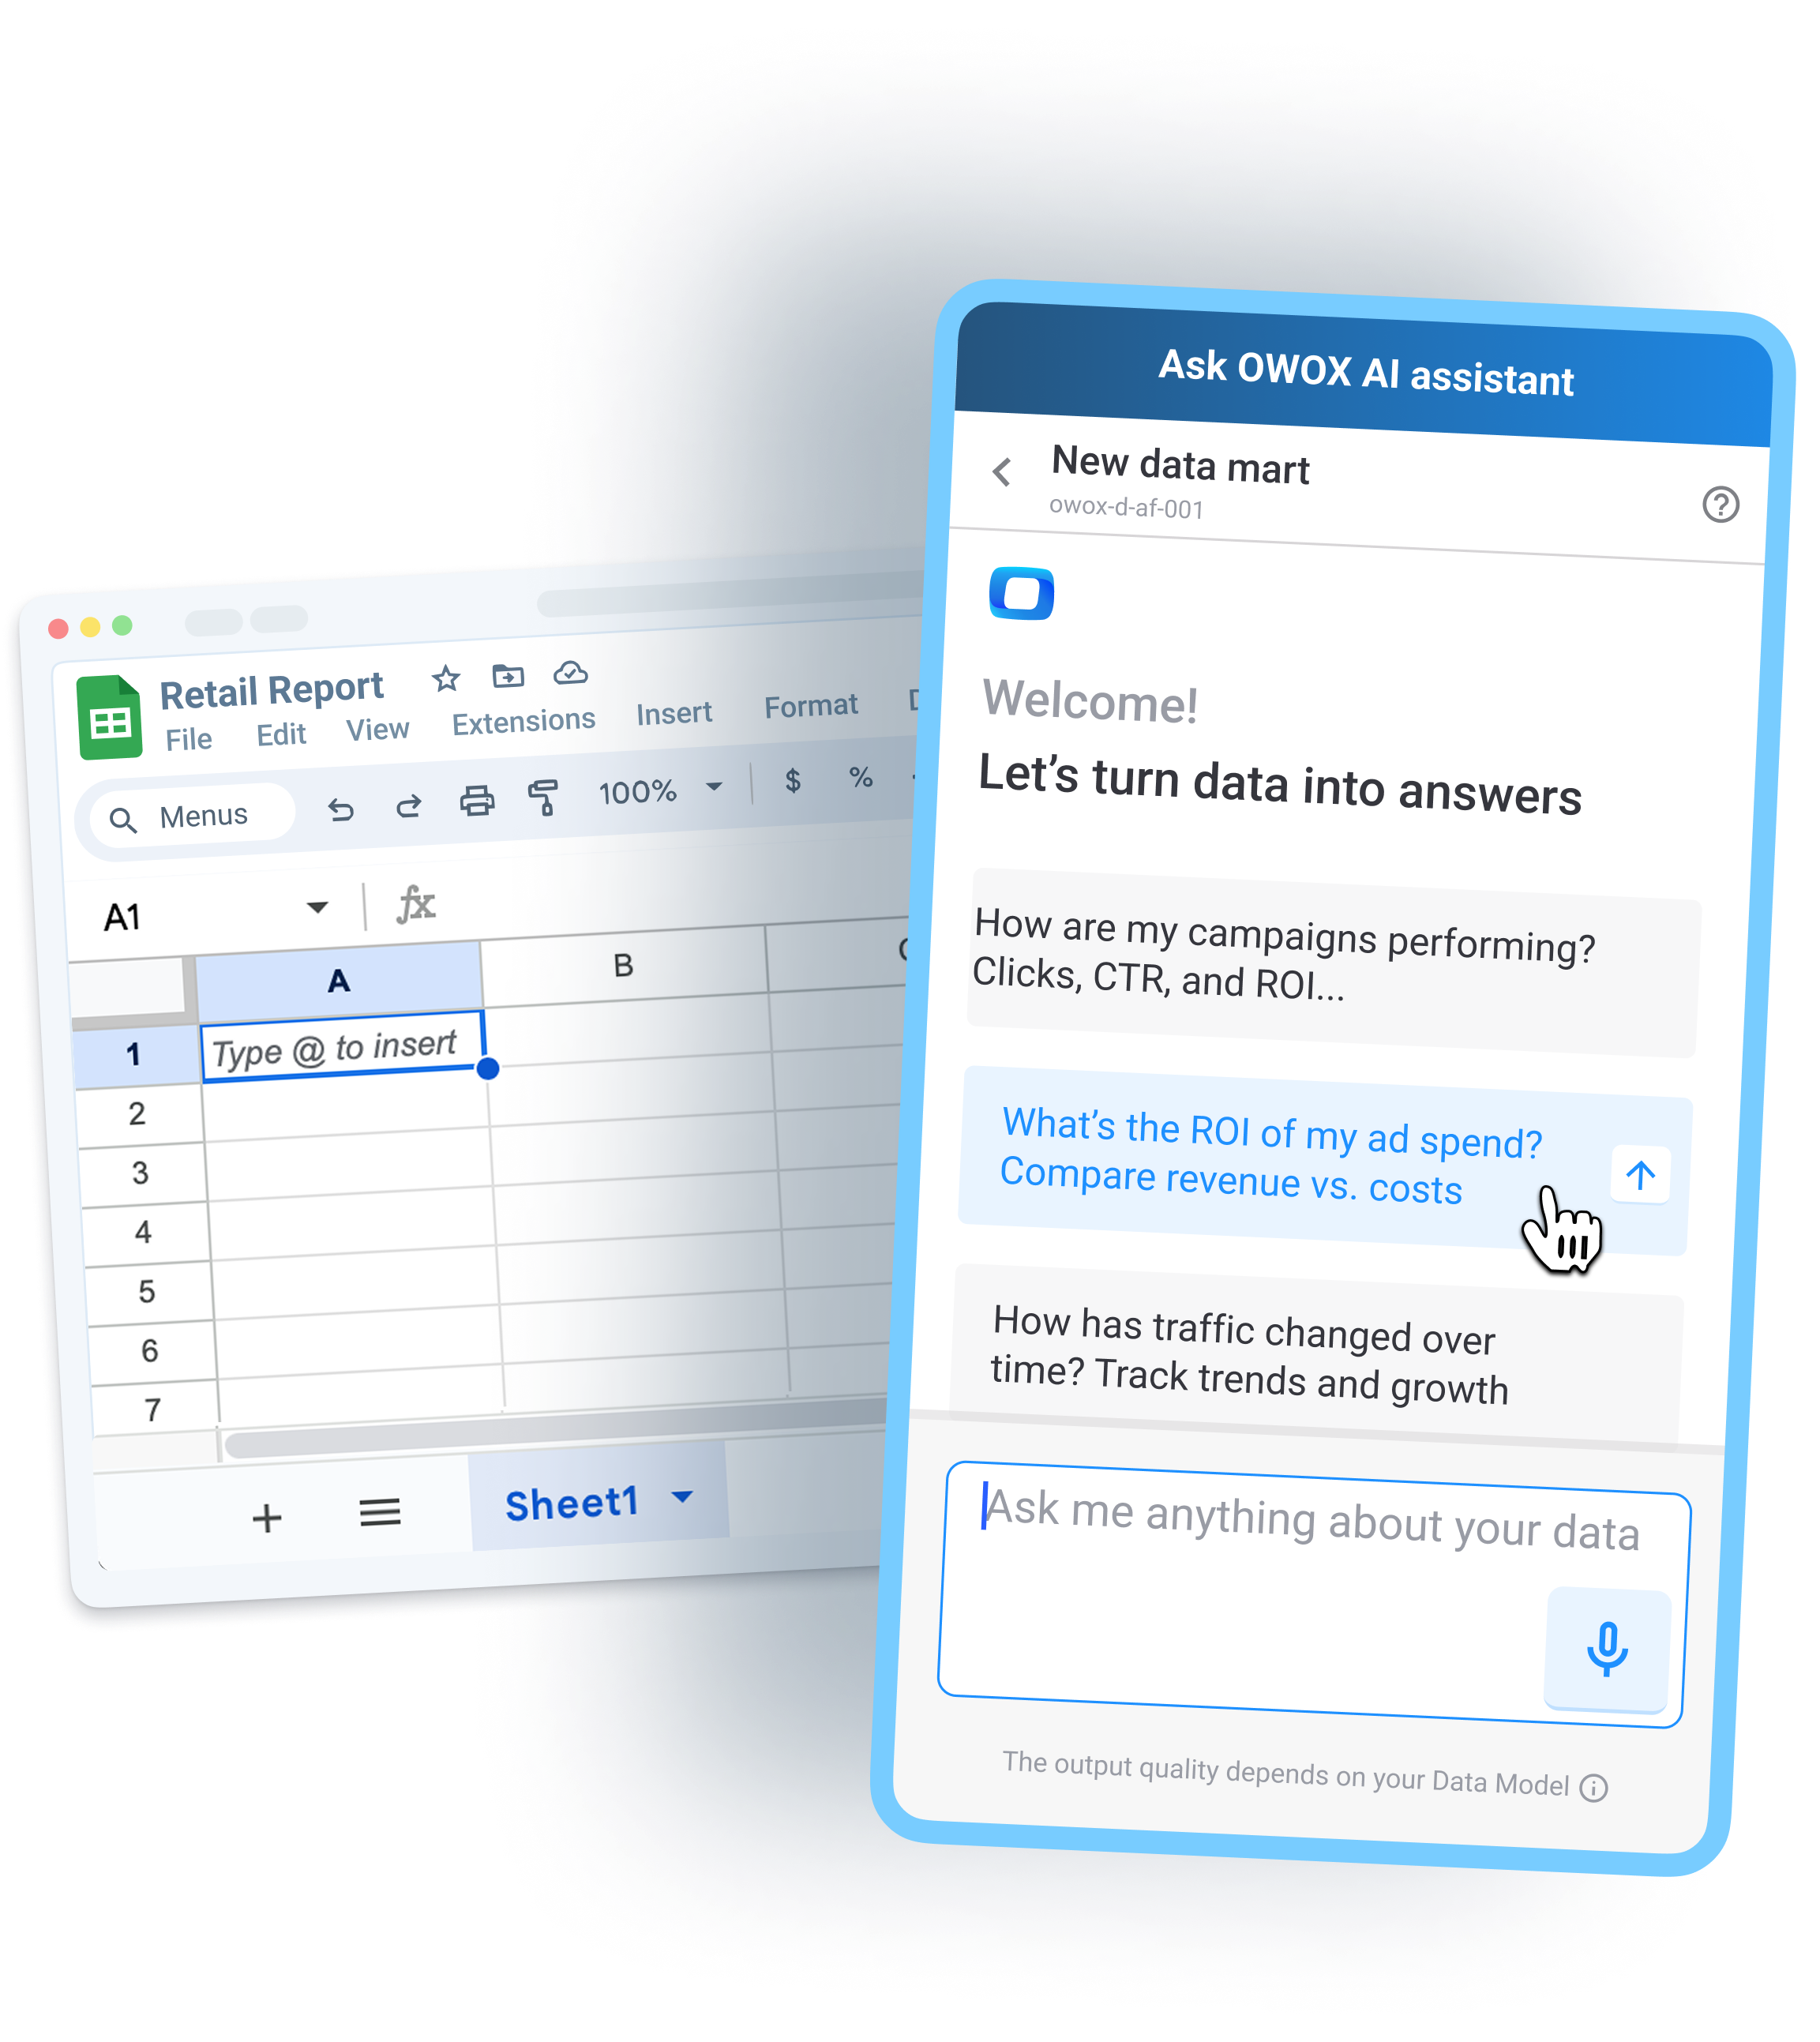
Enable self-service without sacrificing accuracy
Let anyone explore complex business data using trusted logic – with zero SQL:
(1) Use predefined join paths and metrics for accurate, governed exploration;
(2) Empower teams via Conversational UI, Sheets, or dashboards;
(3) Reduce report requests and free analysts to focus on strategic work.

Make confident decisions from trusted data
Create a layer that bridges business terms with physical data tables:
(1) Give everyone access to consistent campaign, funnel, and revenue metrics;
(2) Improve confidence in reporting and decision-making;
(3) Foster a culture of trust, transparency, and clarity – across all departments.

%203.png)
Step 1: Grab your data
Works with any data in your sheet: you can visualize your data regardless of its format, complexity or number of rows / columns.
Instant schema detection: OWOX Reports automatically identifies data types, formats and relationships without any manual setup.
Automatic detection of viable tables/charts: Our smart algorithms suggest the most relevant visualizations based on the detected data patterns.

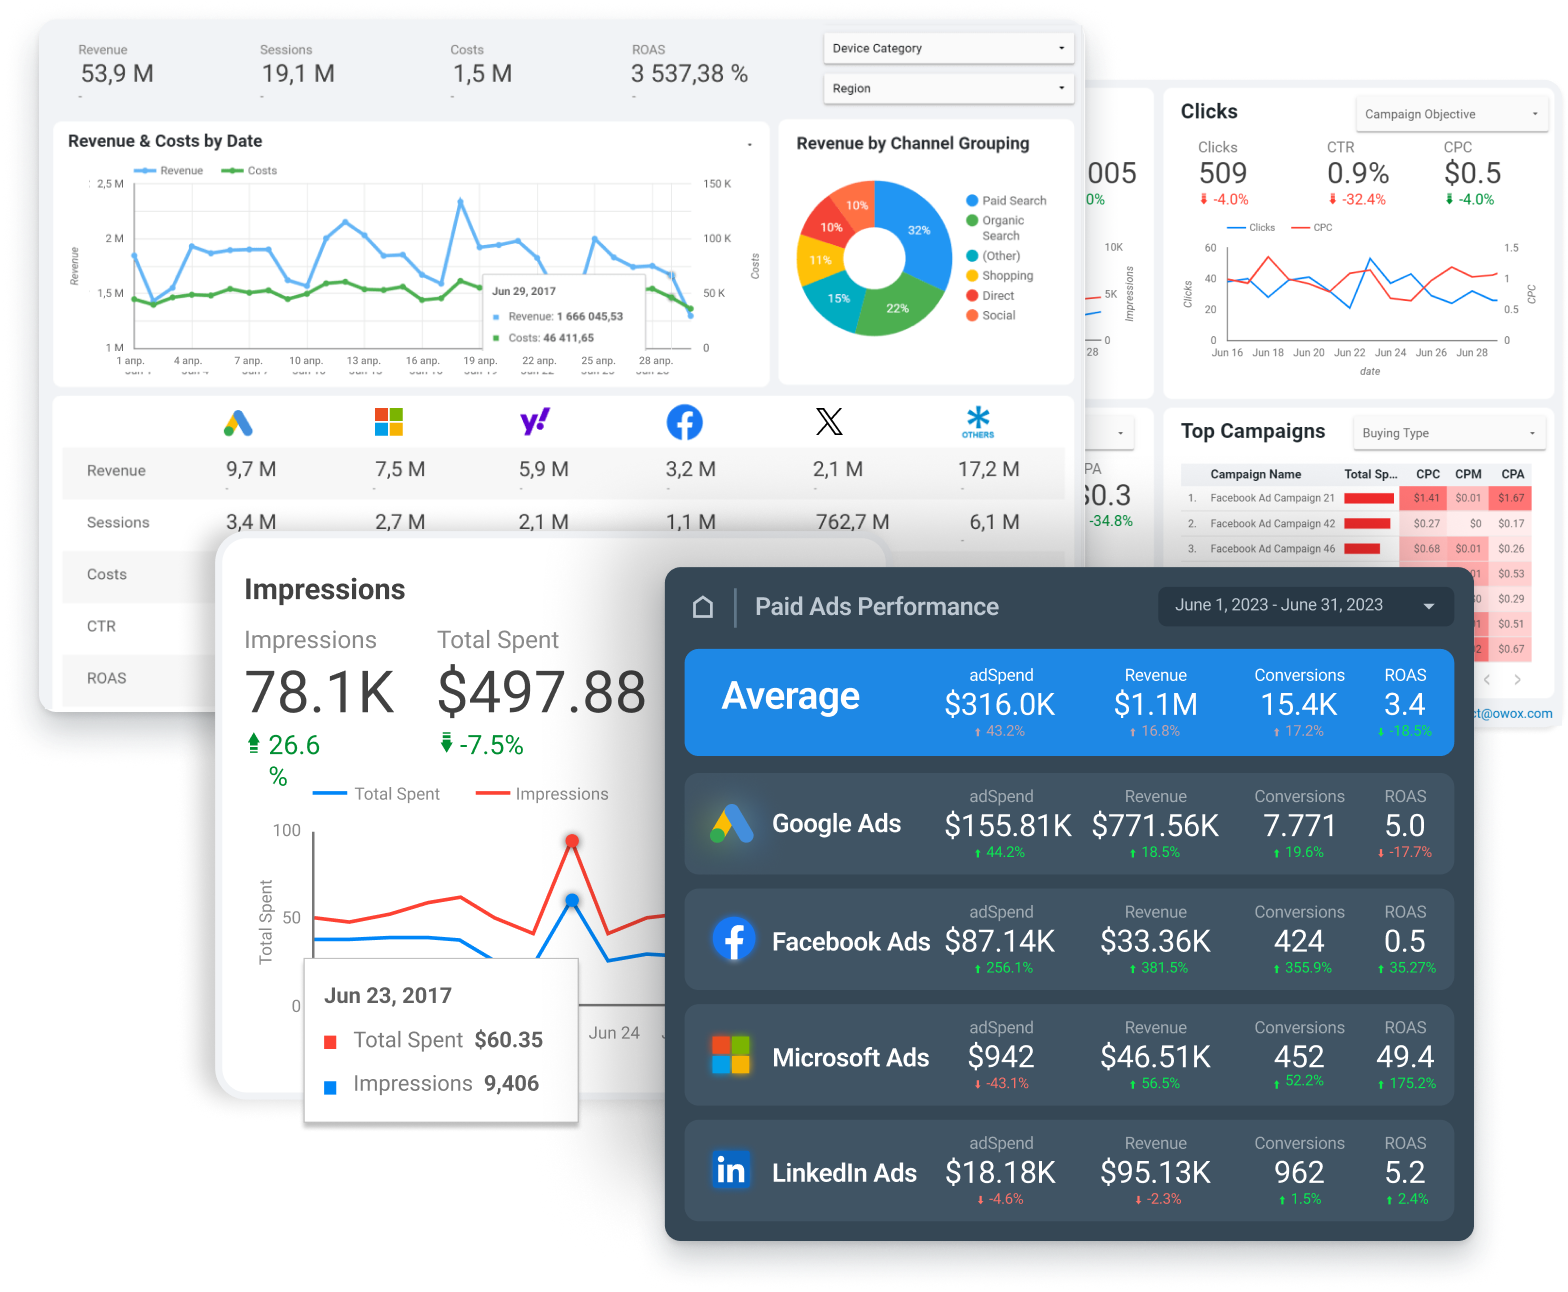
Step 2: Generate dashboard
1-click to transform raw tables into a comprehensive editable dashboard with 10+ reports.
Data exploration with NO effort: spend literally no time building dashboards and more time gaining insights from your data.
Diverse chart options: get everything at once - from line graphs to pie charts, automatically generate a range of visual representations to better understand your data.

Step 3: Customize your charts
Fully adjustable tables and charts to fit your metrics and dimensions: tailor every aspect of your charts to meet specific business needs.
No learning curve: Google Sheets UI allows for easy on-the-fly modifications without any technical hurdles.
Note: You don’t need to customize charts when new data comes in. We handled this so you don’t have to.
Step 4: Add more data
Your charts are refresh-ready: you - add more data, your reports - stay always current.
Save time on manual data ranges updates and ensure continuous insights: Focus on analysis instead of data maintenance.
Note: Use OWOX Data Marts to get more corporate data into Spreadsheets on a schedule.


%202.png)