BigQuery for Marketing Analytics: What Changed in 2026
Standard tools hit a ceiling as your data grows. Here's what changed in BigQuery and Data Studio in 2026, and when marketing analytics belongs in a warehouse.

The shift toward digital business has accelerated dramatically, and with it, the volume of data marketing analysts must handle every day. More consumer touchpoints mean more complex data structures – and standard analytics tools often can’t keep up.
This data must be securely stored, processed efficiently, and preserved for the long term. Historical data is an invaluable asset for any marketer who needs to spot trends and measure true business impact.
Let’s figure out why BigQuery is needed alongside Google Analytics 4 and Data Studio – what changed in 2026, and when it makes sense to make the move.
Note: Originally published in January 2021. Fully updated in September 2026 with the current BigQuery Studio interface, the Data Studio rename, and current pricing guidance.
What changed in BigQuery and Data Studio in 2026
What changed in BigQuery and Data Studio in 2026
If you last evaluated this stack a couple of years ago, three things have moved. None of them changes why you’d use a warehouse, but all three change how the work feels day to day.
Looker Studio is called Data Studio again
In April 2026, Google returned the Looker Studio product name to its original: Data Studio. The product URL is now datastudio.google.com, and lookerstudio.google.com redirects to it automatically. Existing reports keep working and need no changes, though teams whose IT restricts external domains through a proxy will need the new domain added to the allow list.
Worth knowing if you maintain internal documentation: every “Looker Studio” reference in your runbooks is now a name your newer colleagues won’t recognise.
BigQuery Studio is the interface you’ll actually use
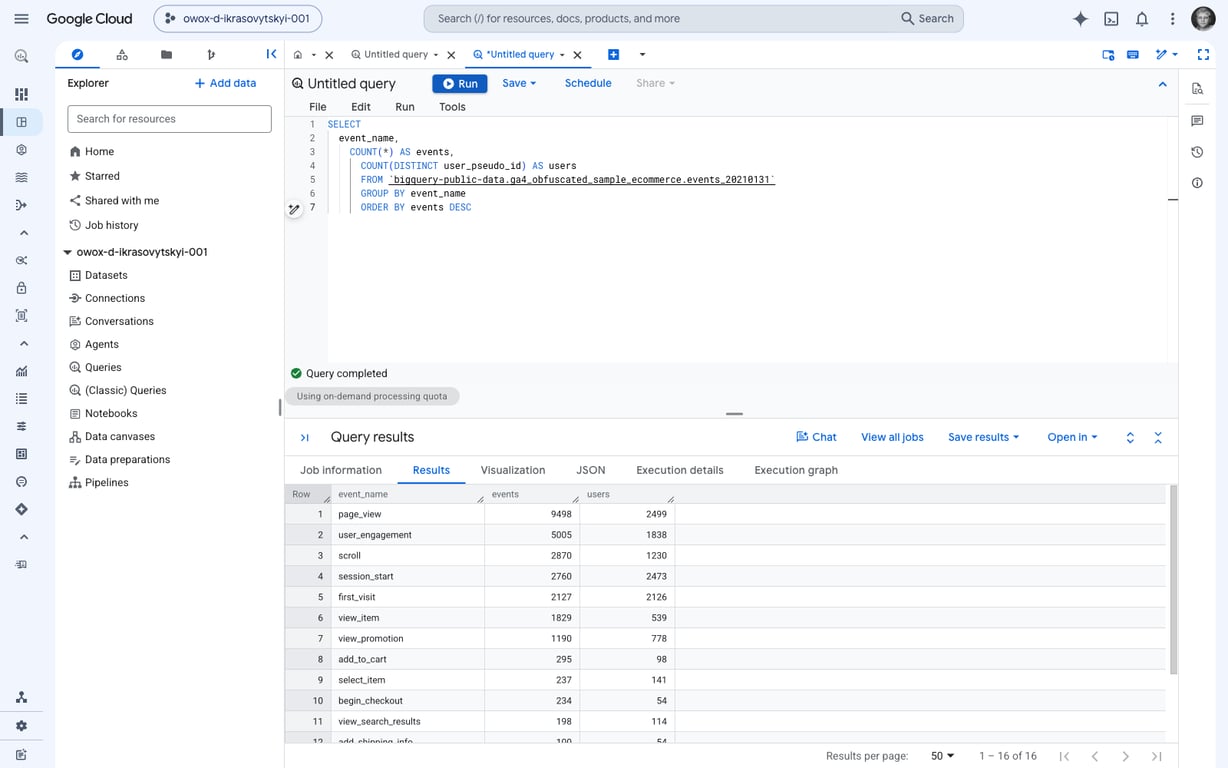
The BigQuery experience in the Google Cloud console is now BigQuery Studio – a single place to browse datasets, write and run SQL, build pipelines, and work in notebooks. If your mental picture of BigQuery is a plain query box bolted onto a table list, that picture is several years out of date.
Recent additions that matter for a working analyst, from Google’s own release notes:
- The query results pane keeps a short history of recent runs, including multi-statement queries, so you can compare what you just ran without leaving for the Job history tab (generally available, September 2026).
- Unit tests for pipelines let you validate SQL transformation logic against mock datasets before it reaches production (generally available, September 2026).
- A migration lineage service visualises data flow and connections in a source database to help plan a warehouse migration (preview, September 2026).
Pricing is compute plus storage, and you can reserve capacity
BigQuery’s pricing has two main components: compute, which is the cost of processing queries, and storage, which is the cost of keeping the data you load. You don’t provision servers – BigQuery allocates resources as you need them. You can also reserve compute capacity in advance as slots, which represent virtual CPUs, when predictable spend matters more than pay-as-you-go flexibility.
There’s also a free usage tier and a sandbox, so a marketing team can test the waters without a credit card. For the detail, see our guide to BigQuery pricing and Google’s own pricing documentation.
The need for advanced analytics tools in today’s marketing landscape
The need for advanced analytics tools in today’s marketing landscape
Standard tools work well enough early on, but they hit ceilings fast as businesses grow. The scale of connected devices and services is the reason why.
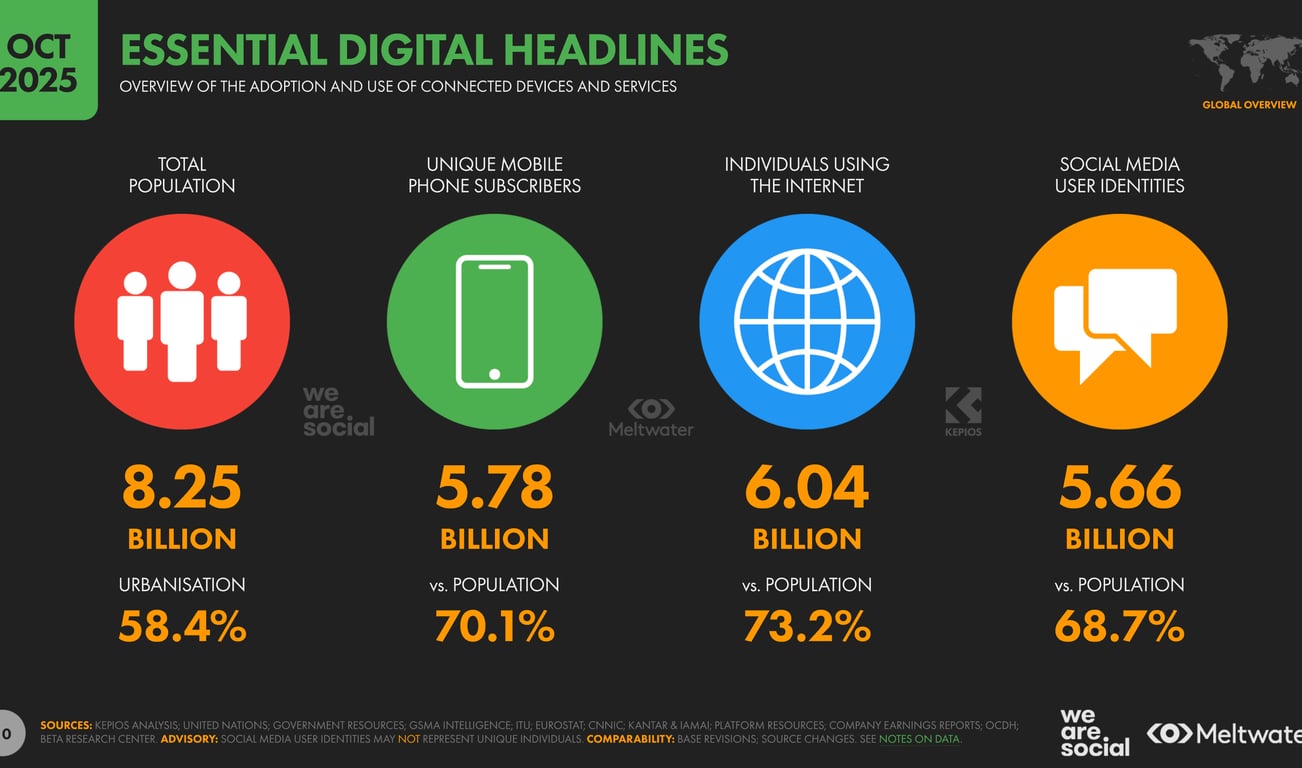
More than six billion people now use the internet, and unique mobile subscribers have passed 5.7 billion – roughly 70% of the world’s population (DataReportal, Digital 2026 Global Overview Report, October 2025 figures). Every one of those connections is a potential touchpoint generating data in a different shape.
Marketing reports must incorporate diverse data sources, such as:
- Advertising services
- Websites and mobile apps
- Online and offline stores
- CRMs
- Call tracking systems
Each of these sources typically has a different data structure. Standard tools like Google Analytics 4 and Data Studio are widely used, but they lack the flexibility and scalability that complex analytics demands. Cloud data warehouses and well-governed data layers fill that gap, providing scalable infrastructure and a single source of truth that every team can trust.
Let’s explore how to recognize when it’s time to switch to more advanced tools.
OWOX Data Marts
See your first report built in real time. 15 minutes.
- Connect your data warehouse
- Pick your metrics
- Get a live Google Sheets report
In the time it takes to write a ticket. Then imagine never writing that ticket again.
Book a DemoWe'll use your actual use case
Introduction to analytical tools: BigQuery, Google Analytics 4, Data Studio
Introduction to analytical tools: BigQuery, Google Analytics 4, Data Studio
Many companies rely on popular Google services, but not all these tools are universally beneficial or necessary. Their utility varies based on a company’s size, industry, and data maturity. A startup with a single landing page and a large omnichannel retailer have very different analytical needs.
Marketing insights: Google Analytics 4
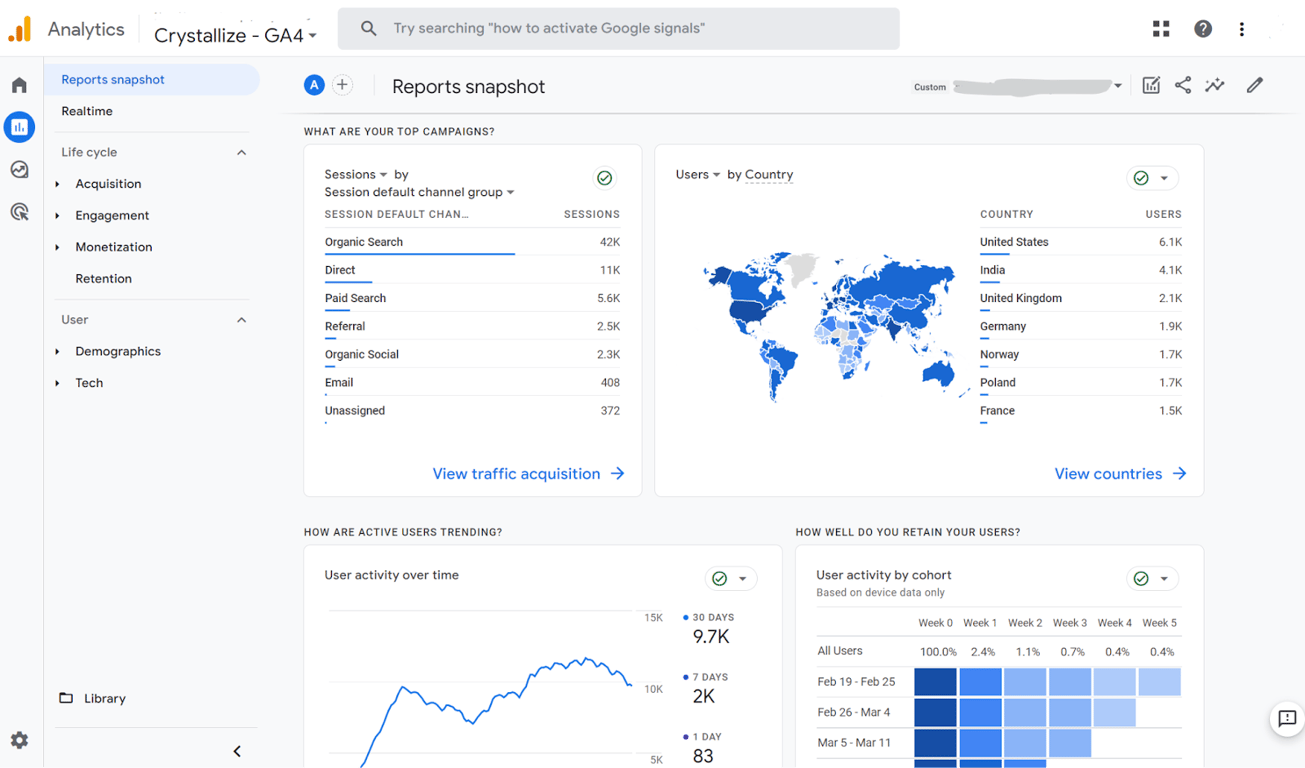
GA4 is engineered to handle the complexities of the modern digital landscape, offering a more integrated approach to understanding user behavior across platforms and devices. Its event-based model tracks a wider range of interactions than the session-based model it replaced, which matters as the number of data sources keeps growing.
GA4 does not impose the same restrictions on data collection as previous versions, so businesses can expand their analytics as they grow. But the interface reports on aggregated, sampled data. The moment you need to join GA4 behaviour with ad cost, CRM records or offline sales, you need the raw events – and that means the GA4 BigQuery export.
One practical step: pipe your GA4 event data into BigQuery, then build governed OWOX Data Marts on top – so every team pulls from the same verified numbers rather than building their own spreadsheet formulas.
Data visualization: Data Studio (formerly Looker Studio)
Data Studio is a no-cost tool that turns data into shareable, customizable dashboards and reports, with a drag-and-drop editor and connectors to a wide range of sources. Its home page now brings reports, data sources, BigQuery conversational agents, and data apps built in Colaboratory notebooks into one place.
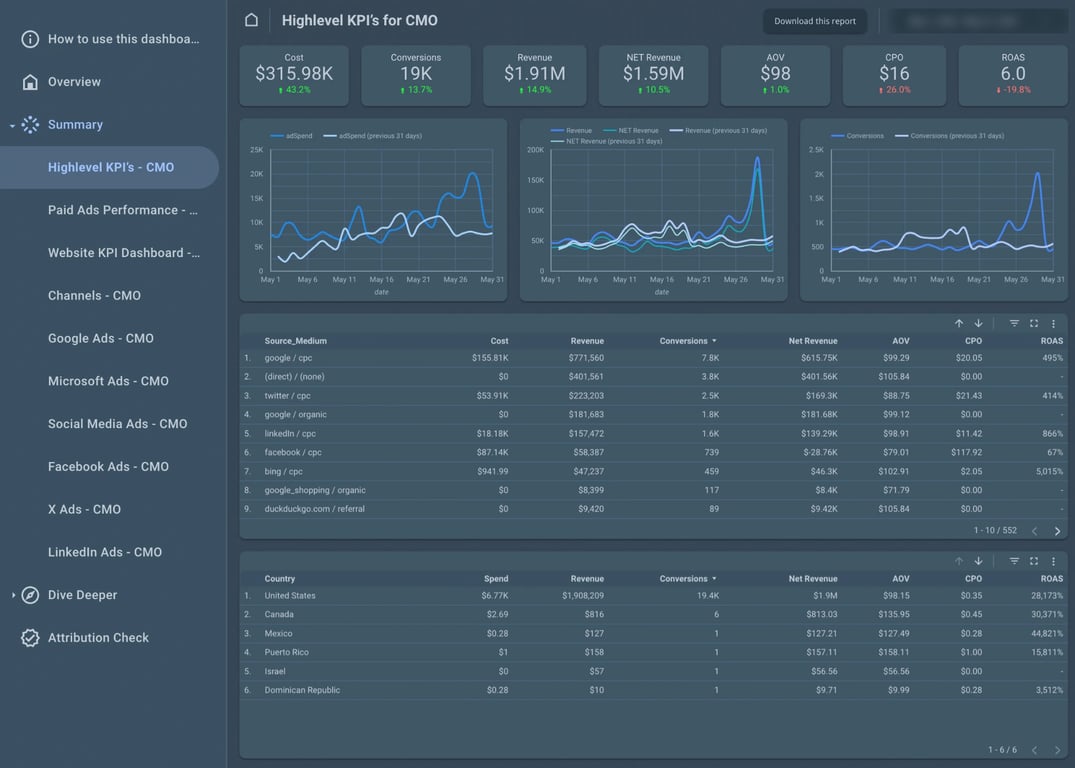
What makes it useful in this stack is not the charting – plenty of tools chart. It’s that a single report can sit directly on a governed table or view in BigQuery, so the dashboard and the analyst’s SQL cannot drift apart. For a walkthrough, see our Data Studio tutorial and the guide to building a GA4 BigQuery dashboard.
Marketing data warehouse: BigQuery
Different businesses, even within the same industry, have unique needs for marketing analytics – varying sales funnels, purchase frequencies, and retention strategies. Google BigQuery has democratized access to big data analysis, making it accessible not just to large corporations but to all companies in the market.
Google BigQuery is a fully managed, serverless data warehouse that facilitates safe and scalable analysis of petabytes of data.
Some of its key benefits include:
- Security and reliability: control access to encrypted projects or datasets and implement identity access management (IAM).
- Scalability: tailor data storage to the size, performance, and cost requirements of your company.
- Cost control: pay-as-you-go by default, with reserved slots available when spend needs to be predictable.
- Time to value: start quickly, explore data to find useful insights, and act faster on new business opportunities.
Two factors matter most when developing an analytics system for the marketing department:
- Your business should have full access to and control over its data – your warehouse, your SQL, your history.
- Data should be presented in an interface that’s convenient, familiar, and suitable for decision-makers – not just analysts.
Getting started with BigQuery still requires a learning curve. That’s why the layer between BigQuery and your business teams matters as much as BigQuery itself. Governed, reusable Data Marts defined by your analysts bridge that gap – data stays in your warehouse, every number traces back to SQL the analyst owns, and business users can self-serve without waiting for ad-hoc queries.
BigQuery vs Ads Data Hub: which one, and when
BigQuery vs Ads Data Hub: which one, and when
These two get compared as if you had to choose. You don’t – Ads Data Hub writes its results into BigQuery, so in practice one feeds the other.
Ads Data Hub enables customized analysis on event-level data from your Google ad campaigns while protecting user privacy. It reads from a Google-owned Cloud project and writes aggregated results to a project you own. Privacy checks are enforced and Google’s data is aggregated before it ever leaves Google’s project.
That design decides when each one is the right tool:
- Use Ads Data Hub when the question genuinely needs Google’s event-level campaign data – cross-device reach and frequency, or campaign measurement that GA4’s interface cannot express – and you accept that answers come back aggregated.
- Use BigQuery directly for everything else: joining ad cost with CRM records, modelling attribution across non-Google channels, building the reporting layer your team works in day to day.
The practical pattern for most marketing teams is both: Ads Data Hub for the privacy-protected Google campaign questions, landing in the same BigQuery project where the rest of your marketing data already lives.
Why marketing analysts need BigQuery alongside Data Studio and GA4
Why marketing analysts need BigQuery alongside Data Studio and GA4
Combining BigQuery with Data Studio and Google Analytics data creates a toolkit for data-driven decision-making. BigQuery is the component that lets analysts overcome the limitations of traditional data handling.
- Crunch big data: BigQuery processes vast datasets quickly, making it invaluable for analysts working across large volumes from multiple sources, with insights available in near real time.
- Combine data from multiple sources: the marketing stack involves numerous tools, each generating siloed data. BigQuery consolidates that disparate data into a single repository, creating a unified source of truth.
- Access all your historical data: unlike platforms that restrict access to history, BigQuery lets you store and analyze all of it indefinitely – and because data stays in your warehouse, no vendor can cut that history from under you.
- Automate data refreshes: scheduled queries and API connections keep dashboards current without manual work, saving time and reducing human error.
- Conduct ad-hoc analysis: as a warehouse, BigQuery supports custom metrics and dimensions through SQL, letting marketers explore data in ways a fixed report cannot.
Comparison between GA4, Data Studio, and Google BigQuery
Comparison between GA4, Data Studio, and Google BigQuery
GA4, Data Studio, and Google BigQuery each play a critical role, offering distinct advantages across data collection, analysis and presentation.
- Primary use
- Data Studio: data visualization and reporting.
- Google BigQuery: data warehousing and large-scale data analysis.
- Google Analytics 4: web and app analytics with user behavior insights.
- Data handling
- Data Studio: builds reports and dashboards from various data sources.
- Google BigQuery: processes and analyzes petabytes of data.
- Google Analytics 4: collects and reports data in real time.
- Integration
- Data Studio: connects to BigQuery, GA4, and many other sources.
- Google BigQuery: serves as a data source for Data Studio.
- Google Analytics 4: exports raw events to BigQuery, and can be visualized in Data Studio.
- Customization
- Data Studio: drag-and-drop editor for custom reports.
- Google BigQuery: highly customizable through SQL queries.
- Google Analytics 4: user-centric, cross-platform analysis.
- Analytical depth
- Data Studio: focuses on visualization rather than deep analysis.
- Google BigQuery: designed for complex queries and deep analysis.
- Google Analytics 4: focused on user interactions and conversions.

One distinction is worth stating plainly, because it catches people out: the data in your BigQuery export is raw, event-level data from GA4 – quite different from the aggregated, sampled reports in the GA4 interface. Numbers will not always match, and that is expected rather than a fault.
How to connect BigQuery to Data Studio
How to connect BigQuery to Data Studio
This is the step most teams get wrong, and it costs them either money or trust.
The Data Studio BigQuery connector lets you access and visualize data from BigQuery tables, views, and custom SQL queries. Before you start, you need a Google Cloud project with a billing account attached, and the right IAM roles on the project or dataset: BigQuery Data Viewer to read data and metadata, and BigQuery Job User to run query jobs.
You then have a choice, and it matters more than it looks:
- Connect to a table or view. The dashboard reads a shaped, named object. If the analyst changes the logic, every report using it changes with it.
- Connect with a custom SQL query. The query lives inside that one report. Nobody else can see it, reuse it, or fix it – and the next person rebuilds it slightly differently.
Option 2 is how a company ends up with four dashboards that disagree about revenue. Point reports at a governed view or Data Mart, not at a custom query pasted into a single report.
Two practical notes. BigQuery is a paid platform, so you may incur query processing costs each time a report refreshes – a dashboard on a custom query over a large table, opened by twenty people a day, is a recurring bill. And a report built on a governed object updates for everyone the moment the analyst updates the logic, which is the whole point.

Utilizing the power of three: BigQuery, Data Studio, and GA4 for marketing analysis
Utilizing the power of three: BigQuery, Data Studio, and GA4 for marketing analysis
Together these tools give a seamless flow of data – from collection via GA4, through processing and analysis in BigQuery, to reporting and visualization in Data Studio.
BigQuery’s warehousing allows storage and analysis of vast datasets, providing the foundation for deep analytical queries. That backend processing complements GA4’s user behavior analytics. Data Studio acts as the visualization layer, turning processed warehouse data into accessible, interactive reports that the rest of the business can read.
This integrated approach improves the accuracy and depth of marketing insight and significantly reduces the time spent managing data across disparate platforms.
Connect BigQuery, GA4, and Data Studio with governed data marts
Connect BigQuery, GA4, and Data Studio with governed data marts
If you’re moving to BigQuery for marketing analysis, the first step is to identify all the data sources you’ll need. This typically includes advertising services, GA4, websites, offline stores, call tracking systems, and CRM data. For many teams, connecting those sources is the biggest technical hurdle.
Getting data into BigQuery is one challenge. Getting it out – in a form business users can work with – is another. That’s where OWOX Data Marts fits in. Analysts write the SQL that defines sessions, attribution logic, or cost models, and OWOX governs, schedules, and publishes those definitions as reusable Data Marts. No brittle intermediate layers to build and maintain. Every number every report uses traces back to analyst-approved SQL.
Business users – marketers, finance leads, campaign managers – then browse the Data Mart library from Google Sheets using the OWOX Sheets Extension. They pick the mart they need, choose their columns, apply filters, and refresh: no SQL required, no waiting on analyst queues. When the analyst updates the mart logic, every connected Sheet refreshes automatically.
Three things make this approach worth noting:
- Data stays in your warehouse. OWOX never copies your data to a vendor cloud. Your BigQuery project, your SQL, your history – protected from API changes or vendor pricing decisions.
- No extra abstraction layer to build. Metrics live at the Data Mart level, defined in SQL the analyst already understands. There’s no months-long intermediate project between your warehouse and your reports.
- Every number is auditable. When a stakeholder questions a figure, the analyst can show exactly which SQL produced it: no ambiguity, no black-box transformations.
Key takeaways
- The names changed, the architecture didn’t. Data Studio is Looker Studio’s current name as of April 2026, and BigQuery Studio is the console you’ll work in. Update your documentation; don’t re-plan your stack.
- Move when the questions outgrow the interface. If you’re hitting sampling, stitching exports by hand, or answering “why don’t these two numbers match”, the warehouse is overdue.
- Ads Data Hub is not an alternative to BigQuery – it writes into it, under privacy constraints, for Google campaign questions specifically.
- Connect dashboards to governed objects, not pasted SQL. It’s the difference between one number and four.
- The bridge between BigQuery and your business teams matters as much as BigQuery itself – governed Data Marts mean analysts define the logic once and the whole organization self-serves from verified numbers.
Turn your data into decisions.
Governed data marts give you the clean foundation ML needs to actually work.
- No AI hallucinations
- Analyst-governed definitions
- Every number traces to SQL
Frequently Asked Questions
What changed in BigQuery for marketing teams in 2026?
Three things moved in 2026. In April, Google returned the Looker Studio product name to its original, Data Studio, and the product URL became datastudio.google.com — existing reports keep working and lookerstudio.google.com redirects automatically. In the warehouse itself, BigQuery Studio is now the console experience for browsing datasets, writing SQL, building pipelines and working in notebooks. And Google's release notes through September 2026 added run history in the query results pane, unit tests for pipelines, and a migration lineage service in preview. None of this changes why a marketing team moves to a warehouse; it changes how the day-to-day work feels.
Is Looker Studio still called Looker Studio?
No. In April 2026 the product name returned to its original: Data Studio. The product URL is now datastudio.google.com, and lookerstudio.google.com redirects to it automatically. You do not need to update existing reports for this change. If your company uses proxies to restrict access to external sites, your IT administrator will need to add the new domain to the allow list.
What is BigQuery Studio?
BigQuery Studio is the BigQuery experience inside the Google Cloud console: a single place to view tables and datasets, create and run SQL queries, build pipelines, and work in notebooks. If your mental picture of BigQuery is a plain query box bolted onto a table list, that picture is several years out of date.
What is the difference between Ads Data Hub and BigQuery?
They are not alternatives. Ads Data Hub runs customized analysis on event-level data from your Google ad campaigns while enforcing privacy checks, and it writes aggregated results into a BigQuery dataset in a Google Cloud project you own. BigQuery is the warehouse those results land in, alongside the rest of your marketing data. Use Ads Data Hub when the question genuinely needs Google's event-level campaign data and you accept aggregated answers. Use BigQuery directly for everything else: joining ad cost with CRM records, modelling attribution across non-Google channels, and the reporting your team works in every day.
How do I connect BigQuery to Data Studio?
Use the Data Studio BigQuery connector. You need a Google Cloud project with a billing account attached, plus two IAM roles on the project or dataset: BigQuery Data Viewer to read data and metadata, and BigQuery Job User to run query jobs. You can then connect to a table, a view, or a custom SQL query. Prefer a table or a governed view: a custom query lives inside that one report, so nobody else can see, reuse or fix it, which is how a company ends up with several dashboards that disagree about revenue. Note that BigQuery is a paid platform, so you may incur query processing costs each time a report refreshes.
When should a marketing team move from GA4 to BigQuery?
When the questions outgrow the interface. GA4 reports on aggregated, sampled data, and that is fine until you need to join behaviour with ad cost, CRM records or offline sales, or keep history indefinitely. If your team is stitching exports together by hand, running into sampling, or spending meetings explaining why two numbers do not match, the warehouse is already overdue.