

What is a Standard View?
A Standard View in SQL is a dynamic virtual table in BigQuery created by saving a query. It doesn’t store data itself but shows the result of a SELECT statement when queried. It executes the underlying SQL query each time they are accessed.
Standard Views offer a layer of abstraction that enables teams to manage complexity, enforce consistent business logic, and control data access. By centralizing commonly used queries, they reduce redundancy, improve maintainability, and support cleaner, more secure analytics workflows across the organization.
Benefits of Standard Views
Standard Views offer multiple advantages that make them a powerful tool in SQL-based data systems. They improve efficiency, simplify access, and enhance security, all without duplicating data.
- Simplify complex queries: Encapsulate multi-table joins or calculated fields in a reusable view to streamline your data processing.
- Enhance data abstraction: Enable users to work with simplified representations of data without needing to know the underlying table structures.
- Enhance security: Limit access to sensitive columns or rows by granting permissions on views instead of base tables.
- Enable logical independence: Shield users from changes in the underlying schema as long as the view definition stays consistent.
- Support reusability and consistency: Use standardized views across reports and dashboards to ensure consistent logic and data presentation.
These benefits make standard views valuable in both analytics and production environments.
How Standard Views Work
Standard Views operate as saved SELECT statements that act like virtual tables. When you query a view, SQL executes the underlying query in real time and fetches the latest data from the base tables.
They do not store data themselves; every time the view is accessed, the database dynamically computes the result. This ensures that the output is always up to date. Views can be used in joins, filters, or aggregations just like regular tables, making them a flexible tool for abstracting and organizing data logic.
Examples of Creating and Using Standard Views in SQL
Standard Views are created using the CREATE VIEW statement, which defines a virtual table based on a SELECT query.
Below are a few examples that demonstrate how to create and use them:
Example 1: Creating a simple view
CREATE VIEW ActiveCustomers AS
SELECT CustomerID, Name, Status
FROM Customers
WHERE Status = 'Active';
This view filters only active customers and can be reused across reports and queries.
Example 2: Using a view in a query
SELECT Name
FROM ActiveCustomers
WHERE Name LIKE 'A%';
This query retrieves the names of all active customers starting with 'A' from the view.
Best Practices for Using Standard Views
To get the most value from standard views while keeping your SQL environment clean and efficient, follow these best practices:
- Use clear and descriptive names: Help others understand what the view represents.
- Keep logic consistent: Align views with business rules to prevent conflicting definitions.
- Avoid overly complex queries: Keep views simple for better performance and maintainability.
- Document view definitions: Share the purpose and logic behind each view for easier collaboration.
- Restrict view access: Grant permissions based on need-to-know to protect sensitive information.
- Update views cautiously: Test changes in a dev environment to avoid breaking dependent queries.
These practices help standard views remain reliable, scalable, and easy to use.
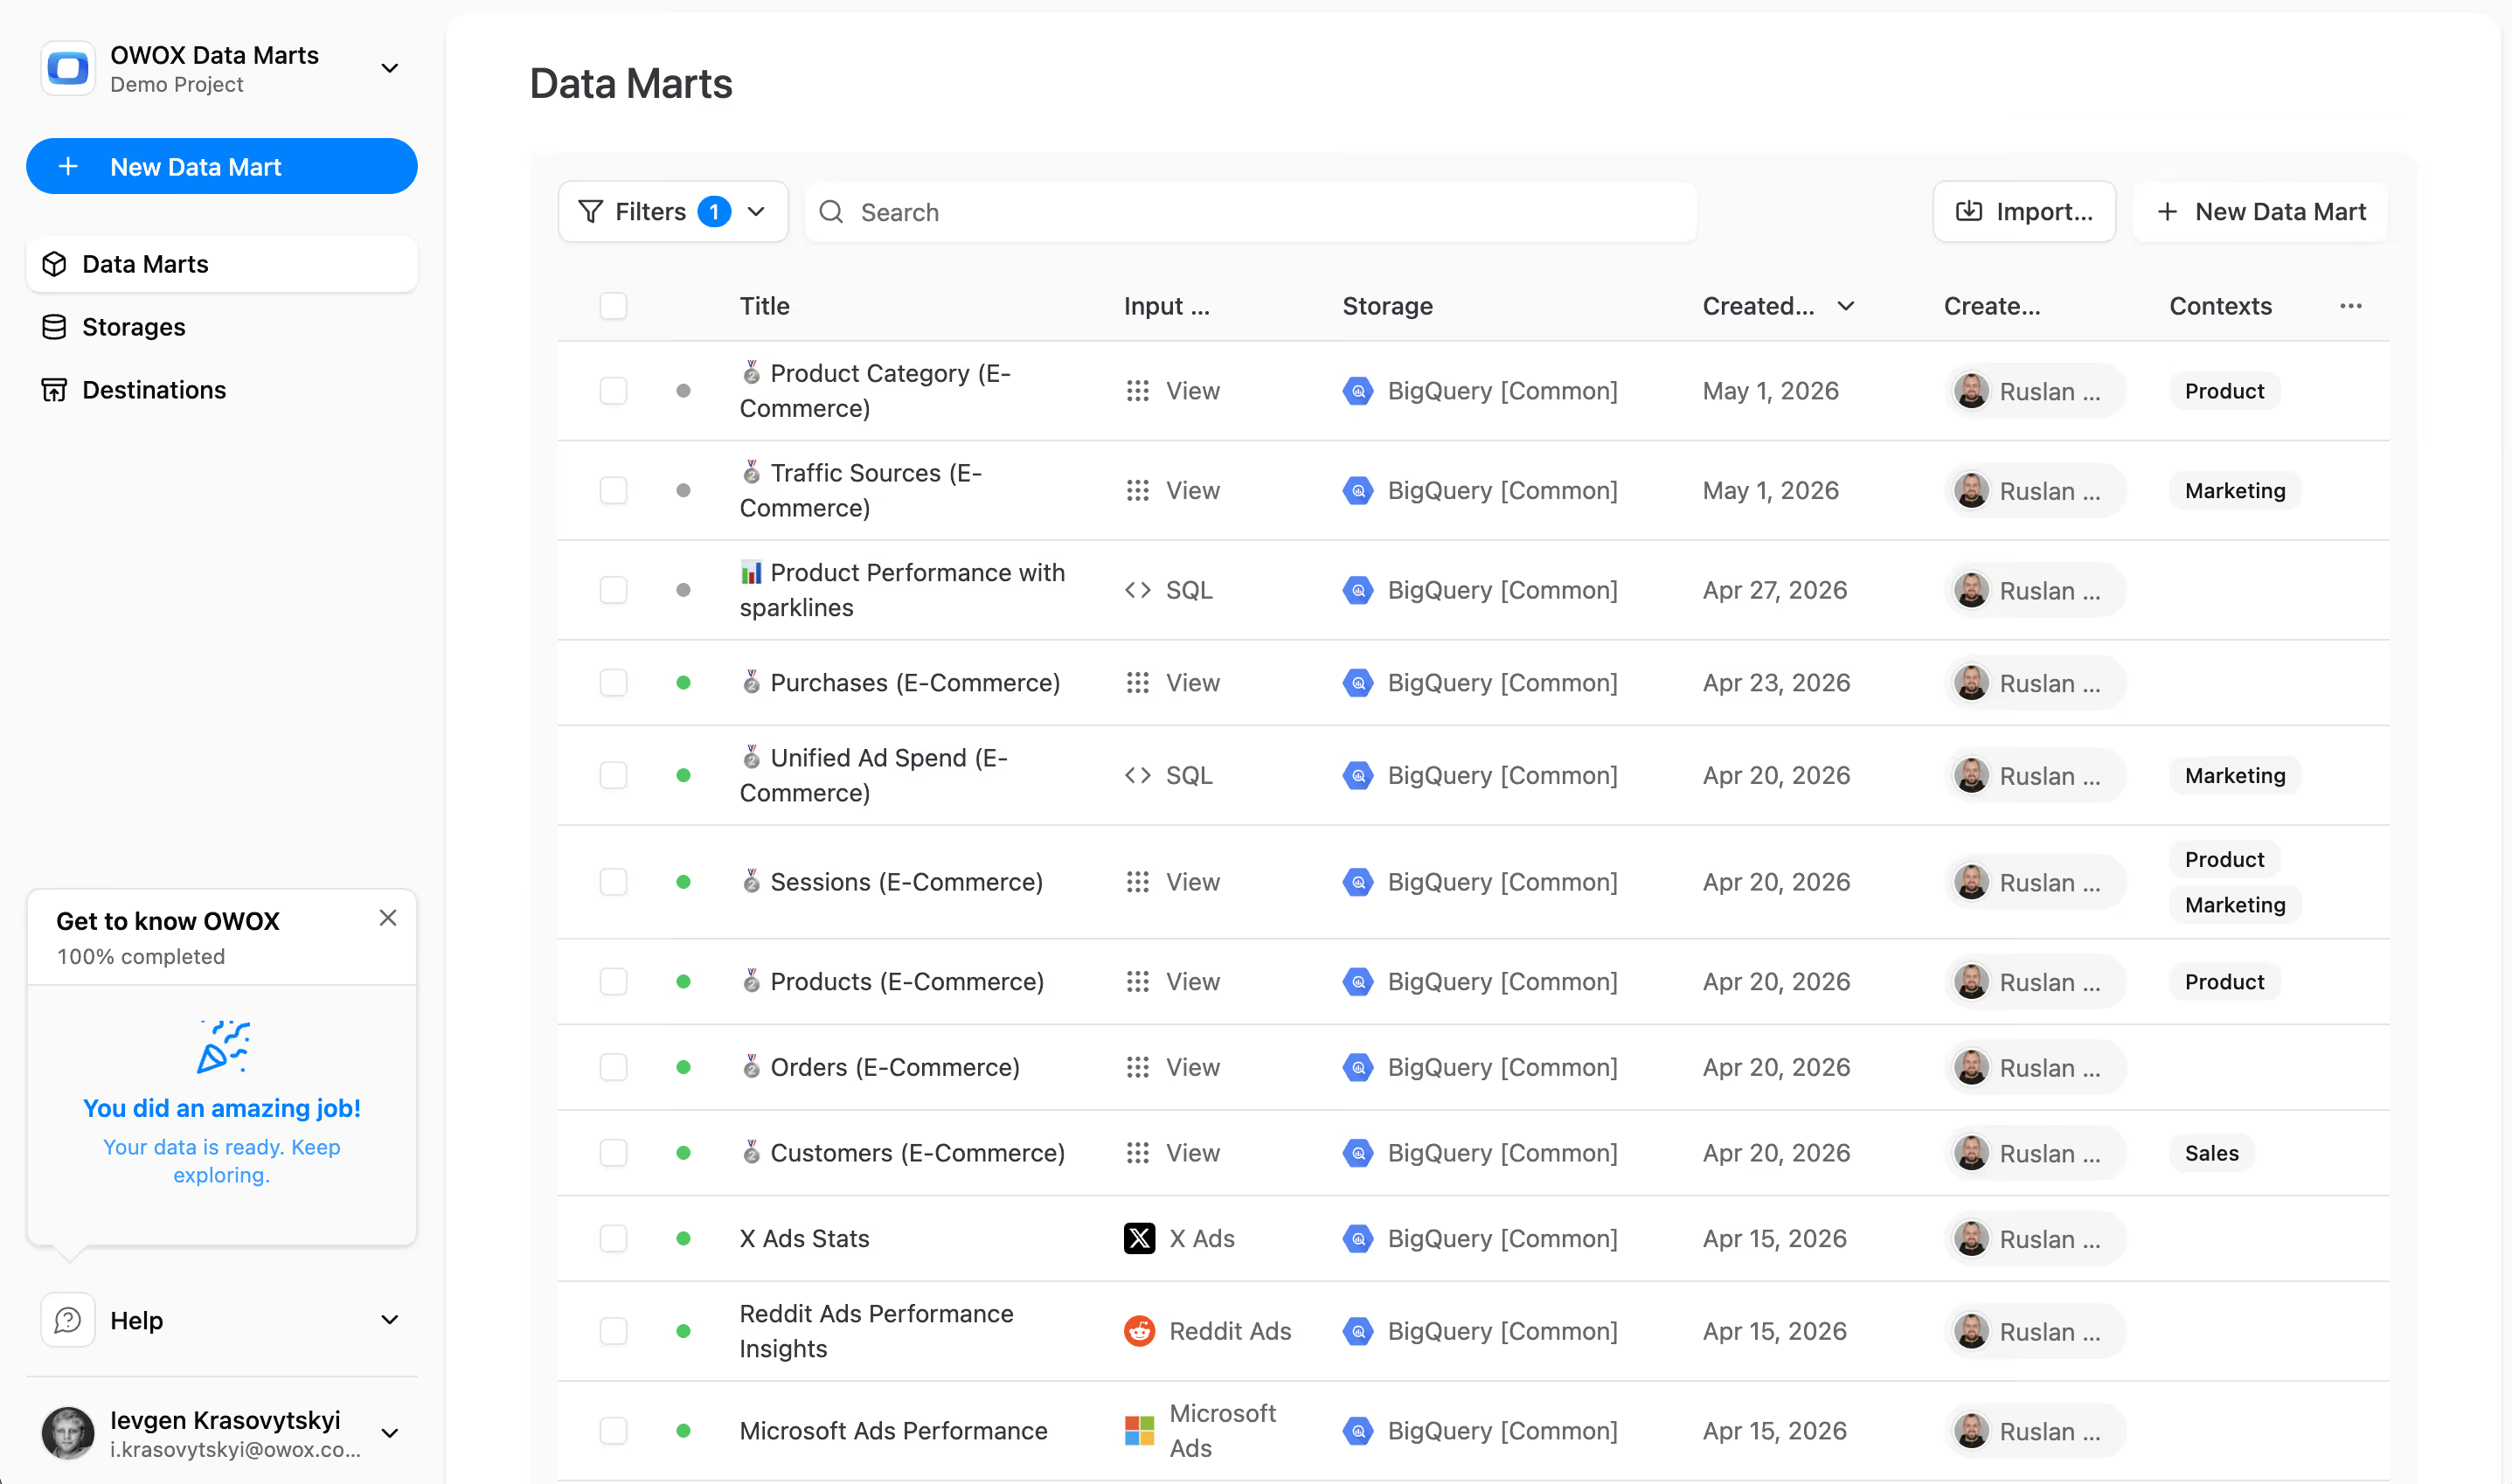
Create Consistent Standard Views with OWOX Data Marts
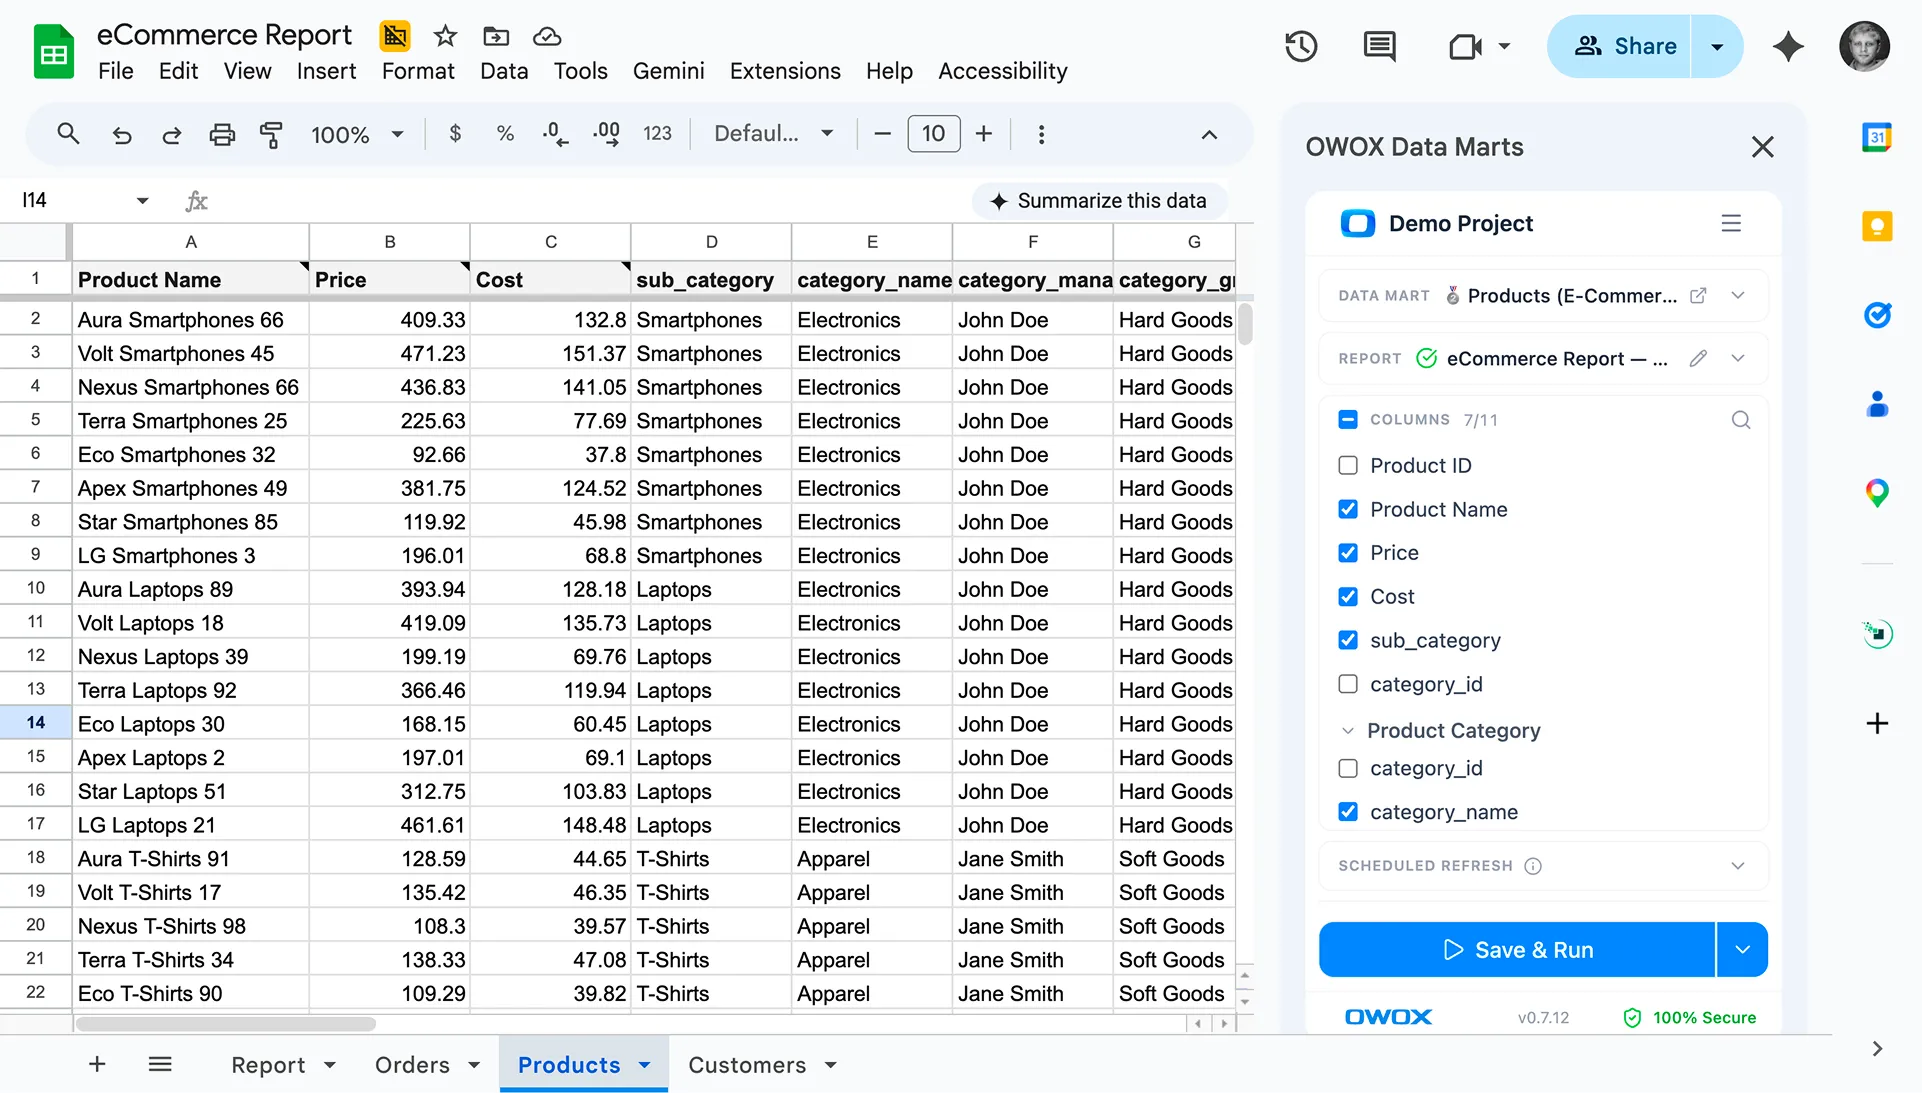
Maintaining reliable standard views across dashboards and teams can be difficult when data logic varies between tools. With OWOX Data Marts, you can define and manage standard views centrally, ensuring every metric, join, and filter is consistent across your reporting ecosystem. Analysts gain control and documentation, while business users access clear, trusted data every time.











"AI by its nature will hallucinate. You need guardrails so you can trust your data."
"We had six or seven different channels and no single source of truth. It was almost impossible"
"We regained time. And time is the one resource that never comes back."