Structure your data once, (re)-use it everywhere

Build reusable data marts that standardize your logic (or / and your SQL) and power dashboards in Sheets, Looker Studio, Excel, or enable automated AI Insights delivered to MS Teams, Slack, Google Chat or simply by Email.

app.owox.com/data-marts/data-marts
Build a library of reusable data marts
Trusted, proven, recognized

The analytics system teams actually use

170K+
Users trust OWOX[1]
Analysts, marketers, and data teams across 20+ industries
4.9★
Rating on G2[2]
“A trusted data analytics partner” — verified review
365K+
Data marts delivered
Created and served by OWOX to business users
79K
npm installs[3]
Self-hosted OWOX Community Edition on GitHub
One System, Two Superpowers

Build once, reuse everywhere

Data Mart Management gives analysts full control over the logic while giving business users instant, governed access to clean datasets across every reporting tool.

THE ANALYST

Own the logic, skip the tickets

Write SQL, re-use existing tables – keep the last mile of self-service analytics all in one place. Every data mart you build becomes a reusable asset the whole company can query safely.

Own the logic, skip the tickets
01Your SQL, your rules — packaged for the entire organization.
THE BUSINESS USER

Clean data, zero setup

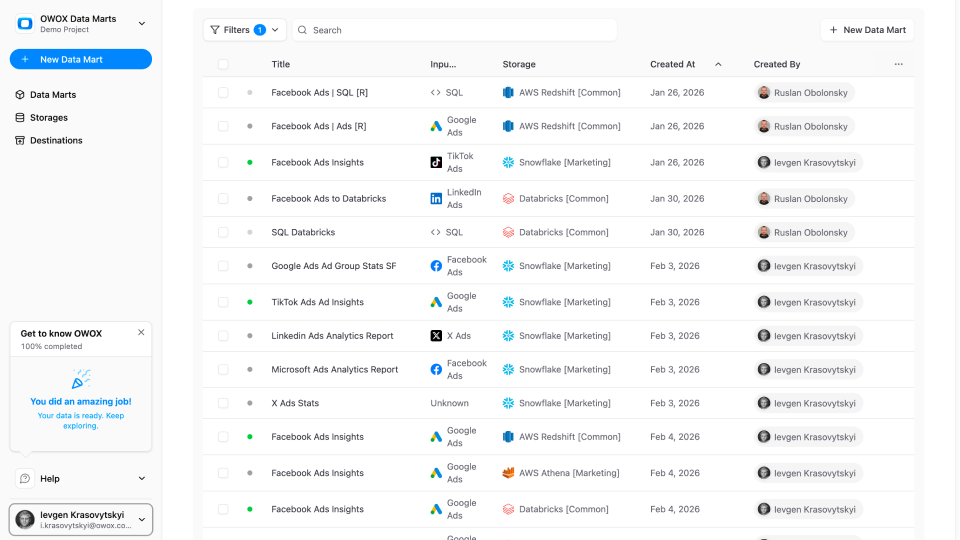
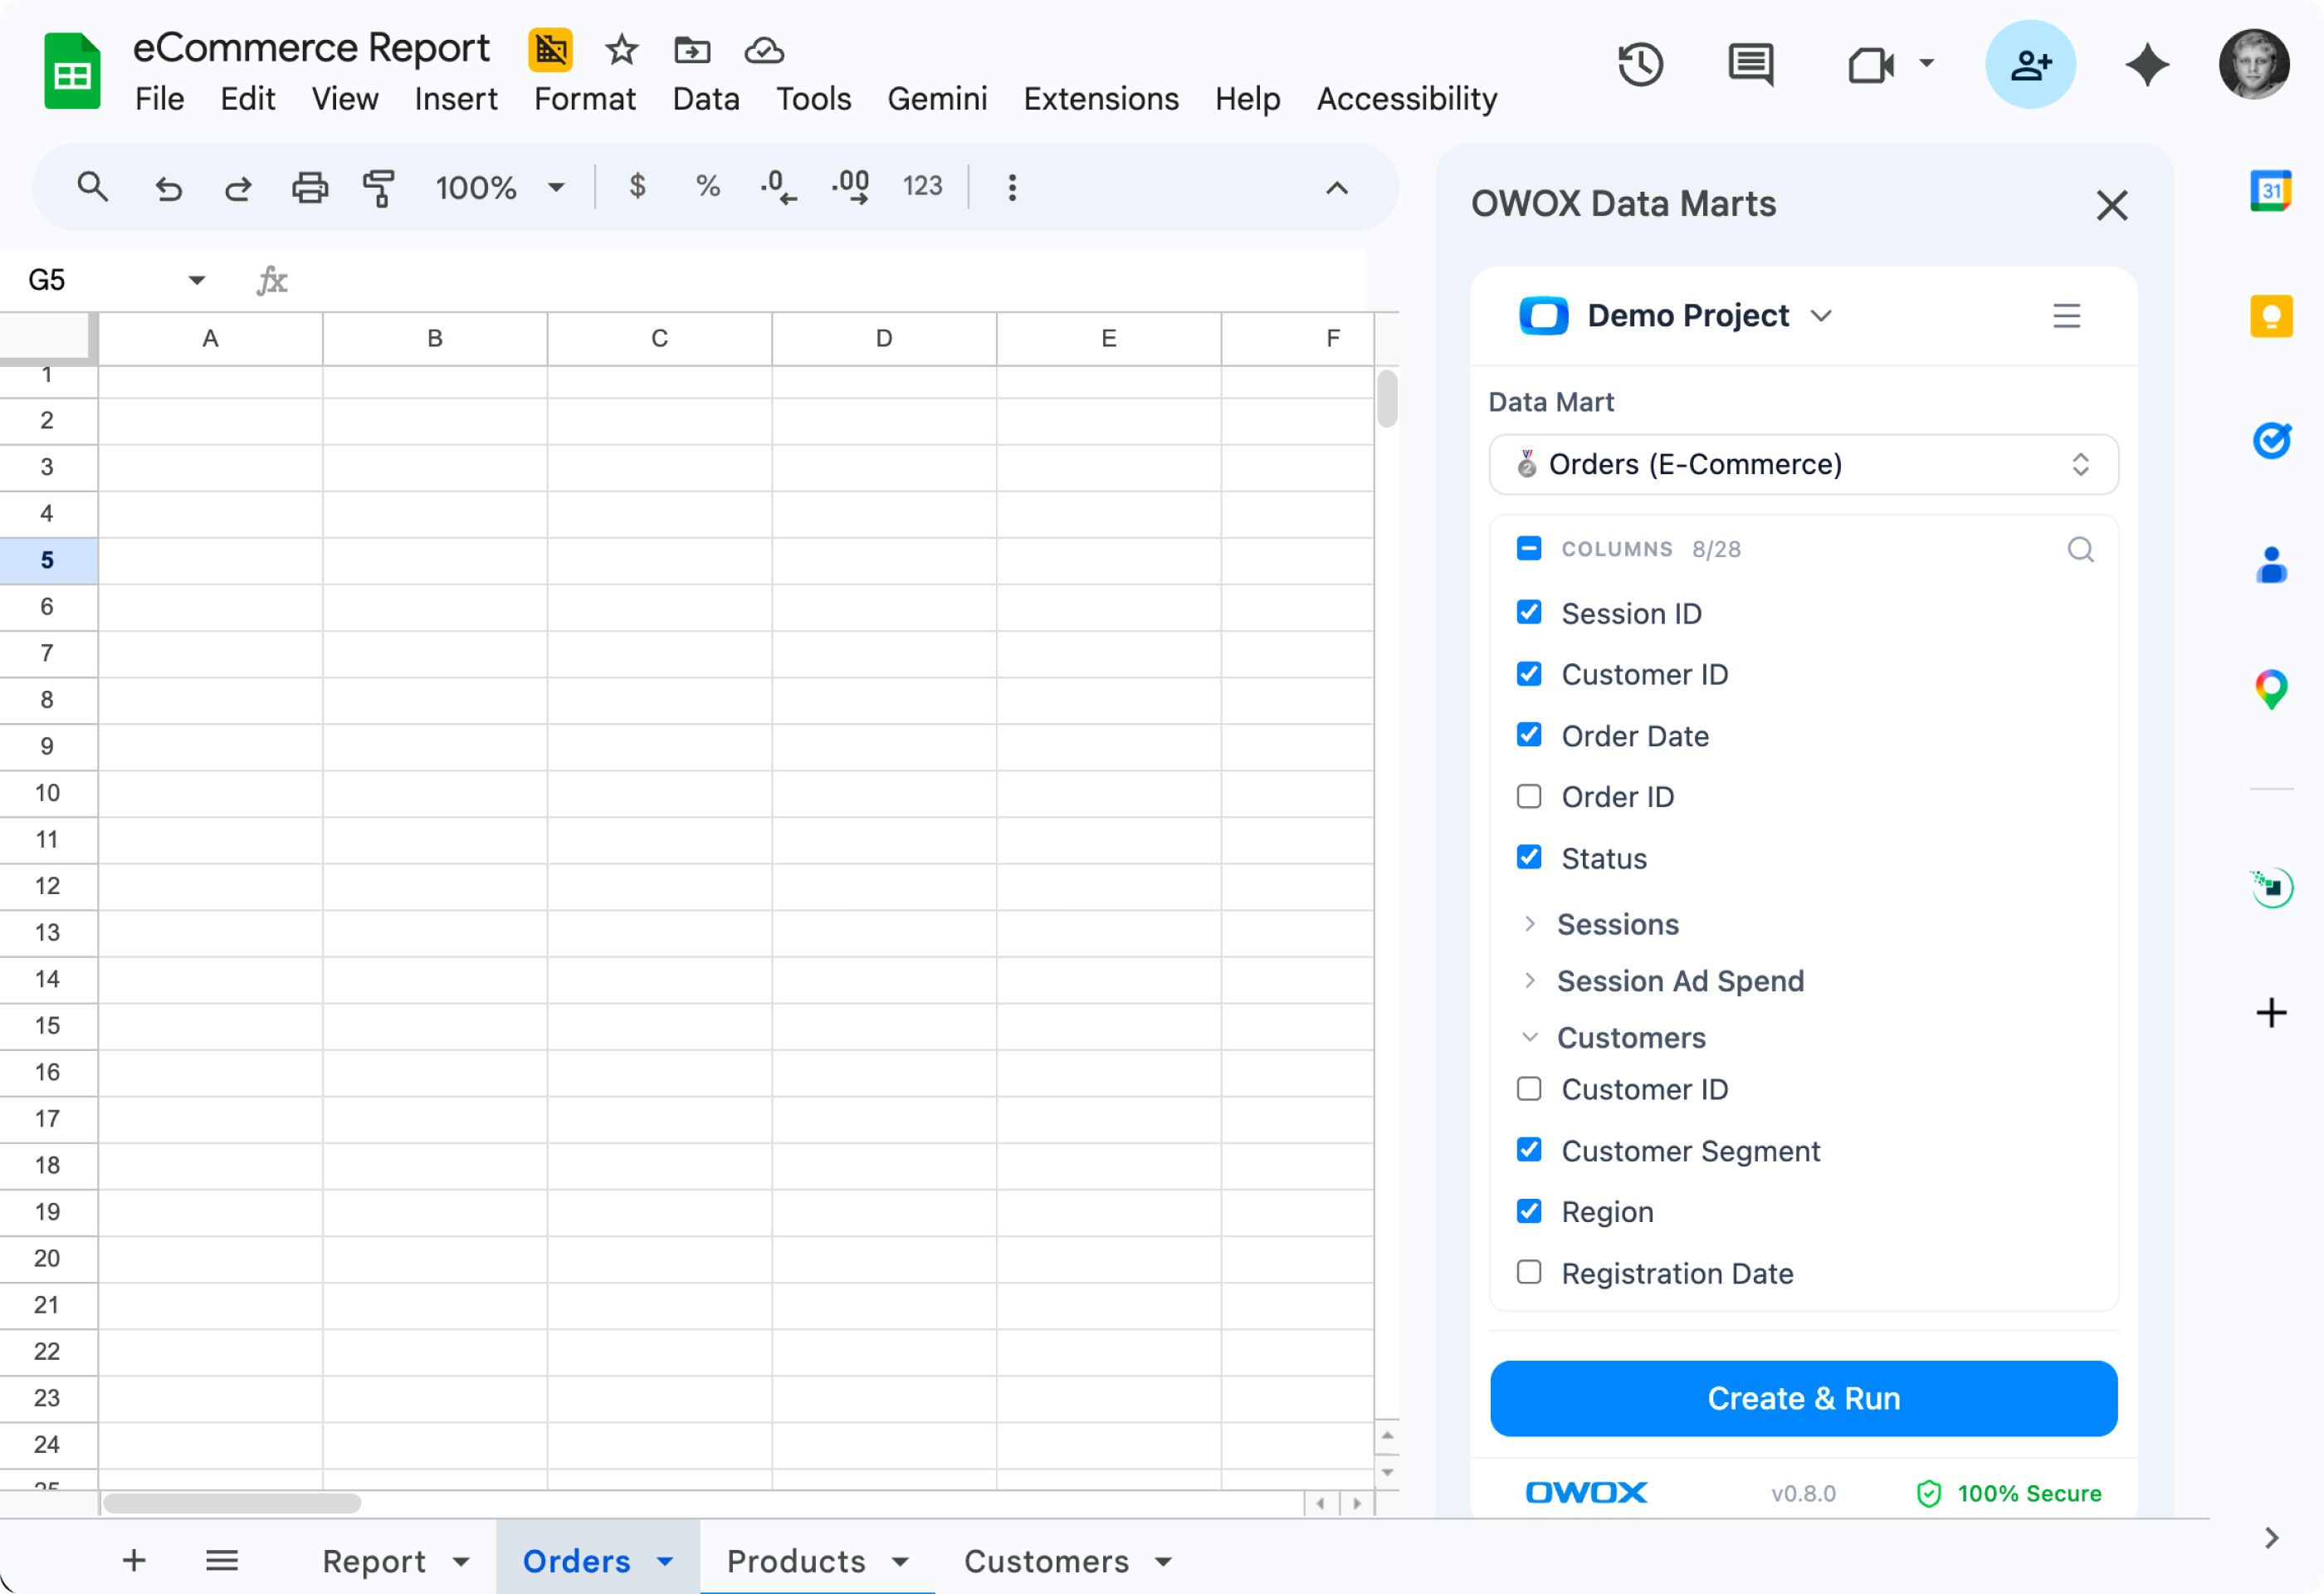
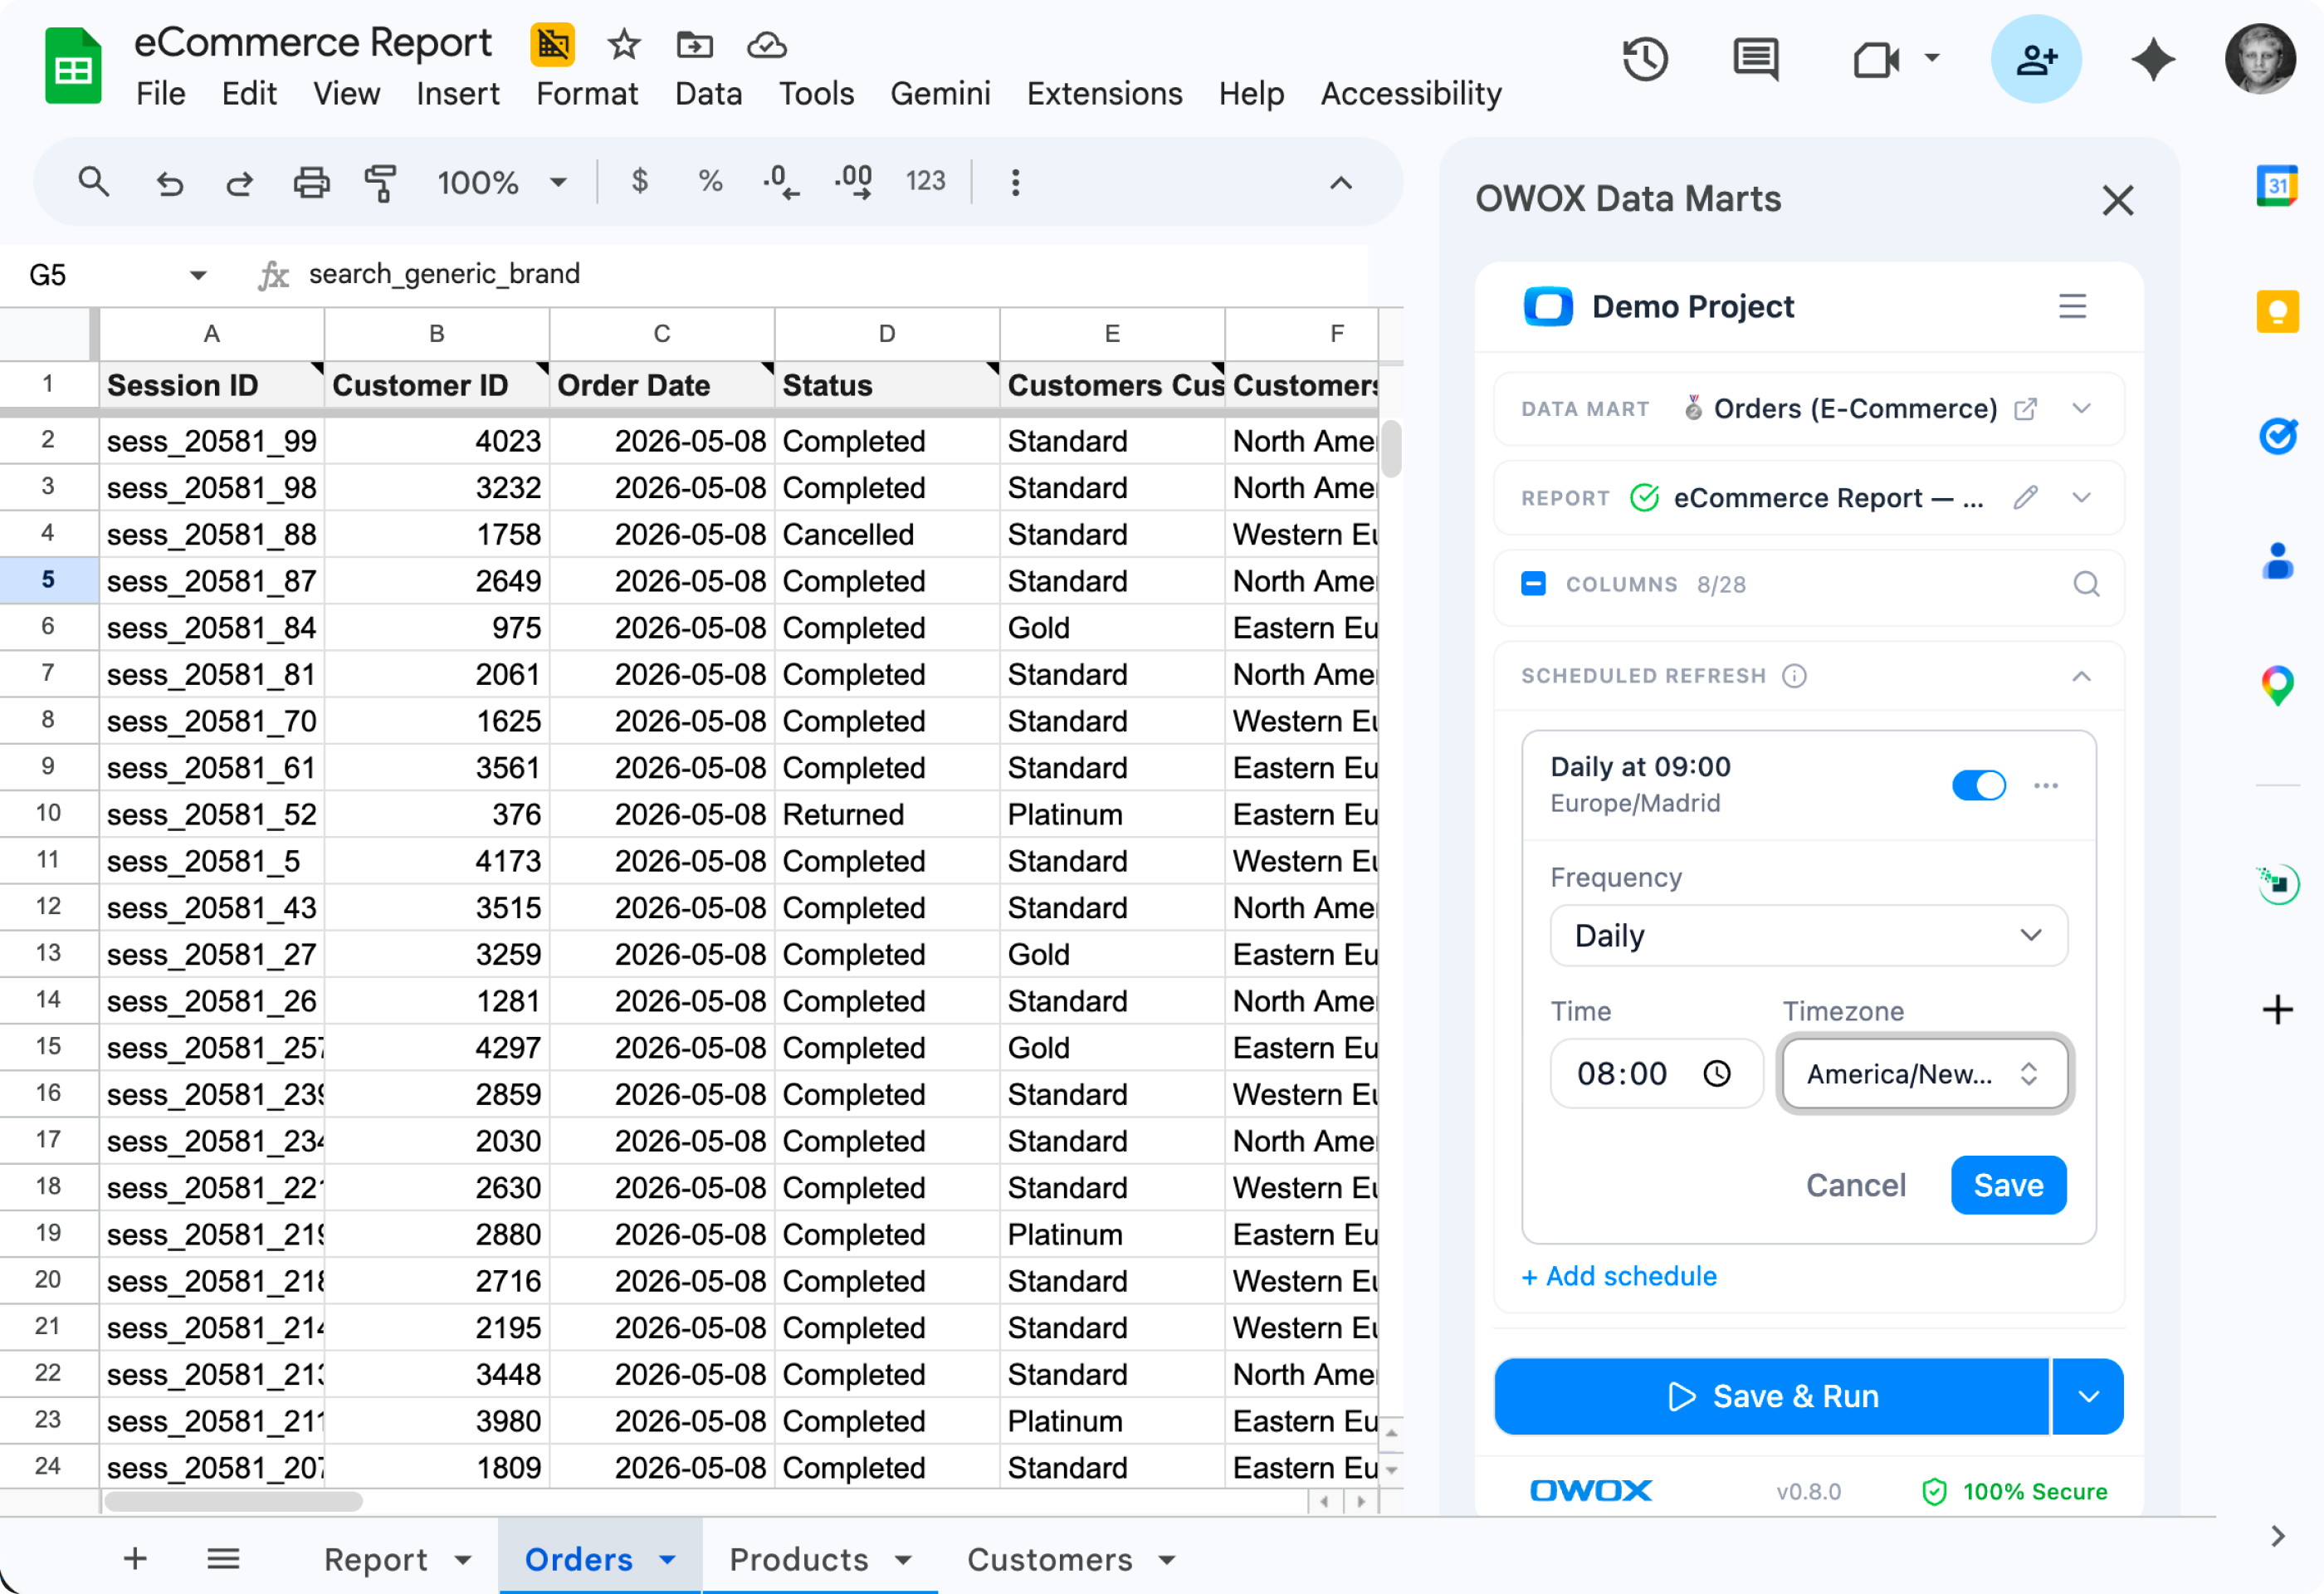
Browse a catalog of ready-to-use datasets. Pull them into Google Sheets, Looker Studio, or the AI assistant — no need to understand joins, filters, or warehouse schemas.

Clean data, zero setup
02Think of data marts as 'playlists' — curated by analysts, enjoyed by everyone.
The single source of truth your team has been asking for
When analysts build once and business users consume everywhere, you eliminate 80% of redundant data requests.
For Data Teams

Build reusable analytics assets

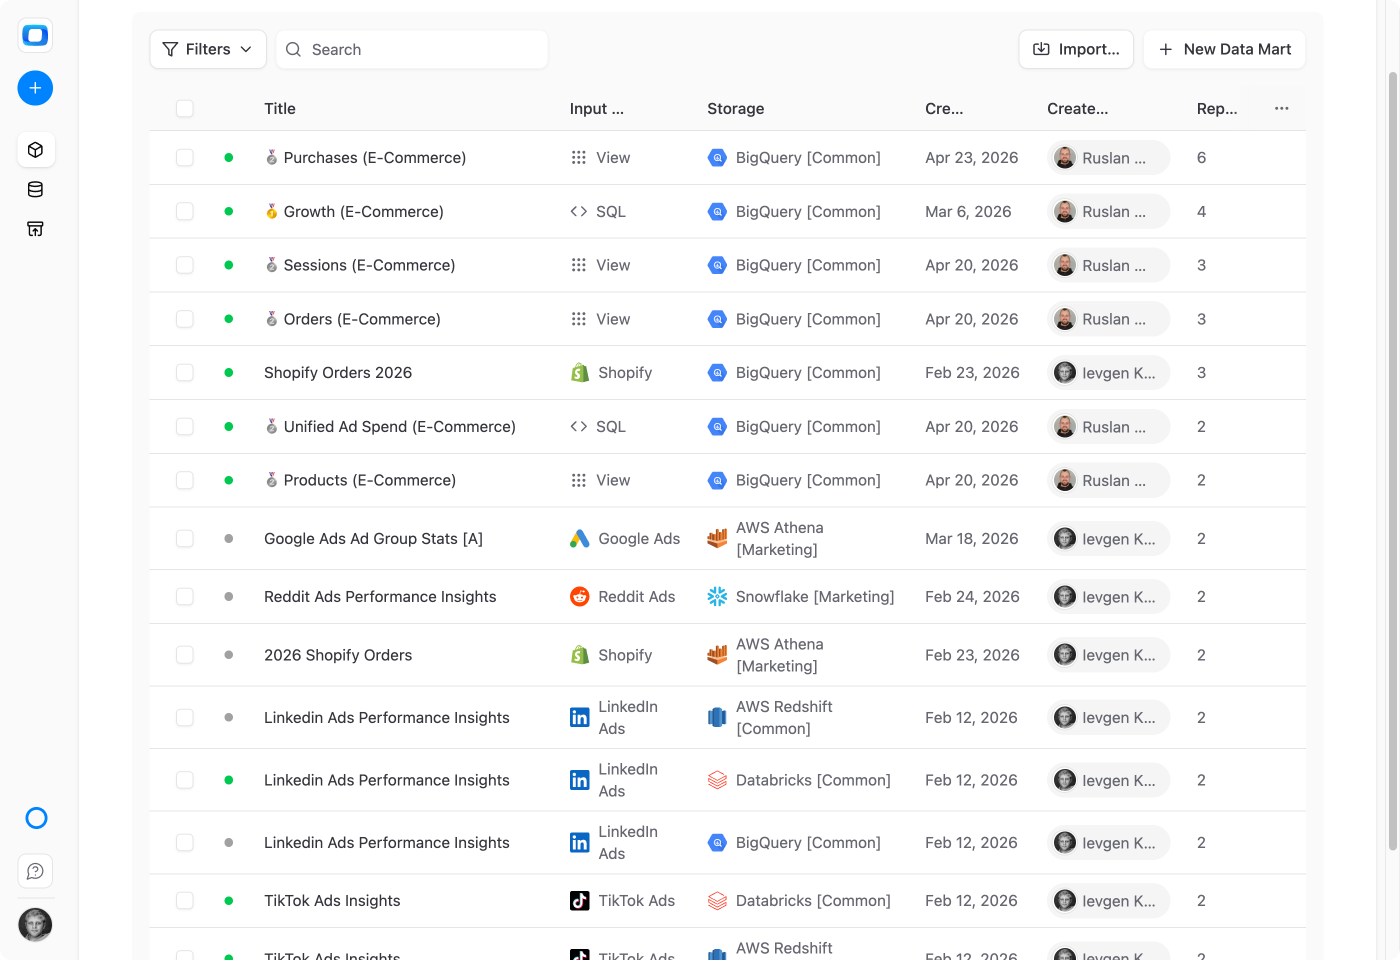
Write SQL, define transformations, version your work — every data mart becomes a governed asset the whole company can query.

Build a Data Mart from anything you already have

Start from a SQL query, a warehouse table, a view, a Pattern, or a connector's output. Whatever data is available, OWOX turns it into a governed, reusable asset.

Start from a SQL query, a warehouse table, a view, a Pattern, or a connector's output. Whatever data is available, OWOX turns it into a governed, reusable asset.

Clean output schemas — aliases, descriptions, metadata

Rename fields, add descriptions, set business-friendly aliases on top of warehouse columns. Consumers see clean, documented data — not your raw column names.

Rename fields, add descriptions, set business-friendly aliases on top of warehouse columns. Consumers see clean, documented data — not your raw column names.

Governance built in — who sees what, who edits what

Control availability per Data Mart: who can use it for reporting, who can edit it, which contexts it belongs to. The data team stays in charge of every governed asset.

Control availability per Data Mart: who can use it for reporting, who can edit it, which contexts it belongs to. The data team stays in charge of every governed asset.
Start from a SQL query, a warehouse table, a view, a Pattern, or a connector's output. Whatever data is available, OWOX turns it into a governed, reusable asset.
Rename fields, add descriptions, set business-friendly aliases on top of warehouse columns. Consumers see clean, documented data — not your raw column names.
Control availability per Data Mart: who can use it for reporting, who can edit it, which contexts it belongs to. The data team stays in charge of every governed asset.
For Business Teams

Access clean data instantly

Browse ready-to-use datasets and pull them into Sheets, Looker Studio, or the AI assistant — no SQL required.

Your context, your data — automatically

Marketing sees marketing data, sales sees sales data. Each team's context surfaces the Data Marts that matter to them — no clutter, no hunting through someone else's reports.

Marketing sees marketing data, sales sees sales data. Each team's context surfaces the Data Marts that matter to them — no clutter, no hunting through someone else's reports.

Joinable Data Marts, right inside Google Sheets

Pull two Data Marts into a Sheet and join them as if they were one. Blend orders with products or with sessions without writing SQL – the data team already wired the relationships.

Pull two Data Marts into a Sheet and join them as if they were one. Blend orders with products or with sessions without writing SQL – the data team already wired the relationships.

Self-serve inside a trusted perimeter

Explore freely – every Data Mart you can access has been governed by your data team. No bad joins, no wrong filters, no stale logic. Trust the numbers, every time.

Explore freely – every Data Mart you can access has been governed by your data team. No bad joins, no wrong filters, no stale logic. Trust the numbers, every time.
Marketing sees marketing data, sales sees sales data. Each team's context surfaces the Data Marts that matter to them — no clutter, no hunting through someone else's reports.
Pull two Data Marts into a Sheet and join them as if they were one. Blend orders with products or with sessions without writing SQL – the data team already wired the relationships.
Explore freely – every Data Mart you can access has been governed by your data team. No bad joins, no wrong filters, no stale logic. Trust the numbers, every time.
step-by-step

How our data collection works?

Step 1: Add Your Data Storage

Decide where do you want your data to be stored - any data warehouse

Step 2: Select data source

Choose your app, give necessary permissions to account.

Step 3: Configure the fields

Select the fields your want to import. You can get the fields available in the API.

Step 4: Run & get your data

You're ready to go. Run connectors & set update frequency.

Step 5: Connect more sources

You don't want single-source reports, right? Collect more data!

Step 6: Configure Data Marts

Build a collection of data marts: SQL, tables, views or connectors.

Step 7: Connect BI Tools & more

Select a data destination: Sheets, Looker Studio, Email or Chat tools.

Step 8: Run AI Insights

Get focused on data insights, set delivery and forget about routine.

Editions

Included in all editions at no extra cost

The easiest to get started

Starter

OWOX Cloud

Try before you scale

Starter

$30/mo — no credit card required

For data professionals & teams starting to automate reporting

Create data marts from your DWH
Create data marts from external sources (Meta, Google, TikTok Ads...)
Sync data marts to Spreadsheets and Looker Studio
Automate data refreshes
15 credits / mo included
Get Started Free

MOST POPULAR

Team

OWOX Cloud

Best for teams

Team

Starts at $875/mo + $35/seat (5 seats included)

For small and mid-size teams looking to automate collaborative reporting & get AI insights

Everything in Starter, plus:
Automate AI Insights to Email, Google Chat, Microsoft Teams, or Slack
Share credits across seats
500 credits / mo included
Set up data marts in Multiple Projects
Talk to Sales

Most flexible & free

Community

Self-Managed

Self-managed, full control

Community

Forever free

For teams automating reporting in Corporate DWH while valuing data autonomy: gaining full control over data connectivity and enablement

Create data marts from your DWH
Create data marts from external sources (Meta, Google, TikTok Ads & more)
Enable data marts in Google Sheets, Looker Studio, and Excel
Automate data refreshes
No credentials sharing
Get started
Why teams pick OWOX

Everything business needs

Outcomes your company gets the moment your data marts go live.

Governed metric definitions

Centralize metric logic in one place, so everyone works from the same definitions, without rewriting SQL.

Metrics you can trust

Define KPIs once and reuse them everywhere – across Looker, Sheets, Excel, and dashboards – with full control over changes.

Define once, reuse everywhere

Write your KPI logic once, then apply it across reports, dashboards, and clients – no duplication, no rework.

Data you trust

Explore only verified, fresh, and complete data. Say goodbye to guesswork and second-guessing.

Social proof

Every claim has a receipt.

Stats with comment threads attached — like a colleague verifying your numbers in a shared sheet.

170,000
Users on OWOX Platform — and growing 40% year-over-year.
B2
cell "users on platform"
SM
Sarah M.
Head of Analytics, Retail
3d ago

We migrated 200+ reports from Looker to OWOX Data Marts. Our team now self-serves without filing a single Jira ticket. Easily the best infrastructure decision we made this year.

✓ Verified
12 min
Median time-to-first-report for new OWOX users. No onboarding calls required.
C4
cell "time to first report"
DL
David L.
Data Lead, SaaS
Sarah M.

Connected BigQuery, set up 37 data marts, built a data model and had live reports in Sheets in under 15 minutes. My team thought I was joking when I showed them how they can now get live reports right in their sheets.

✓ Verified
FAQ

Frequently asked questions

What is a data mart in OWOX?
+
How do data marts differ from raw database tables?
+
Can I version and manage changes to data marts?
+
What outputs can data marts power?
+
Is this included in the free tier?
+
Do I need SQL skills to create data marts?
+

Ready to structure your data?

Build reusable data marts once and power every report across your organization.