
Mapping the Churn Journey: Warning Signs in Product Data
Uncover early churn signals in product behavior, from low engagement to missed milestones, and act faster to retain at-risk users.


Losing customers isn’t a sudden event; it’s a slow fade. Most users show clear warning signs before they churn, but teams often miss them until it’s too late. They log in less often, stop using important features, or take longer to reply. These small signs of disengagement are easy to overlook but offer a valuable chance to act early and prevent churn.
By learning to spot these signals in your product data, you can step in before users walk away. This article will guide you through mapping the churn journey and show how OWOX BI can help automate churn detection.
Understanding Churn Analytics
Churn analytics helps you understand why customers stop using your product. It looks at data to find patterns and reasons behind users leaving. By spotting these reasons early, you get a chance to fix issues before more customers churn. This way, businesses can reduce losses and keep more users happy.
The main goal is to figure out what’s causing churn and take action to prevent it. When done well, churn analytics helps improve customer loyalty. It gives teams the insights they need to build better user experiences. Simple data, used smartly, can make a big difference.
Why Tracking Churn Analytics Matters for SaaS Teams
Tracking churn analytics helps SaaS teams reduce customer losses and grow sustainably. It reveals why users leave and guides smarter retention efforts. In this section, we’ll cover key reasons why churn analytics matters and how it supports better business decisions.
Predict Churn with Actionable Insights
Churn analytics helps SaaS teams identify early warning signs that a customer might leave. By analyzing product usage and engagement patterns, teams can spot dissatisfaction before it becomes a bigger issue. These insights allow you to take timely actions, like targeted outreach or feature improvements, to re-engage users, reduce churn, and protect your recurring revenue.
Personalize Retention by Segment
Not every customer leaves for the same reasons. Churn analytics helps you break down your audience into meaningful segments based on usage, behavior, or needs. This lets you create tailored retention strategies for each group. Whether it's custom emails, special offers, or personal support, segment-based actions keep customers engaged and reduce overall churn.
Boost Customer Lifetime Value
Retaining existing customers is often more valuable than acquiring new ones. Churn analytics helps you understand why users leave and what can be done to improve their experience. By addressing these pain points, you can encourage customers to stay longer, spend more, and become loyal advocates, boosting their overall lifetime value to your business.
Allocate Resources More Effectively
With limited time and resources, SaaS teams need to focus on what matters most. Churn analytics highlights which customers are at risk and where interventions are needed. This ensures teams can prioritize efforts, avoid wasting resources, and maximize the impact of retention strategies. Smarter allocation leads to more efficient growth and better customer outcomes.
Drive Growth Through Retention Stability
A business with stable retention can grow faster and more confidently. When churn is reduced, revenue becomes more predictable, giving teams the freedom to invest in innovation, expand to new markets, or improve existing products. Churn analytics supports this stability by continuously monitoring user behavior and helping you keep customers satisfied for the long term.
Churn Doesn't Happen Overnight: Recognizing Early Behavioral Signals
Churn doesn’t happen all at once. Customers show early behavioral signals before they leave, like reduced activity or skipped features. Here, we’ll cover the key warning signs SaaS teams should watch for to spot churn early and act on time.
Decreased Product Engagement
When users log in less frequently or stop using core features, it shows the product is losing relevance for them. This is often the first sign they’re not getting ongoing value. If ignored, disengagement gradually leads to churn.
By tracking drops in activity early, teams can reach out, understand the cause, and take steps to re-engage users before they completely walk away.
Repeated Support Complaints
Constant support tickets, unresolved issues, or negative feedback reflect growing customer frustration. Poor support experiences create dissatisfaction, making users more likely to leave. Monitoring these complaints helps SaaS teams identify unhappy users early.
Responding quickly with better solutions, clear communication, and personal attention can rebuild trust and prevent churn from escalating.
Shifting Strategic Priorities
Customers’ business needs often change over time. They may shift focus to new markets, adopt different technologies, or adjust budgets. When this happens, your product might no longer match their priorities. If unnoticed, churn becomes inevitable. Regular check-ins help you stay aligned and adjust your offering.
Proactively suggesting new use cases ensures your product remains valuable as their goals evolve, keeping the relationship strong and reducing churn risk.
Payment Disruptions
Missed payments, failed transactions, or subscription downgrades are signs of decreasing commitment. These disruptions often indicate financial concerns or reduced perceived value. Tracking payment issues allows SaaS teams to identify at-risk users early.
Offering flexible payment options, reminders, or special support during this stage can help retain users before they decide to leave.
Hesitation Around Renewals
When customers delay renewals or push for steep discounts, it’s a sign they’re questioning your product’s value. This hesitation often means they’re exploring other options. Teams must act fast with personalized support and clear value demonstrations.
Showing how your product solves their current challenges helps rebuild trust. Addressing objections early can secure their renewal and prevent last-minute churn decisions that hurt business growth.
Competitive Behavior
If users start following competitors, unsubscribing from your emails, or attending rival demos, it’s a clear churn signal. These actions reflect declining interest or dissatisfaction. Identifying this behavior early gives you a chance to re-engage.
Highlighting your product’s unique advantages and addressing their concerns can bring them back. Competitor tracking is key to understanding why users might switch and how to retain them.
Declining Communication
When customers stop responding to emails or skip meetings, it’s a clear sign of disengagement. This silence often means your product is no longer a priority for them. Ignoring it can result in churn. Teams should monitor communication gaps and follow up with personal outreach.
Re-engaging through helpful resources or casual check-ins can reignite interest and revive the relationship before it’s too late.
Feature Abandonment
When users stop using core features they once relied on, it signals a loss of value perception. They may face usability issues or have found alternatives. Tracking these drop-offs helps identify struggling users early. Providing targeted help, tutorials, or highlighting benefits can bring them back.
Feature usage trends are vital indicators of satisfaction and should guide proactive support to prevent churn.
Problem: SaaS Teams React Too Late to Customer Churn
Many SaaS teams react to churn only after it’s too late, focusing on cancellations and lost revenue. To fix this, it’s important to act earlier. Here, we’ll cover the main reasons why teams struggle to detect churn signals on time.
Rely Too Heavily on Lagging Metrics
Most SaaS teams notice churn only after cancellations, revenue drops, or missed renewals. These are lagging indicators that appear too late. By the time these numbers surface, the customer has already decided to leave. Teams need to focus on earlier behavioral signals to act in time and prevent churn before it happens.
Lack of Visibility Into Product Behavior
Many teams lack access to detailed product usage data. Without this visibility, they can’t see when users stop logging in, skip features, or reduce activity. These early signs of disengagement often go unnoticed. Without the right tools to track this behavior, churn risks stay hidden until it’s too late.
Dashboards Don’t Show Risk in Real Time
Traditional dashboards show past performance, not current risks. They reflect what happened last week or last month, not what’s happening now. This reporting delay makes it hard for teams to spot churn early. Real-time insights are essential for identifying at-risk users while there’s still time to take action.
Product and CS Teams Depend on Analysts
Product managers and customer success teams often rely on analysts to pull churn reports. This dependency slows down responses. Even when teams see warning signs, they can’t act fast without data support. Giving these teams self-serve access to churn insights is key to responding quickly and reducing churn.
Solution: Recognize Churn Using Product Data Before It's Too Late
The best way to reduce churn is to catch early signs of disengagement. By using product data, SaaS teams can spot users who are slipping away. Here, we’ll cover practical ways to recognize churn risks and take timely action.
Fix Drop-Offs in Account Setup Flows
Many users leave within minutes if the setup process is confusing or takes too long. Tracking where users drop off during onboarding helps identify these problem areas. If a large number of users exit at a specific step, simplify the process or offer clear guidance.
Fixing setup friction early is critical to activating more users. A smooth start encourages them to explore further and reduces early-stage churn significantly.
Track and Trigger Actions Based on Missed Core Steps
Users who sign up but skip important actions, like connecting data or creating a project, are unlikely to stay. Monitoring these missed steps helps teams flag at-risk users. Timely interventions like tooltips, nudges, or customer support outreach can guide them back on track.
The faster users experience value, the better their chances of staying. Early engagement through product data prevents silent churn from happening unnoticed.
Reduce Friction in Time-Consuming Tasks
When routine tasks take too long, users get frustrated and may leave. Tracking how much time users spend on specific actions helps spot bottlenecks. For example, if a report takes 15 minutes to generate, that’s a churn risk.
Improving user experience, simplifying workflows, or adding in-app help at these points can ease frustration. Addressing these friction points early can significantly lower churn rates and keep users productive.
Identify Early Drop-Offs After Initial Use
Some users log in once or twice, explore briefly, then vanish. Monitoring login frequency during the first 7–14 days is essential to catch this early drop-off. Setting up inactivity alerts helps teams step in quickly with emails or personal follow-ups.
Re-engaging users in this early window increases their chances of sticking around. Catching disengagement early is key to reducing churn and boosting user retention.
Data Points to Watch to Predict SaaS Churn Early
To reduce churn, SaaS teams need to track key product usage data. Certain patterns reveal when users are losing interest. Here, we’ll look at important data points that help spot churn risks early, giving teams time to act and retain customers.
Monitor Daily and Weekly Engagement Patterns
Tracking daily and weekly user activity helps SaaS teams spot early churn risks. A sudden drop in logins or feature usage often means users are losing interest or facing problems. By monitoring these engagement patterns, teams can act quickly with targeted follow-ups, support, or product tips.
Track Time-to-Value and Onboarding Milestones
Tracking time-to-value (TTV) shows how quickly users reach their first success with your product. A long TTV often leads to frustration and churn. By monitoring onboarding steps like setup completion or first project, teams can spot slow progress. Helping users achieve value faster with guided support improves satisfaction, reduces churn risk, and encourages long-term product use.
Detect Early Inactivity and Silence
When once-active users stop logging in or using your product, it’s a clear churn signal. Silence often means the product is no longer a priority or users are facing issues. Setting alerts for inactivity helps teams reach out before disengagement becomes final. Proactively re-engaging silent users through emails, calls, or helpful resources increases the chances of bringing them back and reducing churn.
SQL Example: Comparing Churned vs Retained User Behavior
To understand how user behavior impacts churn, you can compare engagement patterns between churned and retained users using product data. The SQL example below shows how to analyze login activity in BigQuery to identify early churn signals.
Example:
We want to compare login behavior between churned and retained users to analyze early churn signals.
We define:
- Retained users: Users who had some activity at least once in the past 100 days.
- Churned users: Users who had no activity in the past 100 days.
Using the user table (which holds user profiles) and the event table (which logs user activity), we'll:
- Count distinct login days per user
- Classify each user as churned or retained
- Calculate the average login days per user for both churned and retained groups
SQL Query:
1SELECT
2  CASE
3    WHEN last_event_date < DATE_SUB(CURRENT_DATE(), INTERVAL 100 DAY) OR last_event_date IS NULL THEN 'Churned'
4    ELSE 'Retained'
5  END AS user_status,
6  COUNT(user_id) AS total_users,
7  ROUND(AVG(event_days), 2) AS avg_event_days
8FROM (
9  SELECT
10    u.id AS user_id,
11    COUNT(DISTINCT DATE(e.timestamp)) AS event_days,
12    MAX(DATE(e.timestamp)) AS last_event_date
13  FROM `owox-d-ikrasovytskyi-001.Product_Data_Model_v1.user` u
14  LEFT JOIN `owox-d-ikrasovytskyi-001.Product_Data_Model_v1.event` e
15    ON u.id = e.user_id
16  GROUP BY u.id
17)
18GROUP BY user_status;
Output:

How to Build a Churn Watchlist with OWOX BI’s Product Data Model Template
Creating a churn watchlist helps SaaS teams track at-risk users easily. With OWOX BI’s product data model template, you can quickly identify disengaged users, monitor their behavior, and automate churn risk tracking. Here’s how to build and use this watchlist effectively.
Identify Users Showing Signs of Disengagement
Start by using the OWOX BI Product Analytics Data Model Template to pull key metrics like login frequency, feature usage, and onboarding completion. These important fields are already part of the template, so you don’t need to build reports from scratch.
By filtering users with low activity, you can quickly identify those who are disengaging. This forms the foundation of your churn watchlist, helping you track and manage churn risks early.
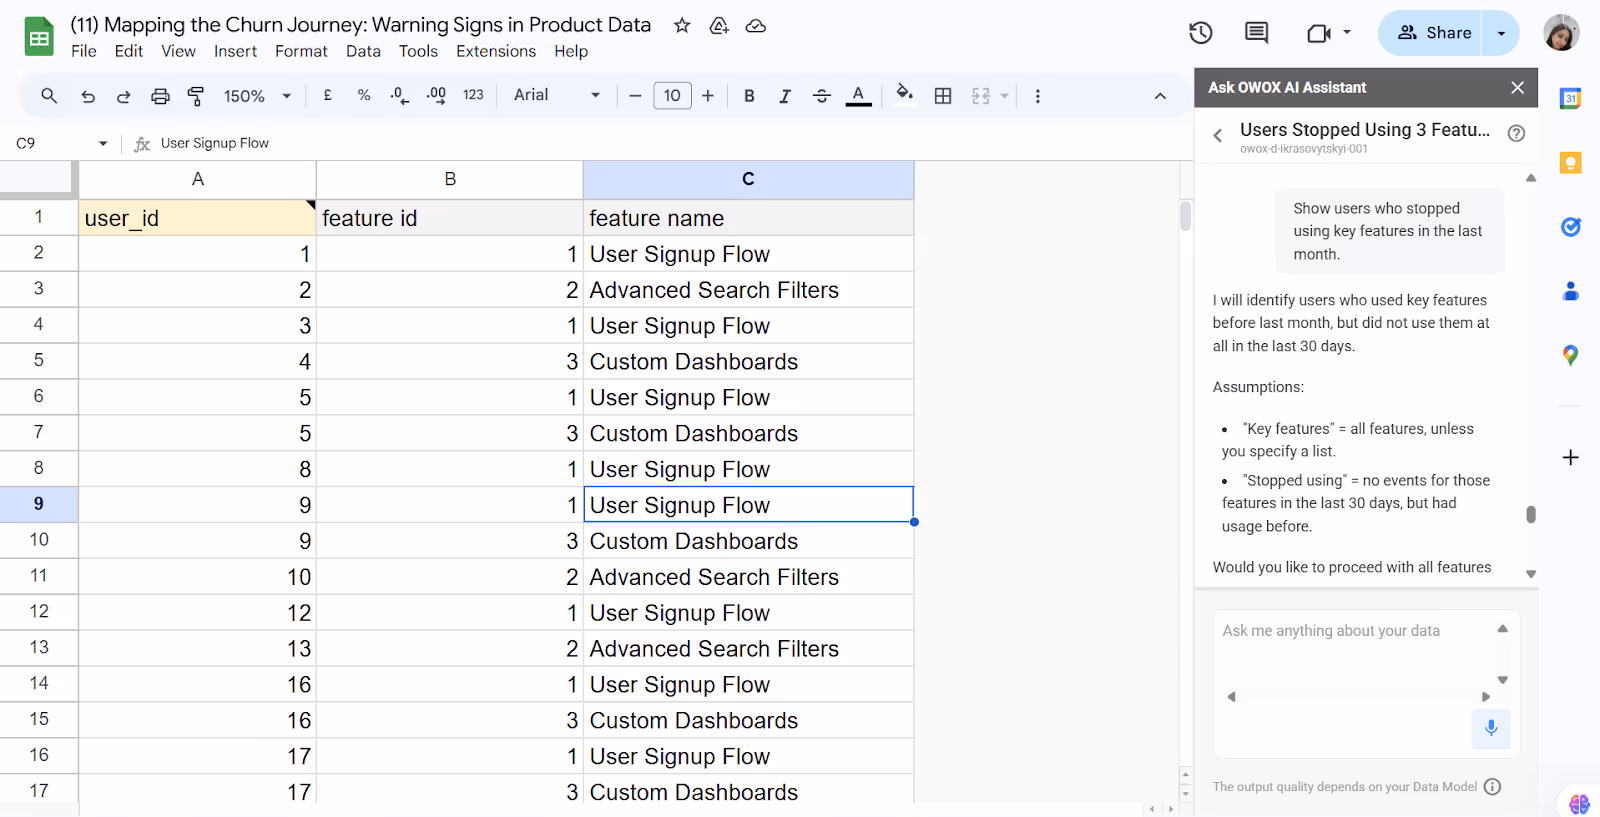
In OWOX Reports, you can ask: “Show users who stopped using key features in the last month.”
If you ask this question in OWOX AI Assistant, you'll likely be prompted with the following clarification:
To answer "Show users who stopped using key features in the last month," I will assume:
- "Key features" means features in the feature table.
- "Stopped using" means users who had events for a feature before last month, but not in the last month.
Once confirmed, the OWOX Reports AI Assistant will return a list of users who previously engaged with key features but stopped using them in the last calendar month.
Compare Churned and Retained User Behavior
Segment your past users into “churned” and “retained” groups using OWOX BI’s template. Analyze how often each group logged in, which features they used, and their overall product engagement. These patterns reveal common churn signals, allowing you to identify current users showing similar risky behaviors and add them to your churn watchlist for proactive follow-up.
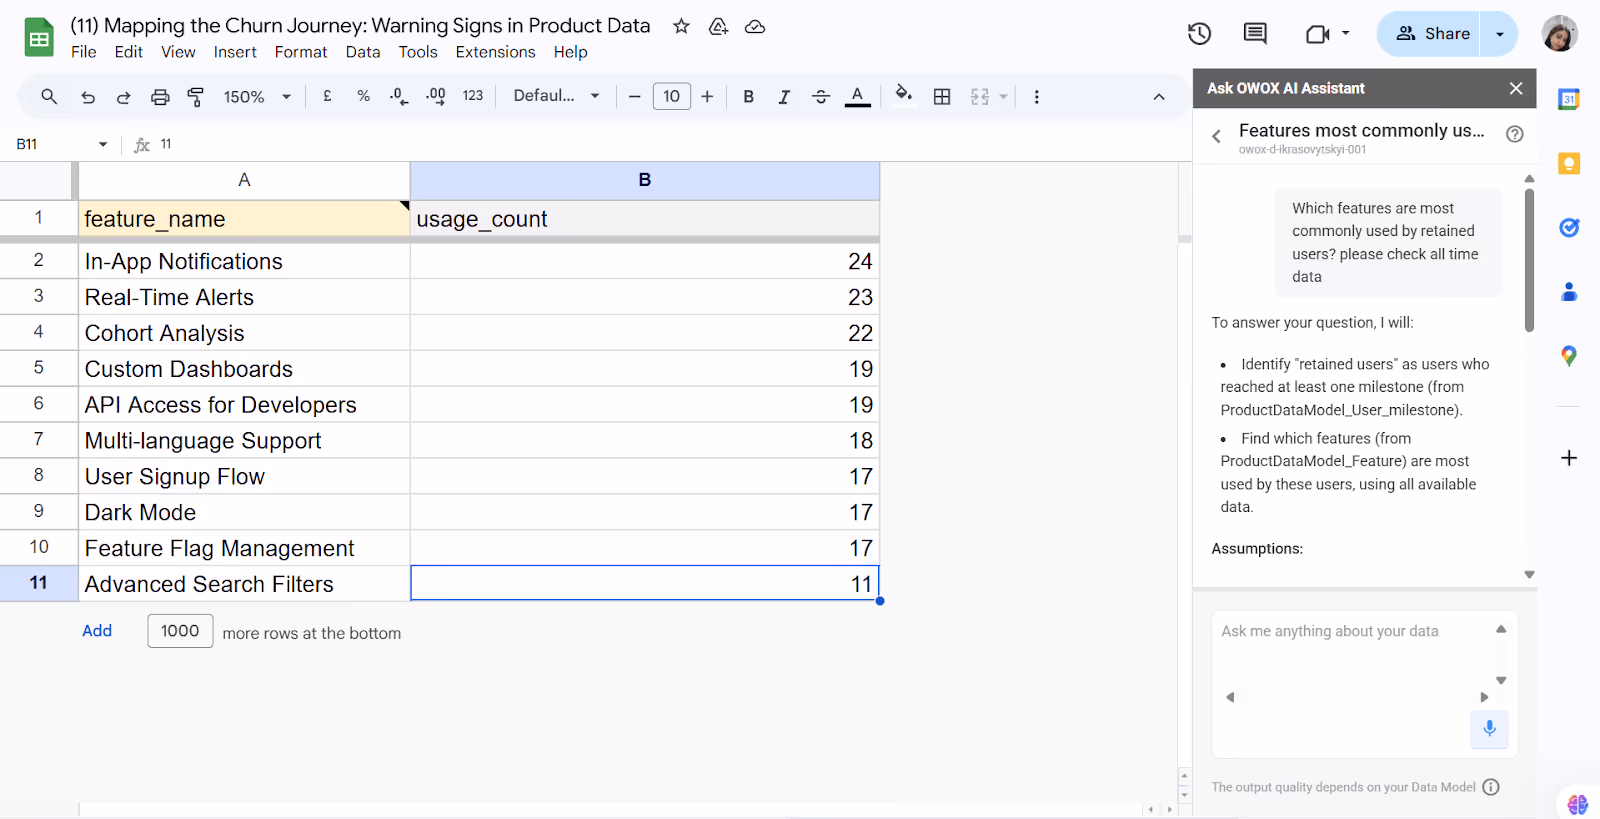
In OWOX Reports, you can ask: “Which features are most commonly used by retained users?”
If you ask this question in OWOX AI Assistant, you'll likely be prompted with the following clarification:
To answer "Which features are most commonly used by retained users?", I need to clarify:
- "Retained users" are defined as users with at least one milestone achieved.
- "Most commonly used features" refers to features with the highest number of associated events from these users.
- The analysis will be based on all available data (no time restriction).
Now for the second part, in a fresh New Google Sheet
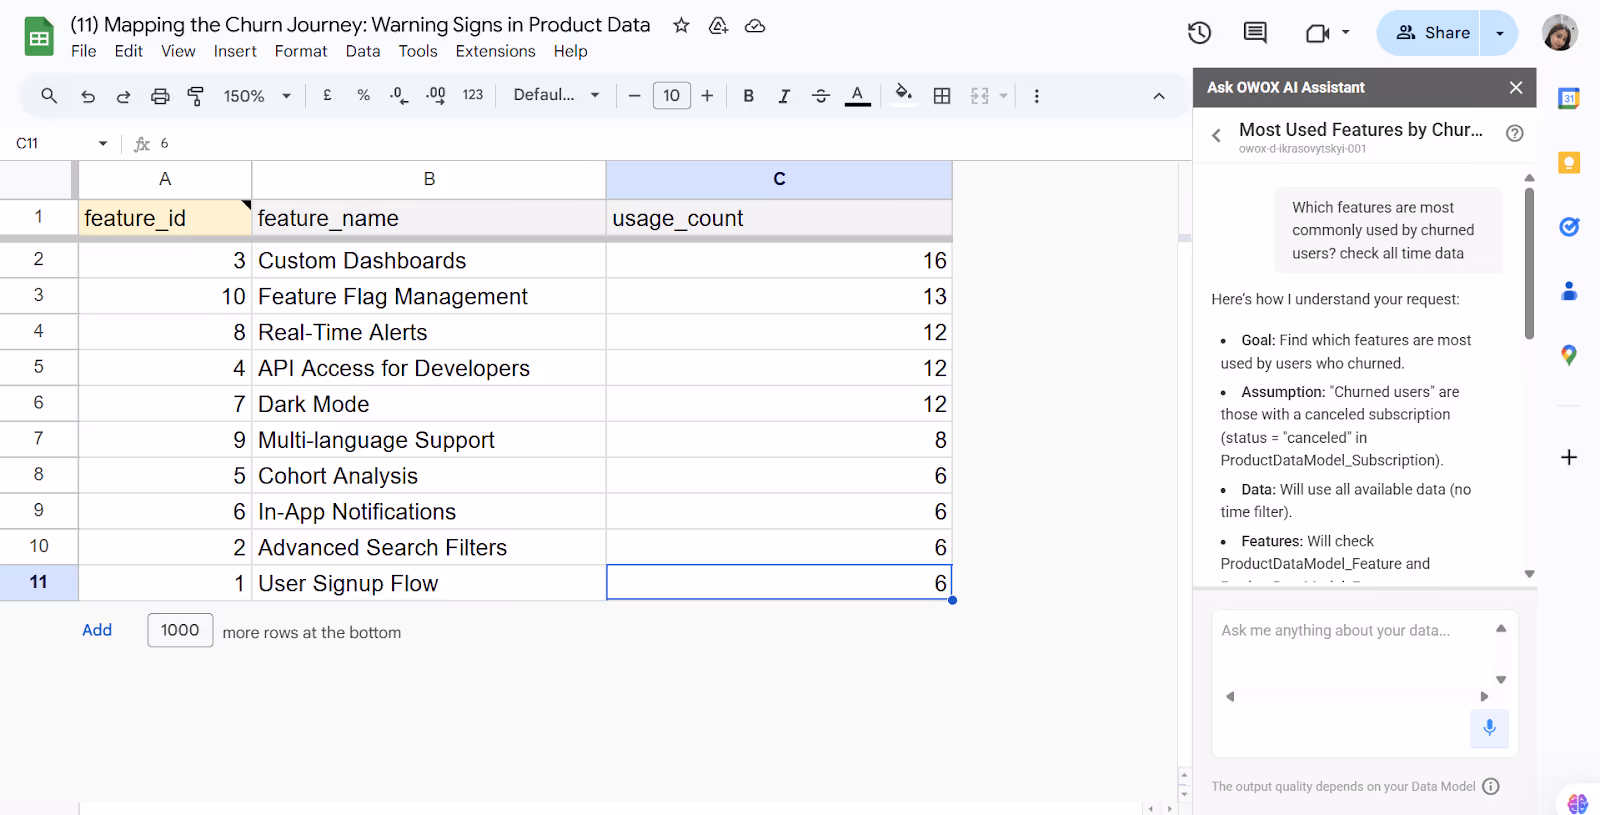
In OWOX Reports, you can ask: “Which features are most commonly used by churned users?”
If you ask this question in OWOX AI Assistant, you'll likely be prompted with the following clarification:
To answer "Which features are most commonly used by churned users?", I need to clarify:
- "Churned users" are defined as users with a subscription status of "canceled" in the ProductDataModel_Subscription table.
- Feature usage will be identified based on event data from the ProductDataModel_Event table linked to the ProductDataModel_Feature table.
- The analysis will use all available data with no time filter applied.
OWOX AI Assistant will ask you:
“Is this correct? Would you like to adjust any of these assumptions?”Once you agree with the assumption (logic), select “Yes, proceed with the report”. You can also add your point if the logic seems to be missing some part required for the analysis.
Once both reports are generated, they can be directly compared to highlight feature usage differences between churned and retained users. This comparison helps identify which features drive engagement and which are underutilized by users who churn.
Filter and Flag At-Risk Users Automatically
After defining what churn risk looks like for your business, use OWOX BI to apply filters and create a dynamic churn watchlist. For instance, you can filter users with no logins in 14 days or those who haven’t used key features recently.
This list updates automatically, giving teams a real-time view of at-risk users. You can easily share it in Google Sheets, helping teams stay proactive and ready to engage.
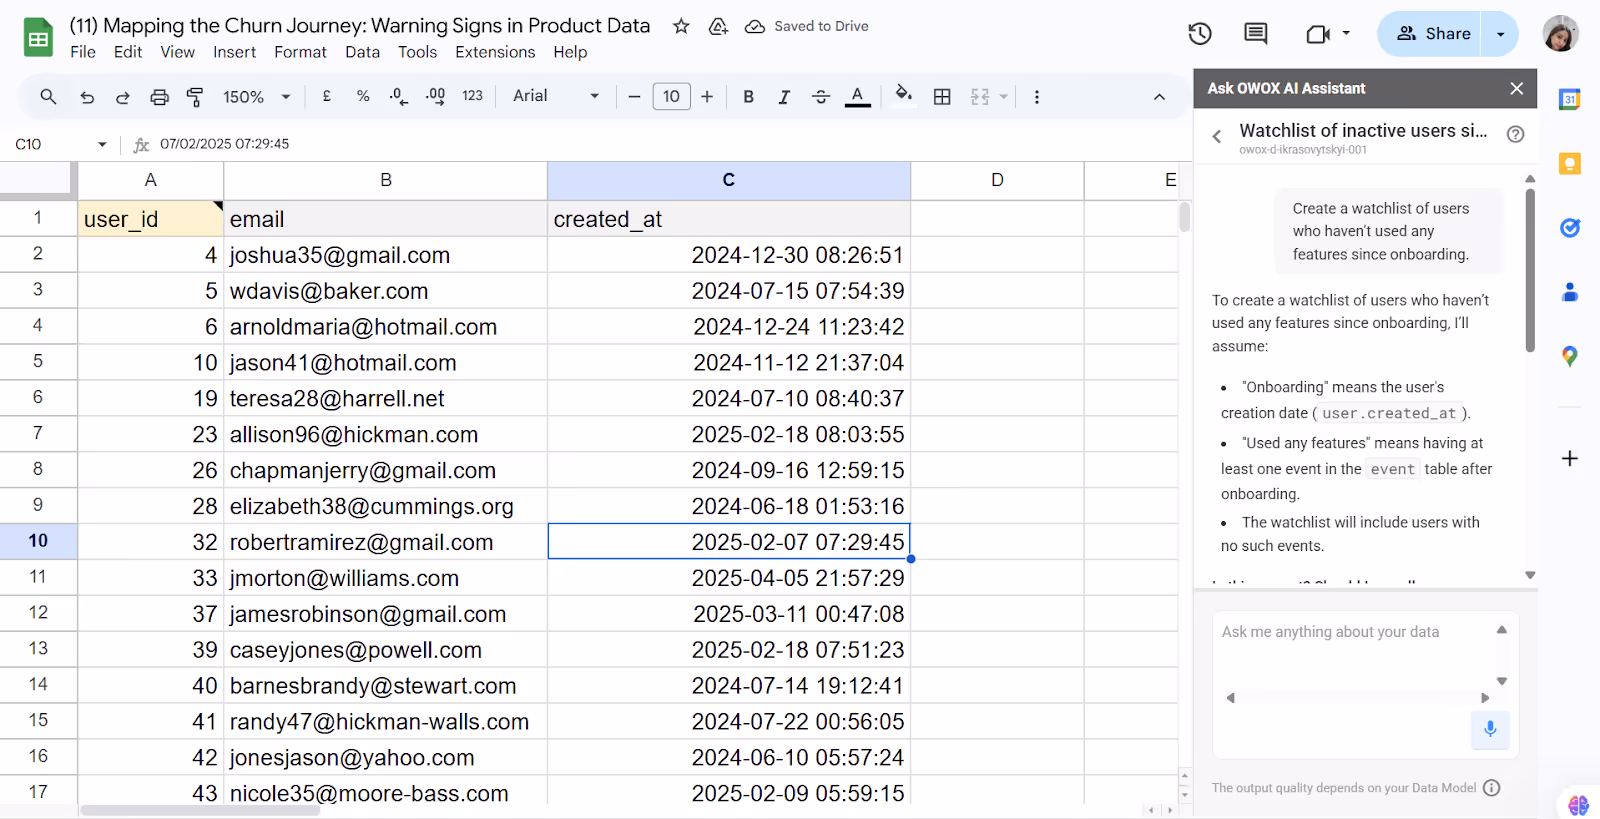
In OWOX Reports, you can ask: “Create a watchlist of users who haven’t used any features since onboarding.” It will share a list of logic pointers that will be used for the report generation.
Assumptions:
- The watchlist will include users who have zero events with a feature_id after their created_at date.
- The report will show user_id, email, and created_at.
Once confirmed, you will get the report.
Ask Churn-Specific Questions with Natural Language
OWOX Reports Chat makes exploring churn risks easy; no SQL is needed. Simply ask questions like, “Who didn’t complete onboarding?” or “Which users stopped using key features?” The answers update automatically and can be shared as live reports with product and customer success teams, helping them spot and engage at-risk users quickly.
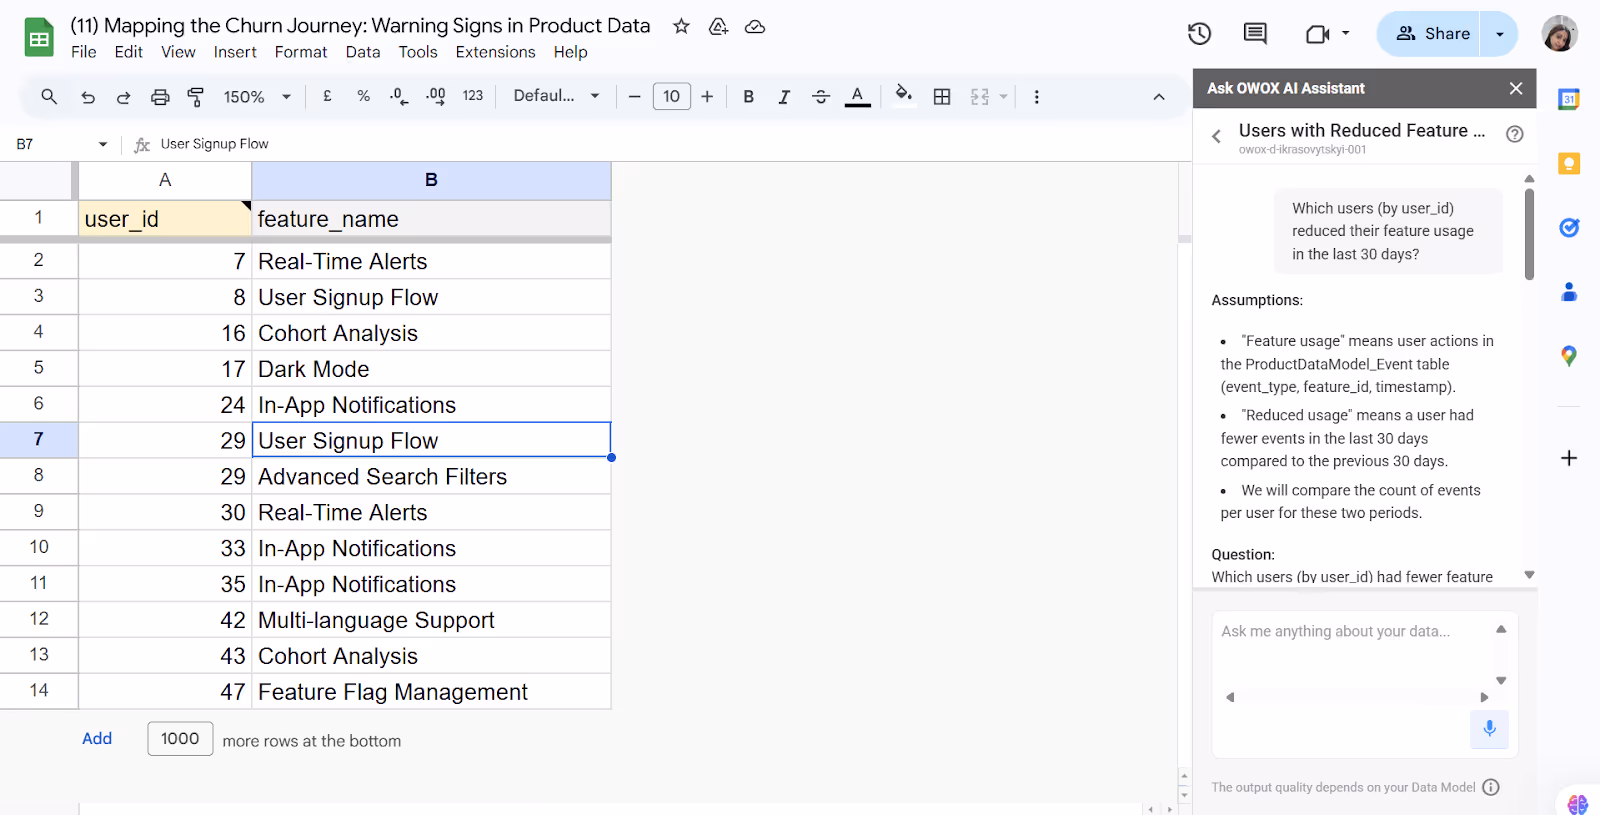
In OWOX Reports, you can ask: “Which users (by user_id) reduced their feature usage in the last 30 days?” It will share a list of logic pointers that will be used for the report generation.
To clarify:
To answer this question, the following assumptions will be made:
- "Feature usage" refers to user actions recorded in the ProductDataModel_Event table, based on event_type, feature_id, and timestamp.
- "Reduced usage" means the number of events per user in the last 30 days is lower than in the previous 30-day period.
- The comparison will be made by counting events per user for each period.
You can proceed or update any of these based on your data.
Automated Churn Reporting: Help Product Teams Stay Ahead of Risk
Automated churn reporting helps product teams respond quickly by spotting at-risk users without waiting for manual reports. OWOX BI allows teams to set up daily churn watchlists that track login drops, missed onboarding steps, and unused features. These watchlists update automatically and are shared in Google Sheets for easy team access. This ensures no risky user goes unnoticed.
In addition, churn prediction models in OWOX BI analyze product usage patterns to flag users likely to leave. These models learn over time, improving accuracy and helping teams act earlier. Product and customer success teams can then reach out before it’s too late.
Spot Churn Before It Happens with OWOX BI
What if you could see churn coming before it happens? With OWOX BI’s ready-to-use product data model, you can track early warning signs and build dynamic churn watchlists in minutes. No complex setup, no waiting for analysts.
Let product managers and customer success teams ask questions in plain English and get instant answers. Monitor risky user behavior, automate churn reports, and take action early, all from Google Sheets. Try OWOX BI and stay ahead of churn effortlessly.
Frequently asked questions


Finally, a tool that doesn't ask business users to learn a new dashboarding UI. Our marketing team already knows Sheets. OWOX just delivers the right data.
Joinable data marts concept was the thing that sold us. We can now use the semantic layer without building one.
Self-hosted the OSS version on Digital Ocean. Zero vendor lock-in. Contributed a Shopify connector back in week two.