
Why Every SaaS Product Team Needs a Data Model
Learn why a strong data model is key to product success in SaaS, from efficient development to better collaboration and analytics.

Many SaaS product teams face confusion not because they lack data, but because their data is messy and disconnected. Product managers want clear answers, while analysts need well-structured inputs. But without a common foundation, teams waste time trying to align on numbers.
A good data model changes that. It acts as a single source of truth, helping everyone speak the same language. With cleaner data and shared definitions, teams can move faster, make better decisions, and build products users love. In this article, we’ll explore why starting with a data model is essential for scalable product analytics and growth.
What Is a Data Model?
A data model is a structured way to organize, define, and connect different pieces of data within a system. It helps product teams understand how users, actions, and subscriptions relate to each other.

By creating this structure, the model removes confusion and brings clarity to data. It becomes the foundation for reliable reporting and analysis.
The process of building this structure is called data modeling. It often includes diagrams or visual maps that show how data flows through a product. These models help everyone from product managers to analysts see the bigger picture and work with the same understanding.
Why Product Teams Should Prioritize Data Modeling?
Prioritizing data modeling gives product teams a clear structure to work with. In this section, we’ll look at key benefits like better insights, faster decisions, and stronger team alignment.
Deeper Clarity Into Product Usage and Customer Behavior
Data modeling gives product teams a clearer picture of how users behave and interact with the product. By organizing and documenting data sources, it ensures everyone works with the same, reliable information. This clarity helps teams spot usage trends, identify what features work best, and make informed decisions to improve user experience and overall product performance.
Simplified Compliance With Data Privacy and Reporting Standards
With data privacy laws like GDPR and CCPA, it's crucial for product teams to know exactly how user data is stored, accessed, and used. A data model helps by organizing this information in a clear and consistent way. It makes it easier to review data flows, apply security rules, and adapt to new regulations. By modeling data properly, teams can stay compliant, avoid legal risks, and build stronger trust with users through responsible data practices.
Faster Onboarding and Easier Access to Self-Serve Insights
A data model works like a guidebook for your product’s data. It helps new team members understand how everything is connected, speeding up onboarding. Because it creates a shared understanding, teams can find answers without always relying on data experts. This makes collaboration easier and gives everyone the power to explore and use data independently.
Stronger Product Analytics and Team Accountability
A strong data model shows how all parts of the product data fit together, helping teams quickly find patterns, gaps, or issues. This clear structure boosts confidence in the data and encourages everyone to use it more responsibly. As a result, team members become more accountable, and decisions are based on real insights rather than guesswork or assumptions.
Effortless Integration Across Internal Tools and Data Systems
As SaaS products expand, they often use multiple tools for things like billing, support, and user tracking. A data model helps bring these systems together by showing how their data connects. It removes duplication, fills in data gaps, and ensures smooth communication between tools. This makes it easier to manage and use data across the entire product ecosystem.
Cleaner Data Models That Speed Up Feature Development
A clean and well-structured data model acts like a blueprint for your product’s database. It helps developers build features faster by giving them a clear plan to follow. This reduces confusion, avoids rework, and improves how the application performs. With everything well-organized, teams can launch updates quicker and scale the product more easily.
Data Modeling vs. Dashboards: Why Product Teams Should Model Before They Measure?
Jumping straight into dashboards without a solid data model can lead to confusion and mismatched metrics. Modeling first ensures clarity, consistency, and faster access to accurate, trusted insights.
Shared Definitions Prevent Misalignment Across Teams
Using a shared data model means everyone, product managers, analysts, and leadership, understands terms like “active user” or “churn” in the same way. This avoids confusion, prevents conflicting reports, and saves time otherwise spent aligning on definitions. With clear and consistent meanings, teams can focus on solving real problems instead of debating what the numbers actually mean.
Faster Answers Without Reworking Data Each Time
With a well-defined data model in place, teams no longer need to clean or reshape raw data for every new dashboard or report. This reduces back-and-forth communication with data teams and avoids repetitive work. As a result, product managers can get the insights they need faster, make quicker decisions, and focus more on improving the product.
Models Scale With Product Complexity
As your product grows with new features and more user actions, the data also becomes more complex. A strong data model adjusts with these changes, keeping everything organized. This flexibility helps teams avoid starting over and makes sure analytics still work smoothly. It supports long-term growth without slowing down reporting or requiring constant rework.
Prevents Metric Fragmentation Across Dashboards
Without a shared data model, different teams often define the same metric in different ways, leading to multiple versions of the same KPI. This causes confusion and makes it hard to trust reports. A unified data model ensures everyone uses the same definitions, keeping dashboards consistent and making it easier to track product performance with confidence.
Enables Self-Service for PMs and Analysts
A well-structured data model empowers product managers and analysts to find answers without always relying on engineers or data teams. They can use tools like SQL, Google Sheets, or BI dashboards to pull insights on their own. This self-service access saves time, speeds up decisions, and helps teams stay more independent and confident in using data effectively.
Aligns Product, Growth, and Engineering With Trusted Data
A shared data model ensures that product, growth, and engineering teams all work from the same reliable data. Everyone sees the same numbers, definitions, and reports. This alignment removes confusion, supports better planning, and helps teams collaborate more effectively. When decisions are based on trusted data, teams move faster and stay focused on shared goals.
Key Business Entities in a SaaS Data Model
A SaaS data model is built around key business entities that reflect how your product works and how users interact with it. These entities help organize data clearly, making it easier to track performance, user behavior, and growth metrics.
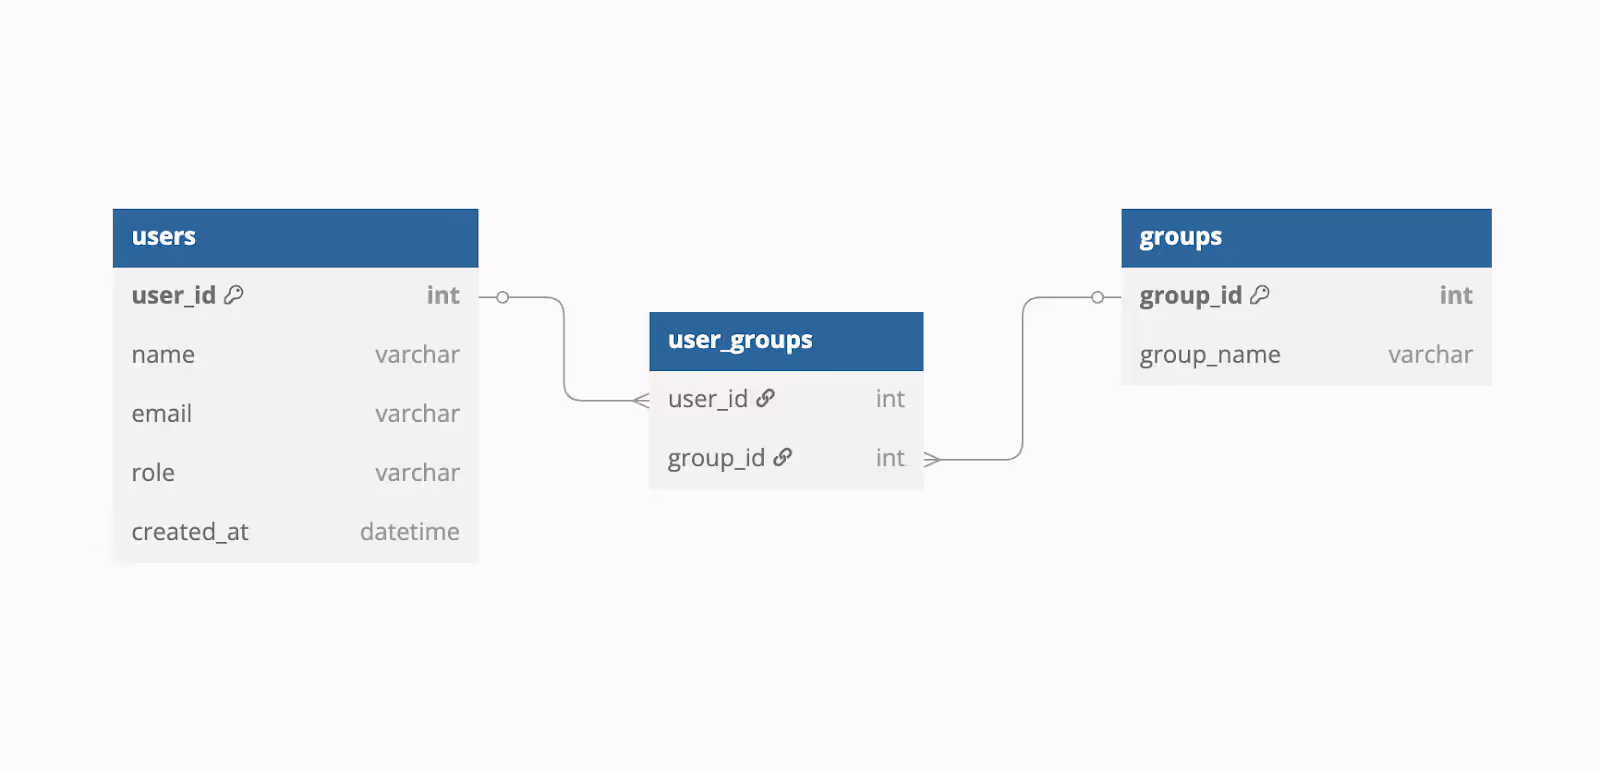
Users and Groups
Users and groups represent the people using your SaaS product. Each user typically has details like a user ID, name, email, and role. Understanding this data helps track how users engage with the product. It also supports personalization, allowing teams to deliver better experiences based on user actions, preferences, and behavior patterns.
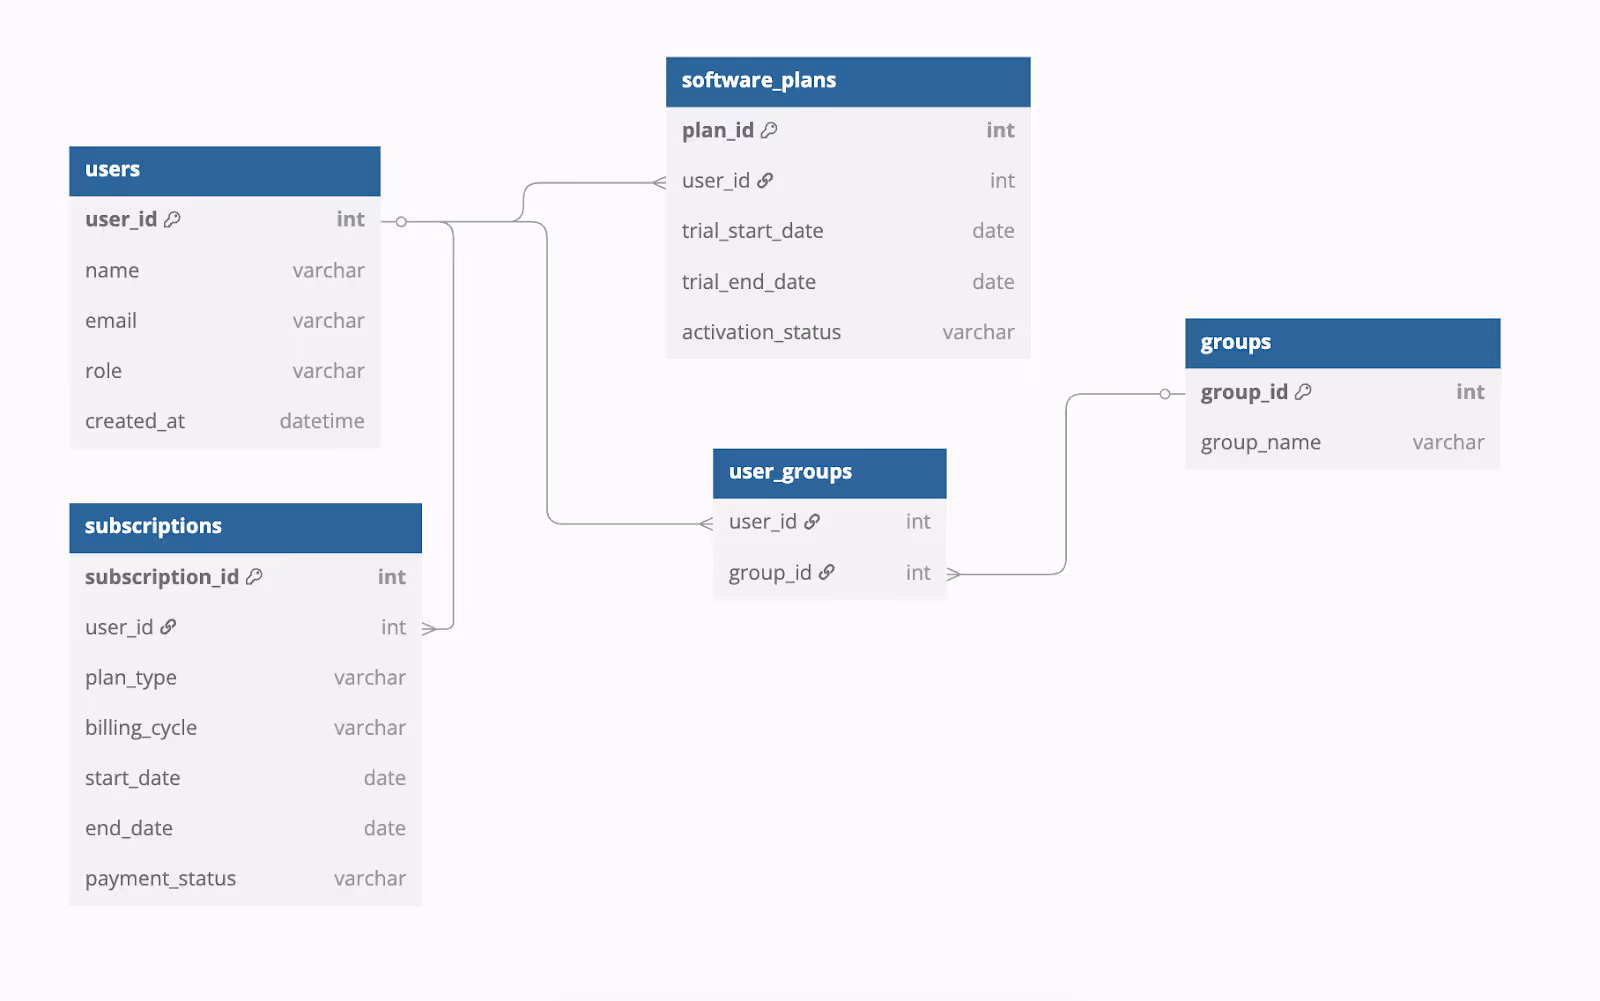
Software and Plans
Software and plans usually refer to a user’s access during the free trial period. This includes details like trial start and end dates, activation status, and user ID. Tracking this data helps teams understand how users explore the product, measure trial-to-paid conversion rates, and improve the onboarding experience.

Subscriptions, Plans, and Payments
This entity shows the paid relationship between the user and your SaaS product. It includes details like subscription ID, plan type, billing cycle, dates, and payment status. Tracking this data helps understand customer lifecycles, monitor revenue, and manage renewals or cancellations effectively.
Event
Events record specific actions users take while using the product, such as logging in, clicking a feature, or completing a task. Each event logs important details like the event type, time it happened, user ID, and other context. This data helps product teams see how users interact with the product, track feature usage, and improve the overall user experience.

How a Product Data Model Helps You Ask (and Answer) Better Questions
A well-structured product data model makes it easier to ask the right questions and find clear answers. It connects key data points like users, events, and subscriptions, helping teams understand behavior, measure outcomes, and make smarter product decisions.
How Can We Understand Which Features Users Are Adopting?
By using a data model with entities like user, event, and feature, teams can track how often and how deeply users interact with specific features. This helps identify which features are popular and driving engagement, and which ones might need better onboarding or improvements. It provides a clear view of what users find valuable.

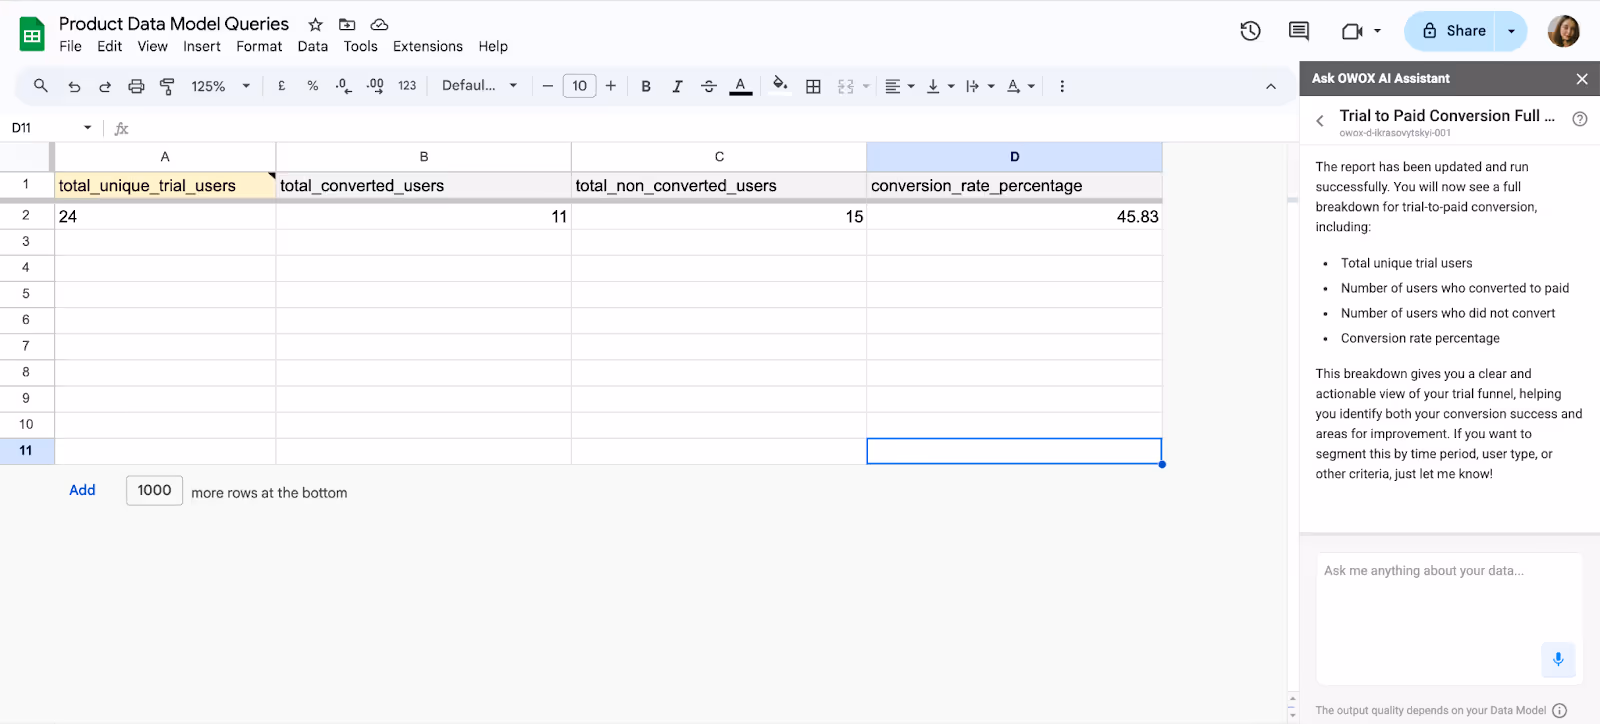
What Percentage of Trial Users Convert to Paid Subscriptions?
A product data model that includes trial, user, and subscription entities helps track user activity during free trials. Teams can analyze what actions lead to conversion or drop-off. This insight helps improve the trial experience and boost conversion rates by focusing on the behaviors that lead to paid subscriptions.
Which Subscription Plans Have the Highest Retention Rates?
By modeling data around users, subscriptions, and plan types, teams can compare how long users stay on each plan. This reveals which plans retain customers best and why. These insights help improve pricing, upgrade strategies, and customer satisfaction by focusing on the most valuable offerings

How Do Users Interact with the Product Over Time?
With a model that includes user, session, event, and milestone data, teams can track how users behave from sign-up to long-term use. It highlights common paths, key moments, and where users get stuck. These insights help improve the product experience and keep users engaged over time.

Real-World Example of SaaS Product Growth with Data Modeling Implementation
Data modeling helps uncover user challenges, guide improvements, and drive growth. Here’s how one SaaS company boosted feature adoption using this approach.
Company X: Crypto Payroll Feature Adoption
Company X is a B2B SaaS platform that provides global payroll solutions for businesses, including support for innovative payment methods like cryptocurrency.
Challenge: The company introduced a cryptocurrency payroll feature aimed at offering more flexibility in payments. However, adoption remained low as users hesitated due to concerns around compliance, trust, and overall clarity of the feature.
Data Modeling Implementation: The team built a behavior-focused data model to track user interactions and feedback. They used it to identify friction points in the feature discovery process.

Actions Taken:
- Added in-app tutorials where users struggled.
- Sent targeted re-engagement emails to early adopters.
- Shared educational resources about compliance.
Result: As a result, adoption of the crypto payroll feature rose by 80% within weeks, driven by improved clarity and user confidence.
How OWOX BI Can Help in Product Growth (Without Rebuilding Your Stack)
OWOX BI helps SaaS teams turn messy product data into clear, usable insights without needing to rebuild their existing systems. With ready-to-use templates and smooth integration, it simplifies analytics and supports faster, smarter product decisions.
Ready-to-Use Data Model Templates
OWOX BI offers ready-made templates built specifically for SaaS businesses. These templates include key entities like users, trials, subscriptions, events, and milestones. With everything already structured, teams don’t need to build from scratch. This saves time, reduces setup errors, and helps product teams start analyzing reliable, well-organized data right away.
Seamless Integration with Google BigQuery
OWOX BI connects easily with Google BigQuery, allowing teams to bring all their data into one place. This centralized setup ensures that information is consistent, well-organized, and easy to access. Teams can avoid data chaos and work with clean, trusted data that’s ready for reporting, analysis, and decision-making, all without complex manual processes.
Empowering Self-Service Analytics
With OWOX BI’s SQL Copilot, even non-technical team members can create SQL queries using AI assistance. This makes it easy for product managers and analysts to explore data and get insights on their own. It removes bottlenecks, reduces the need to wait for data teams, and supports faster, independent decision-making across the organization.
Scale Product Analytics with OWOX BI’s Ready-to-Use Data Model
Tired of messy data and slow reporting? OWOX BI simplifies data modeling by organizing data from different sources into one clean, structured model. This removes inconsistencies, reduces manual work, and makes your data accurate and ready for analysis.
With OWOX BI, you can scale faster by aligning your data with business goals. It boosts performance, speeds up reporting, and helps teams get reliable insights without the hassle. Start with the model—make every product decision clear and confident.
Frequently asked questions


Finally, a tool that doesn't ask business users to learn a new dashboarding UI. Our marketing team already knows Sheets. OWOX just delivers the right data.
Joinable data marts concept was the thing that sold us. We can now use the semantic layer without building one.
Self-hosted the OSS version on Digital Ocean. Zero vendor lock-in. Contributed a Shopify connector back in week two.