
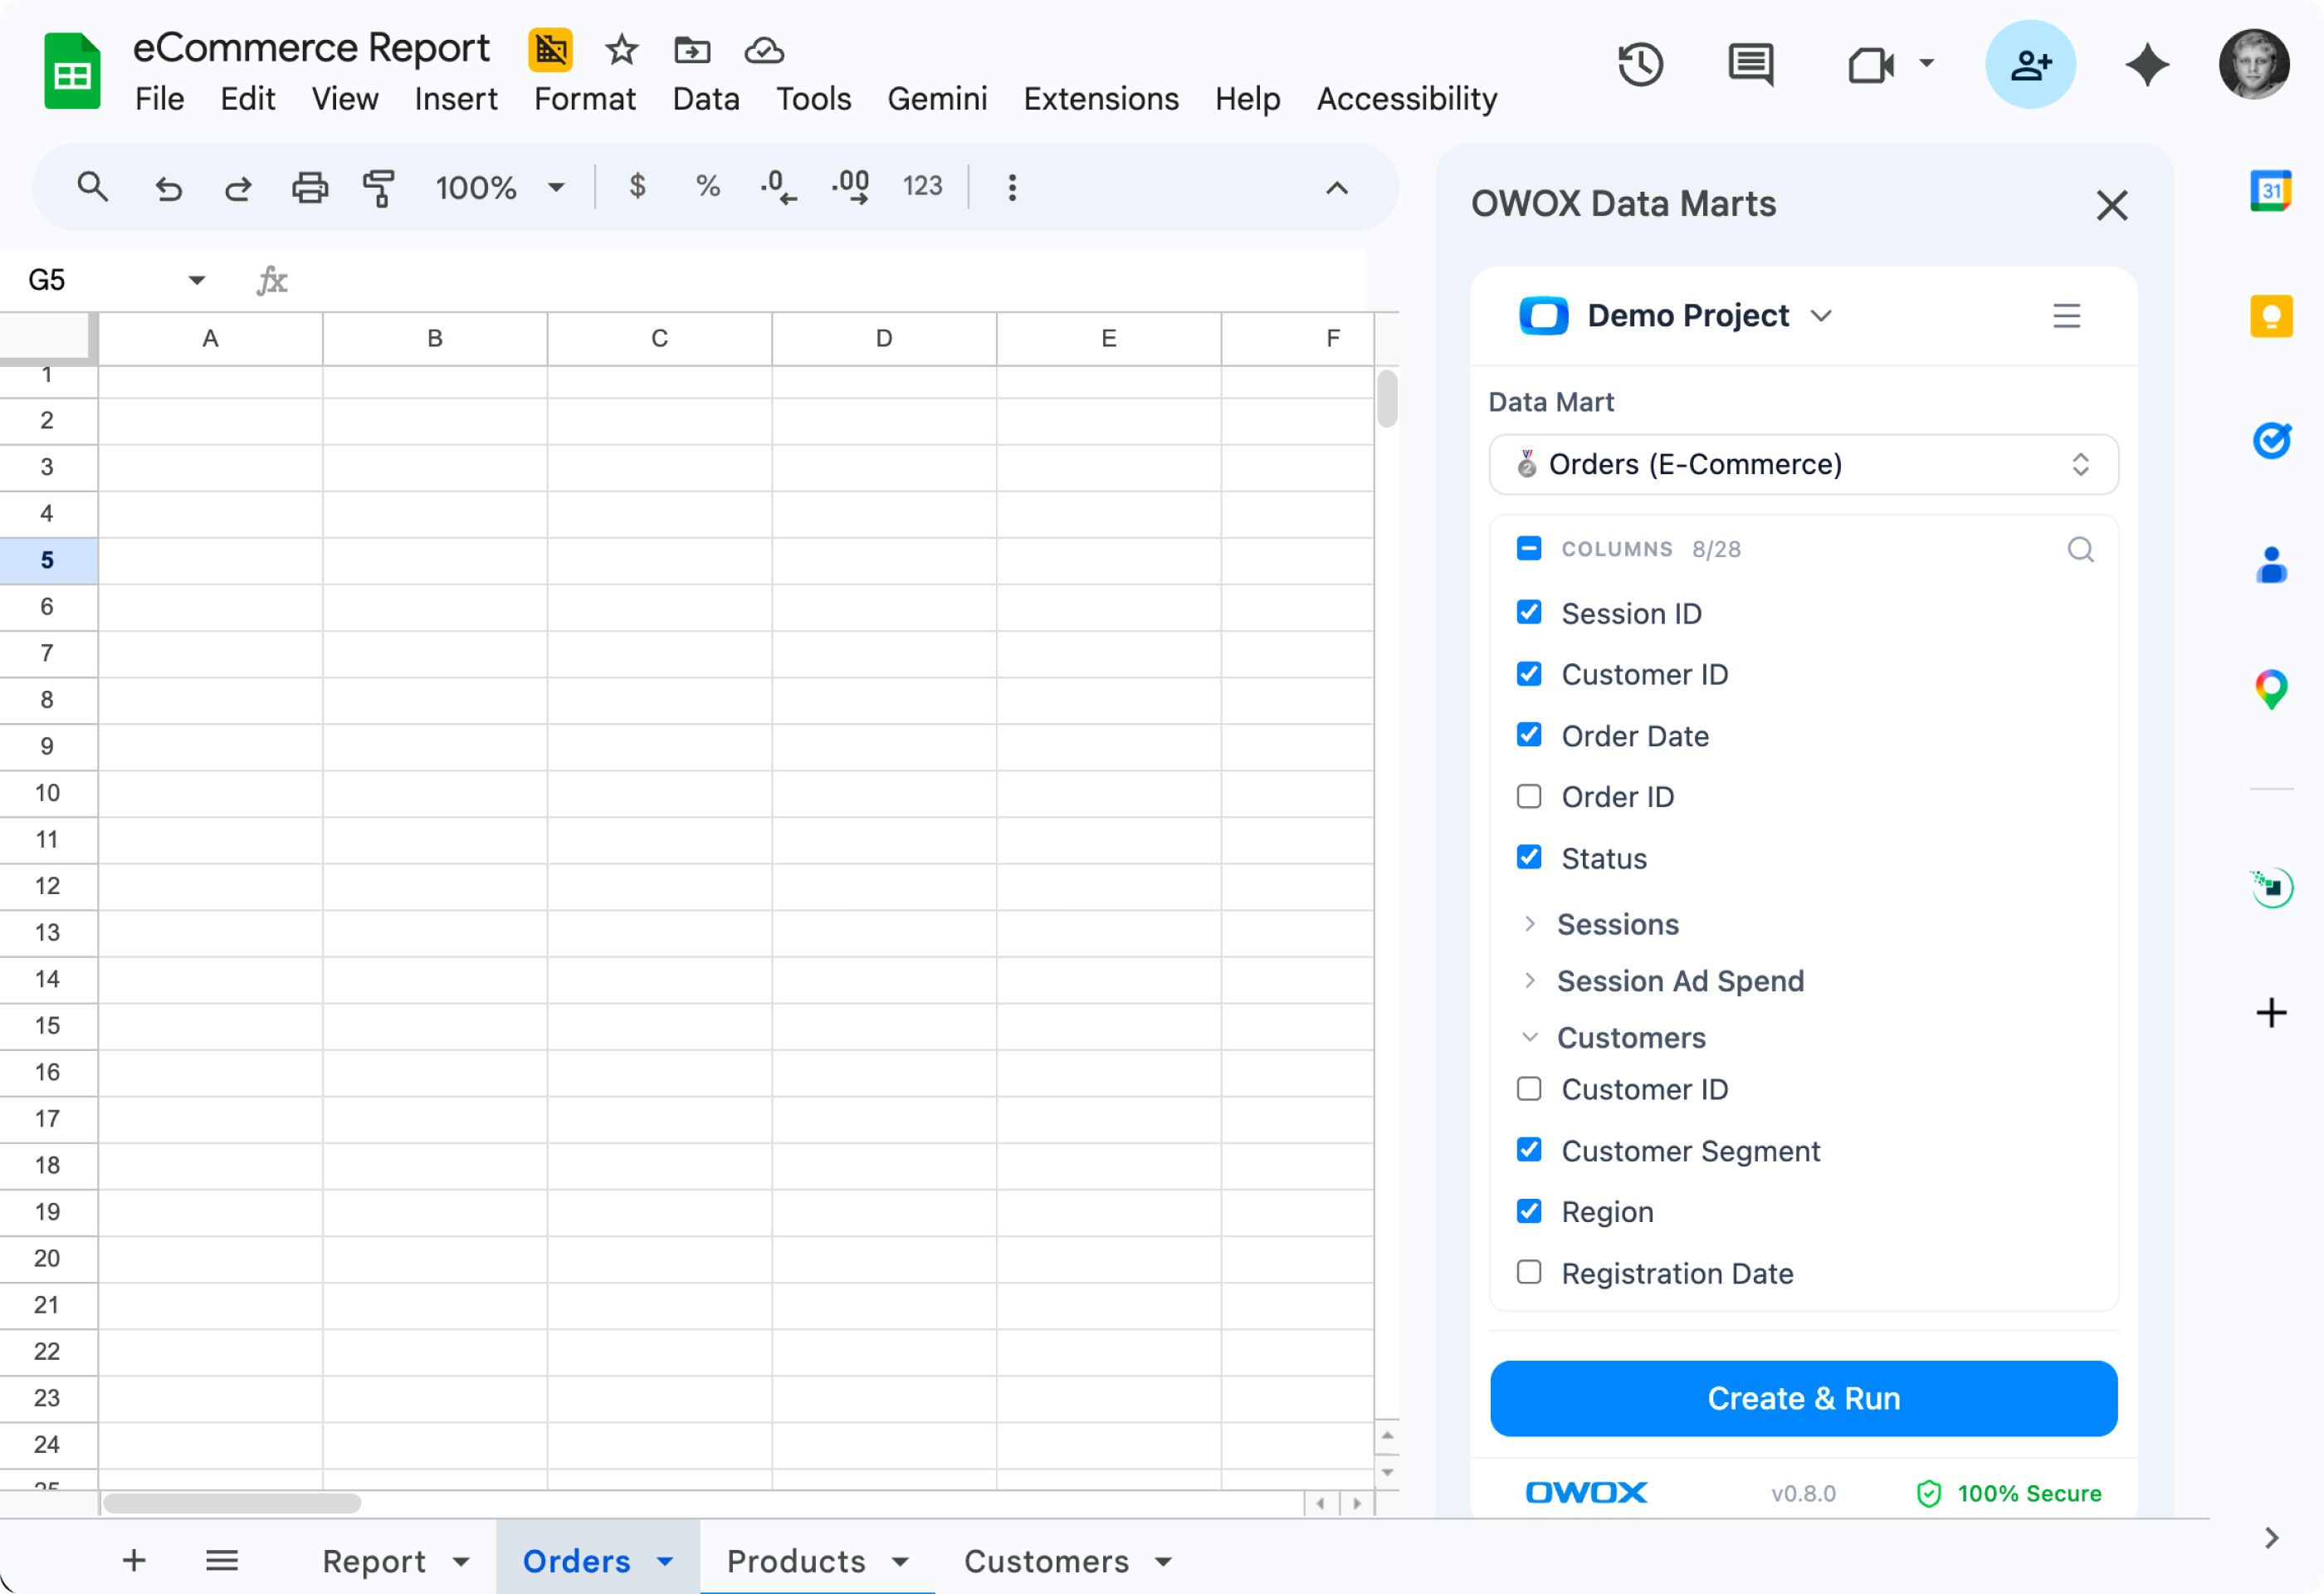
Joinable Data Marts give analysts a lightweight way to declare relationships, and give business users the blended data they need — without anyone writing a line of SQL at query time.
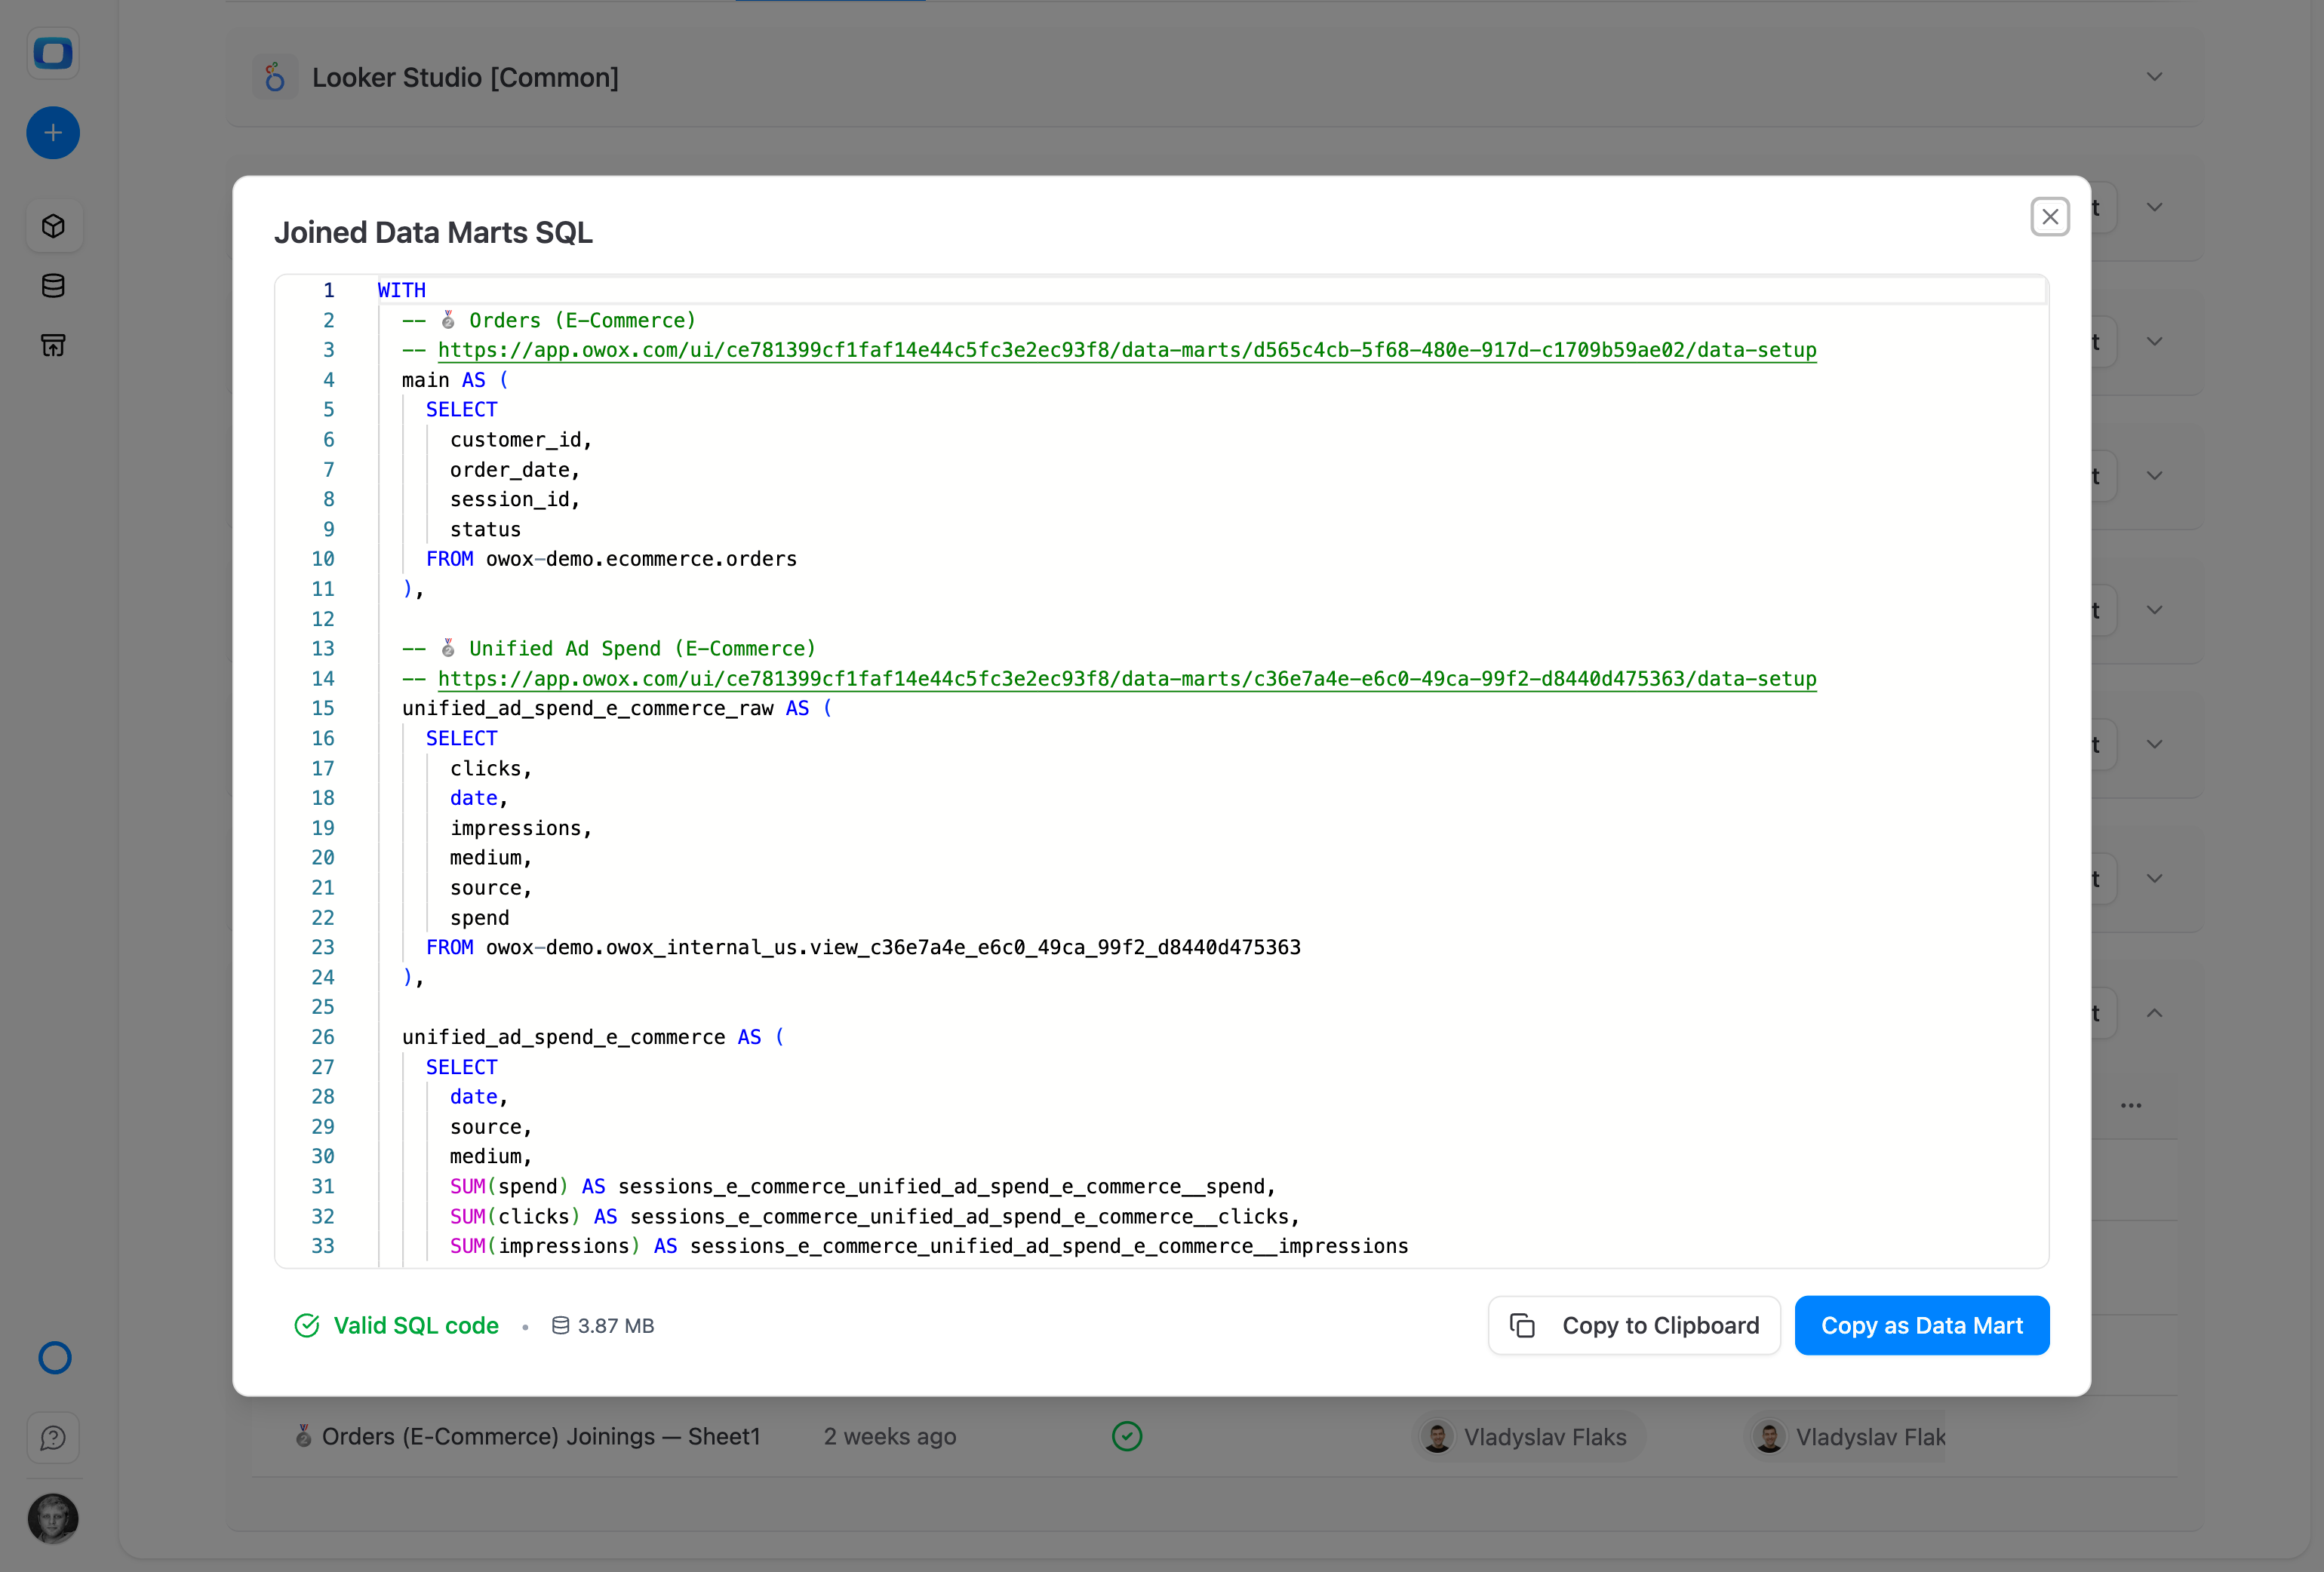
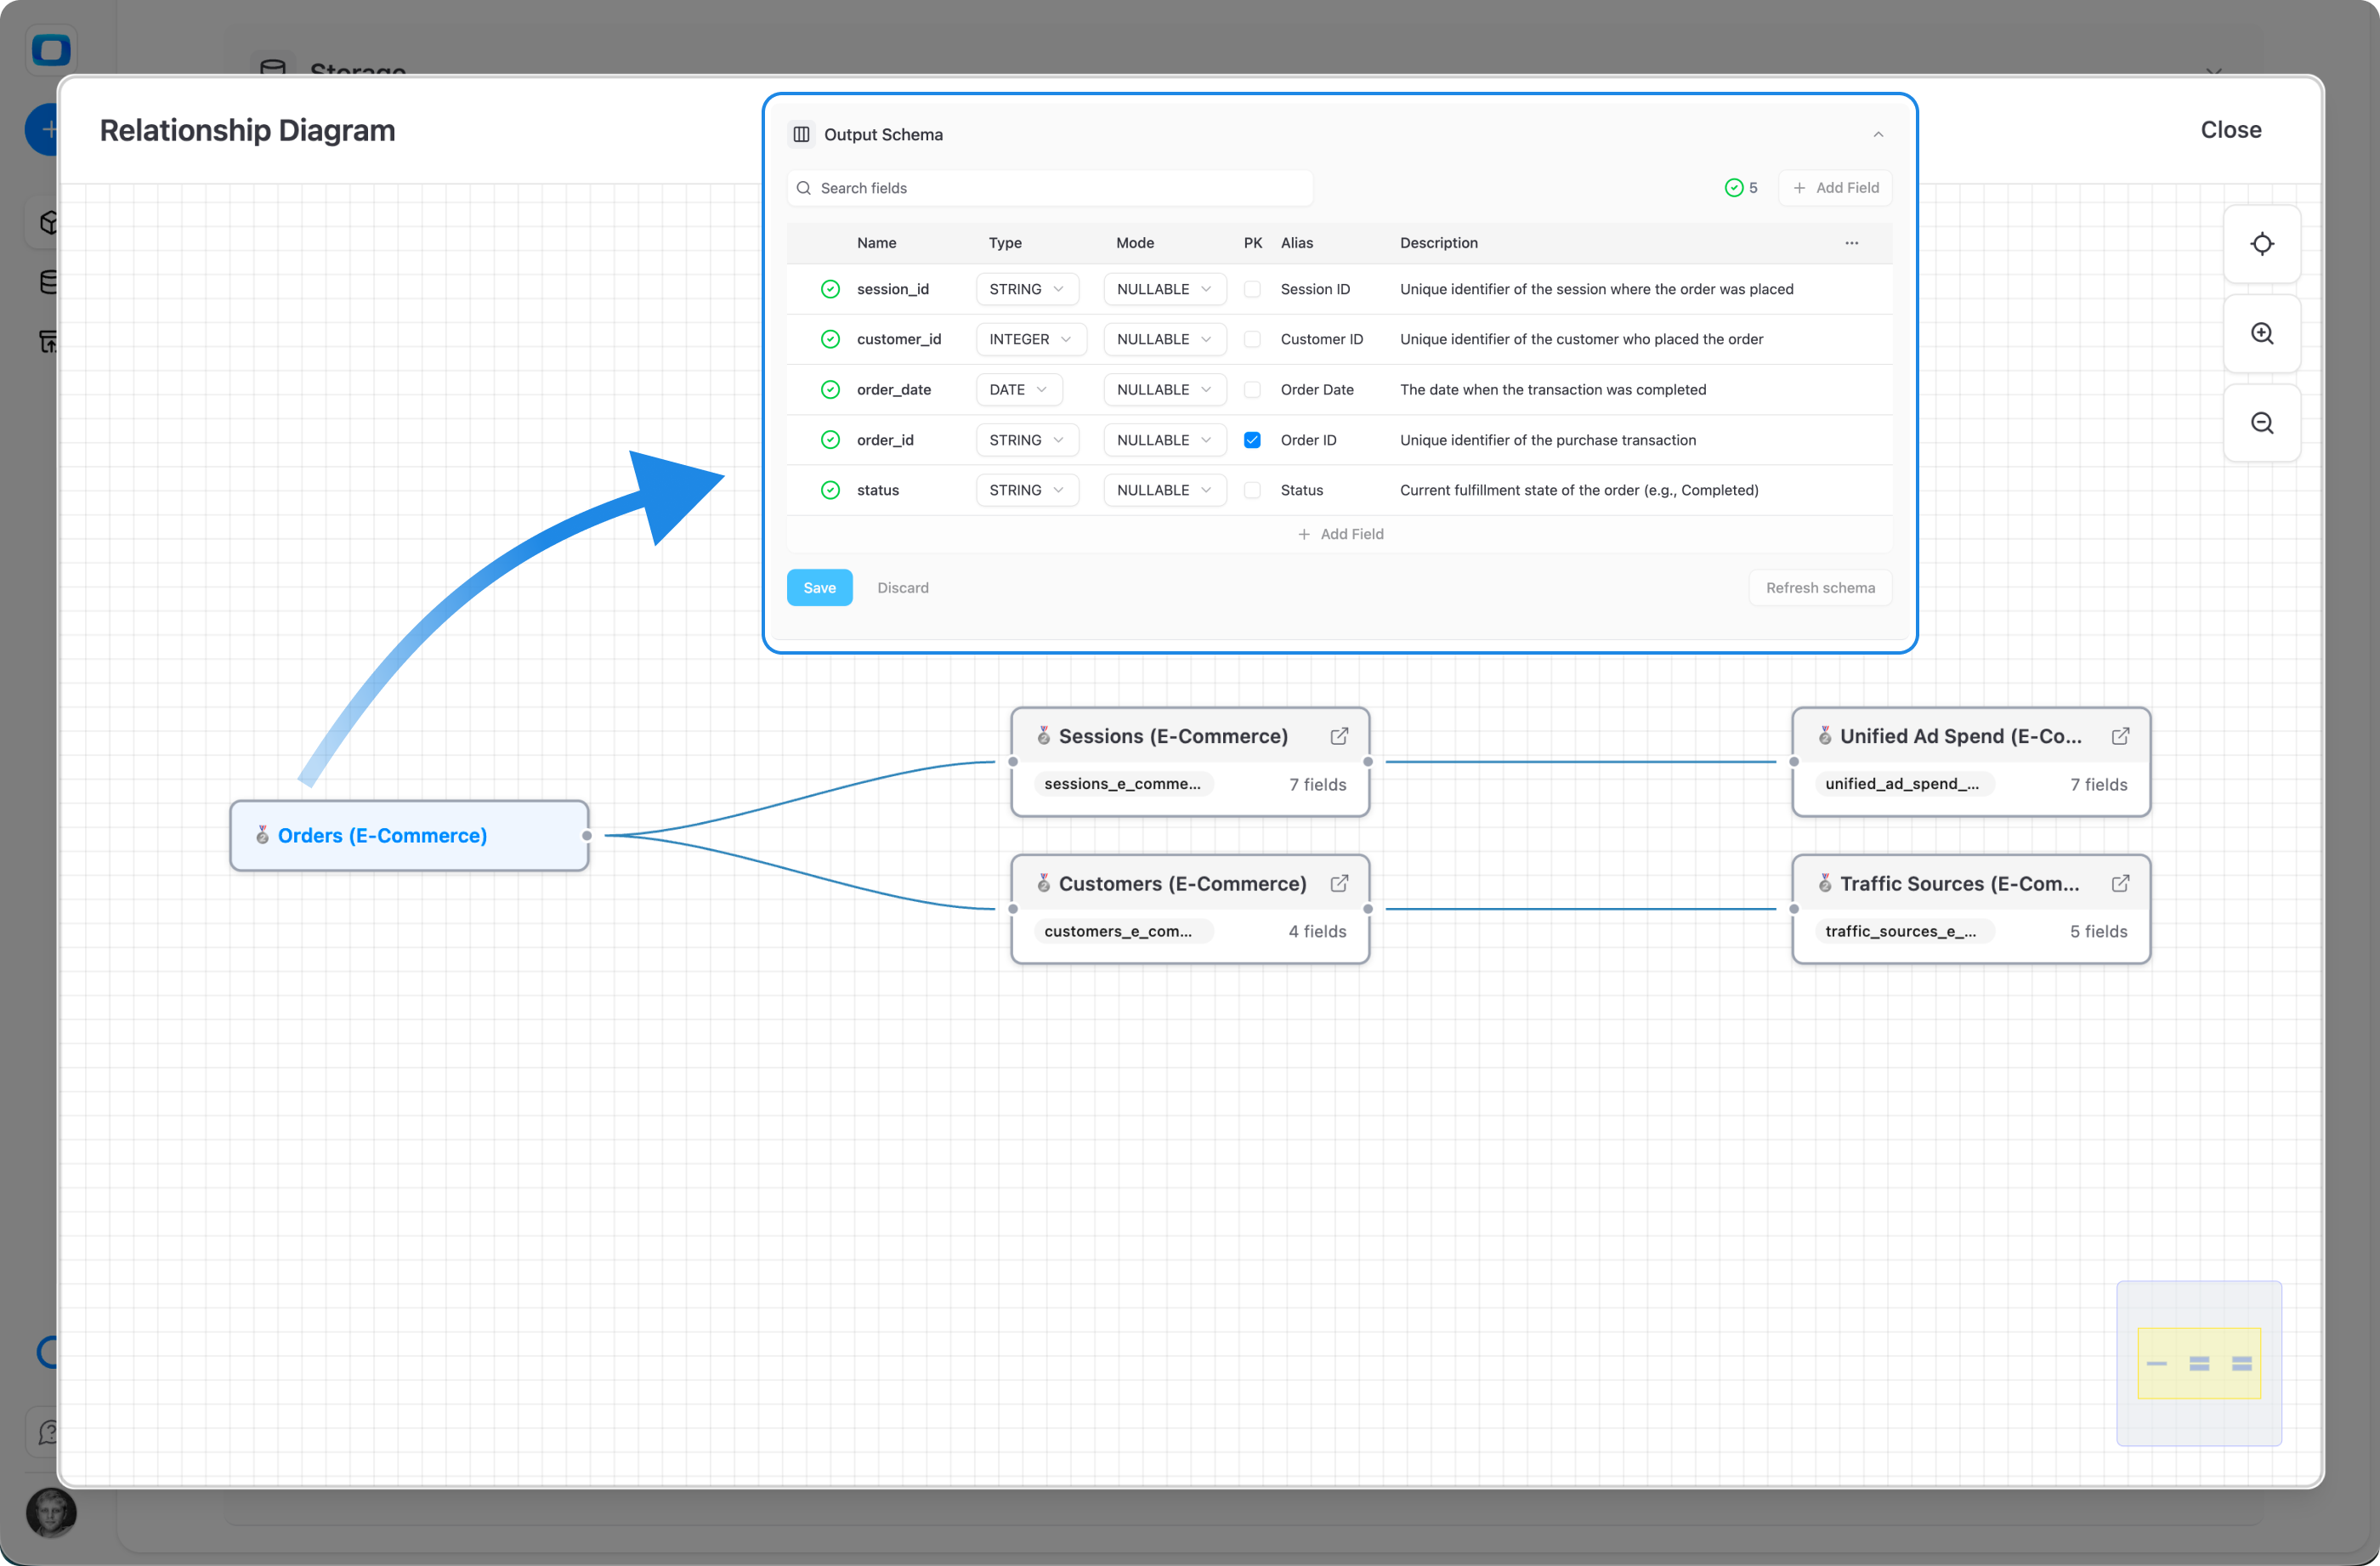
Pick two Data Marts, choose the join keys, set output aliases. That's it. No 200-page LookML repo, no central modeling team - just relationships that evolve with the business. Internal SQL is auto-generated with proper aggregation.
Native and joined fields appear in the same picker — in Google Sheets, Looker Studio, or AI prompts. Blend ads with CRM, marketing with sales, product with finance. The join happens behind the scenes.

Pick two Data Marts, choose the join keys, set output aliases. Relationships evolve with the business — no big-bang modeling project required.
Traditional semantic layers take months to build and break the moment your data evolves. Joinable Data Marts give you the same outcome — incrementally, in days.
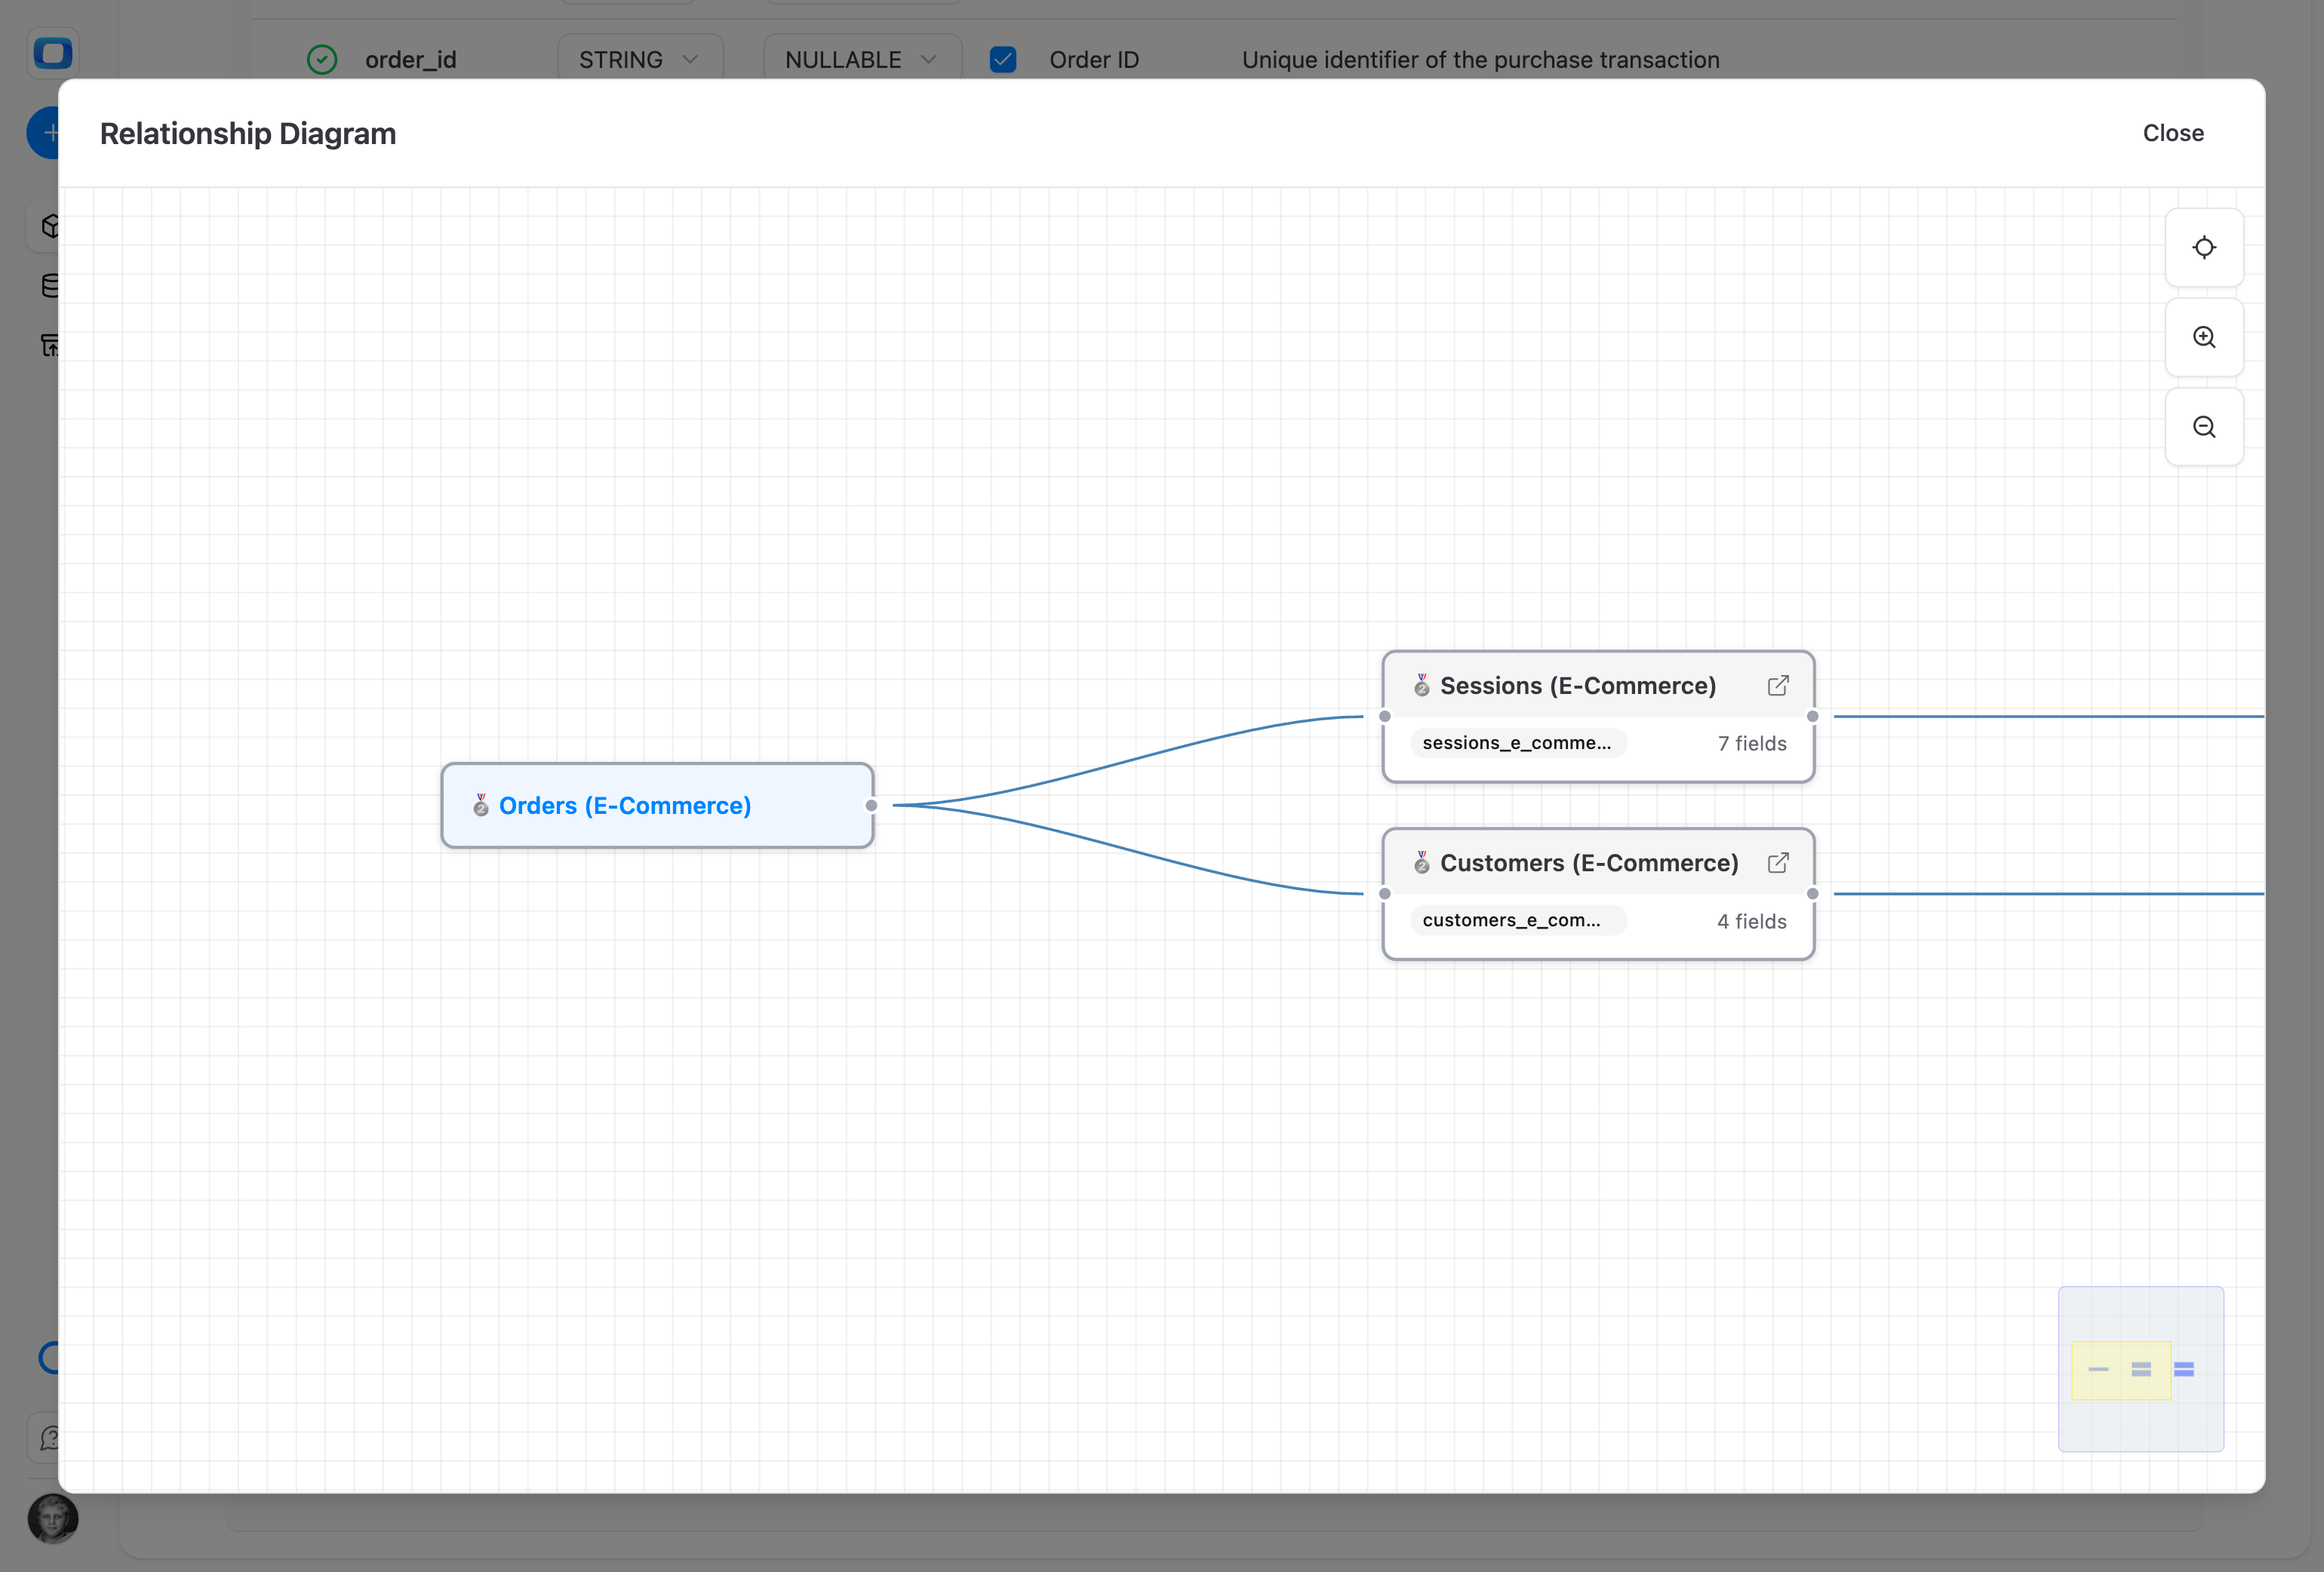
Pick two Data Marts, choose the join keys, and you're done. No 200-page LookML repo, no central modeling team — just relationships that match how your business already works.
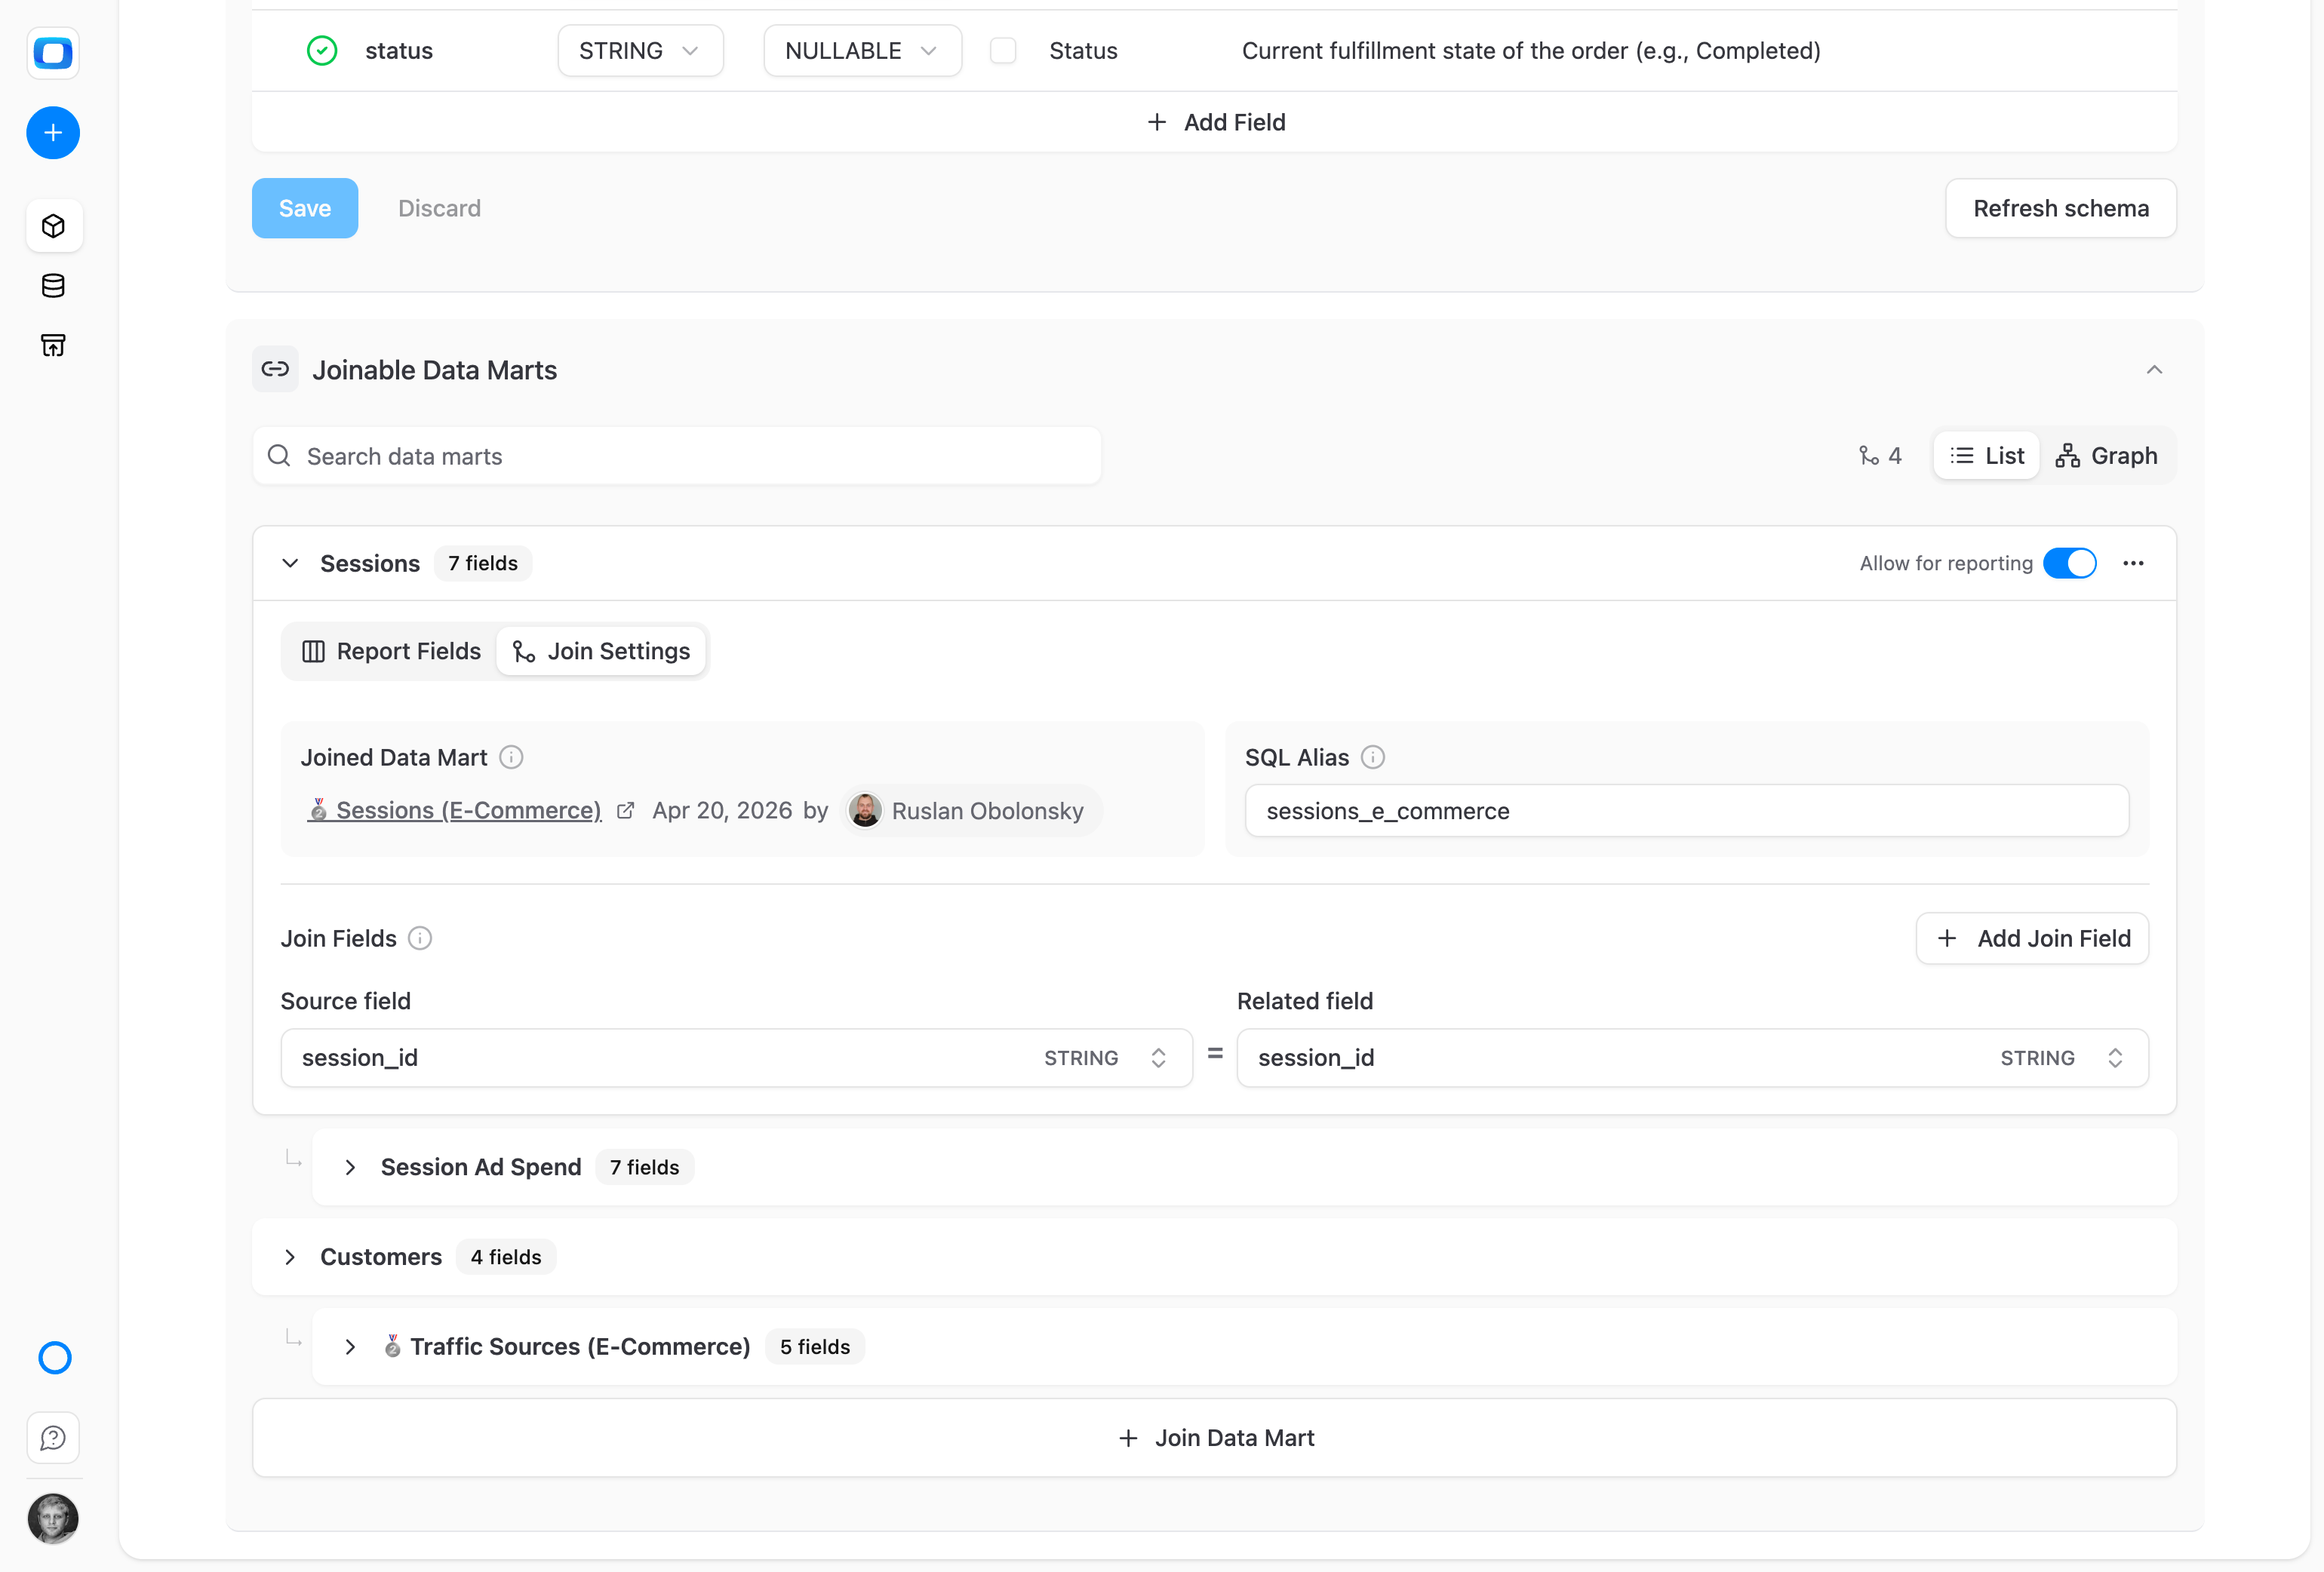
Set output aliases on each Data Mart and per-field overrides on joins. Consumers see "Campaign Cost" — not gads_campaign_cost_amt_usd_v2.

Native and joined fields appear in the same picker. Blend ads, CRM, and product data — no SQL, no waiting on the data team.
Pull spend from your Ads Data Mart and matching pipeline from CRM into the same report. The join happens behind the scenes; you just pick the columns.
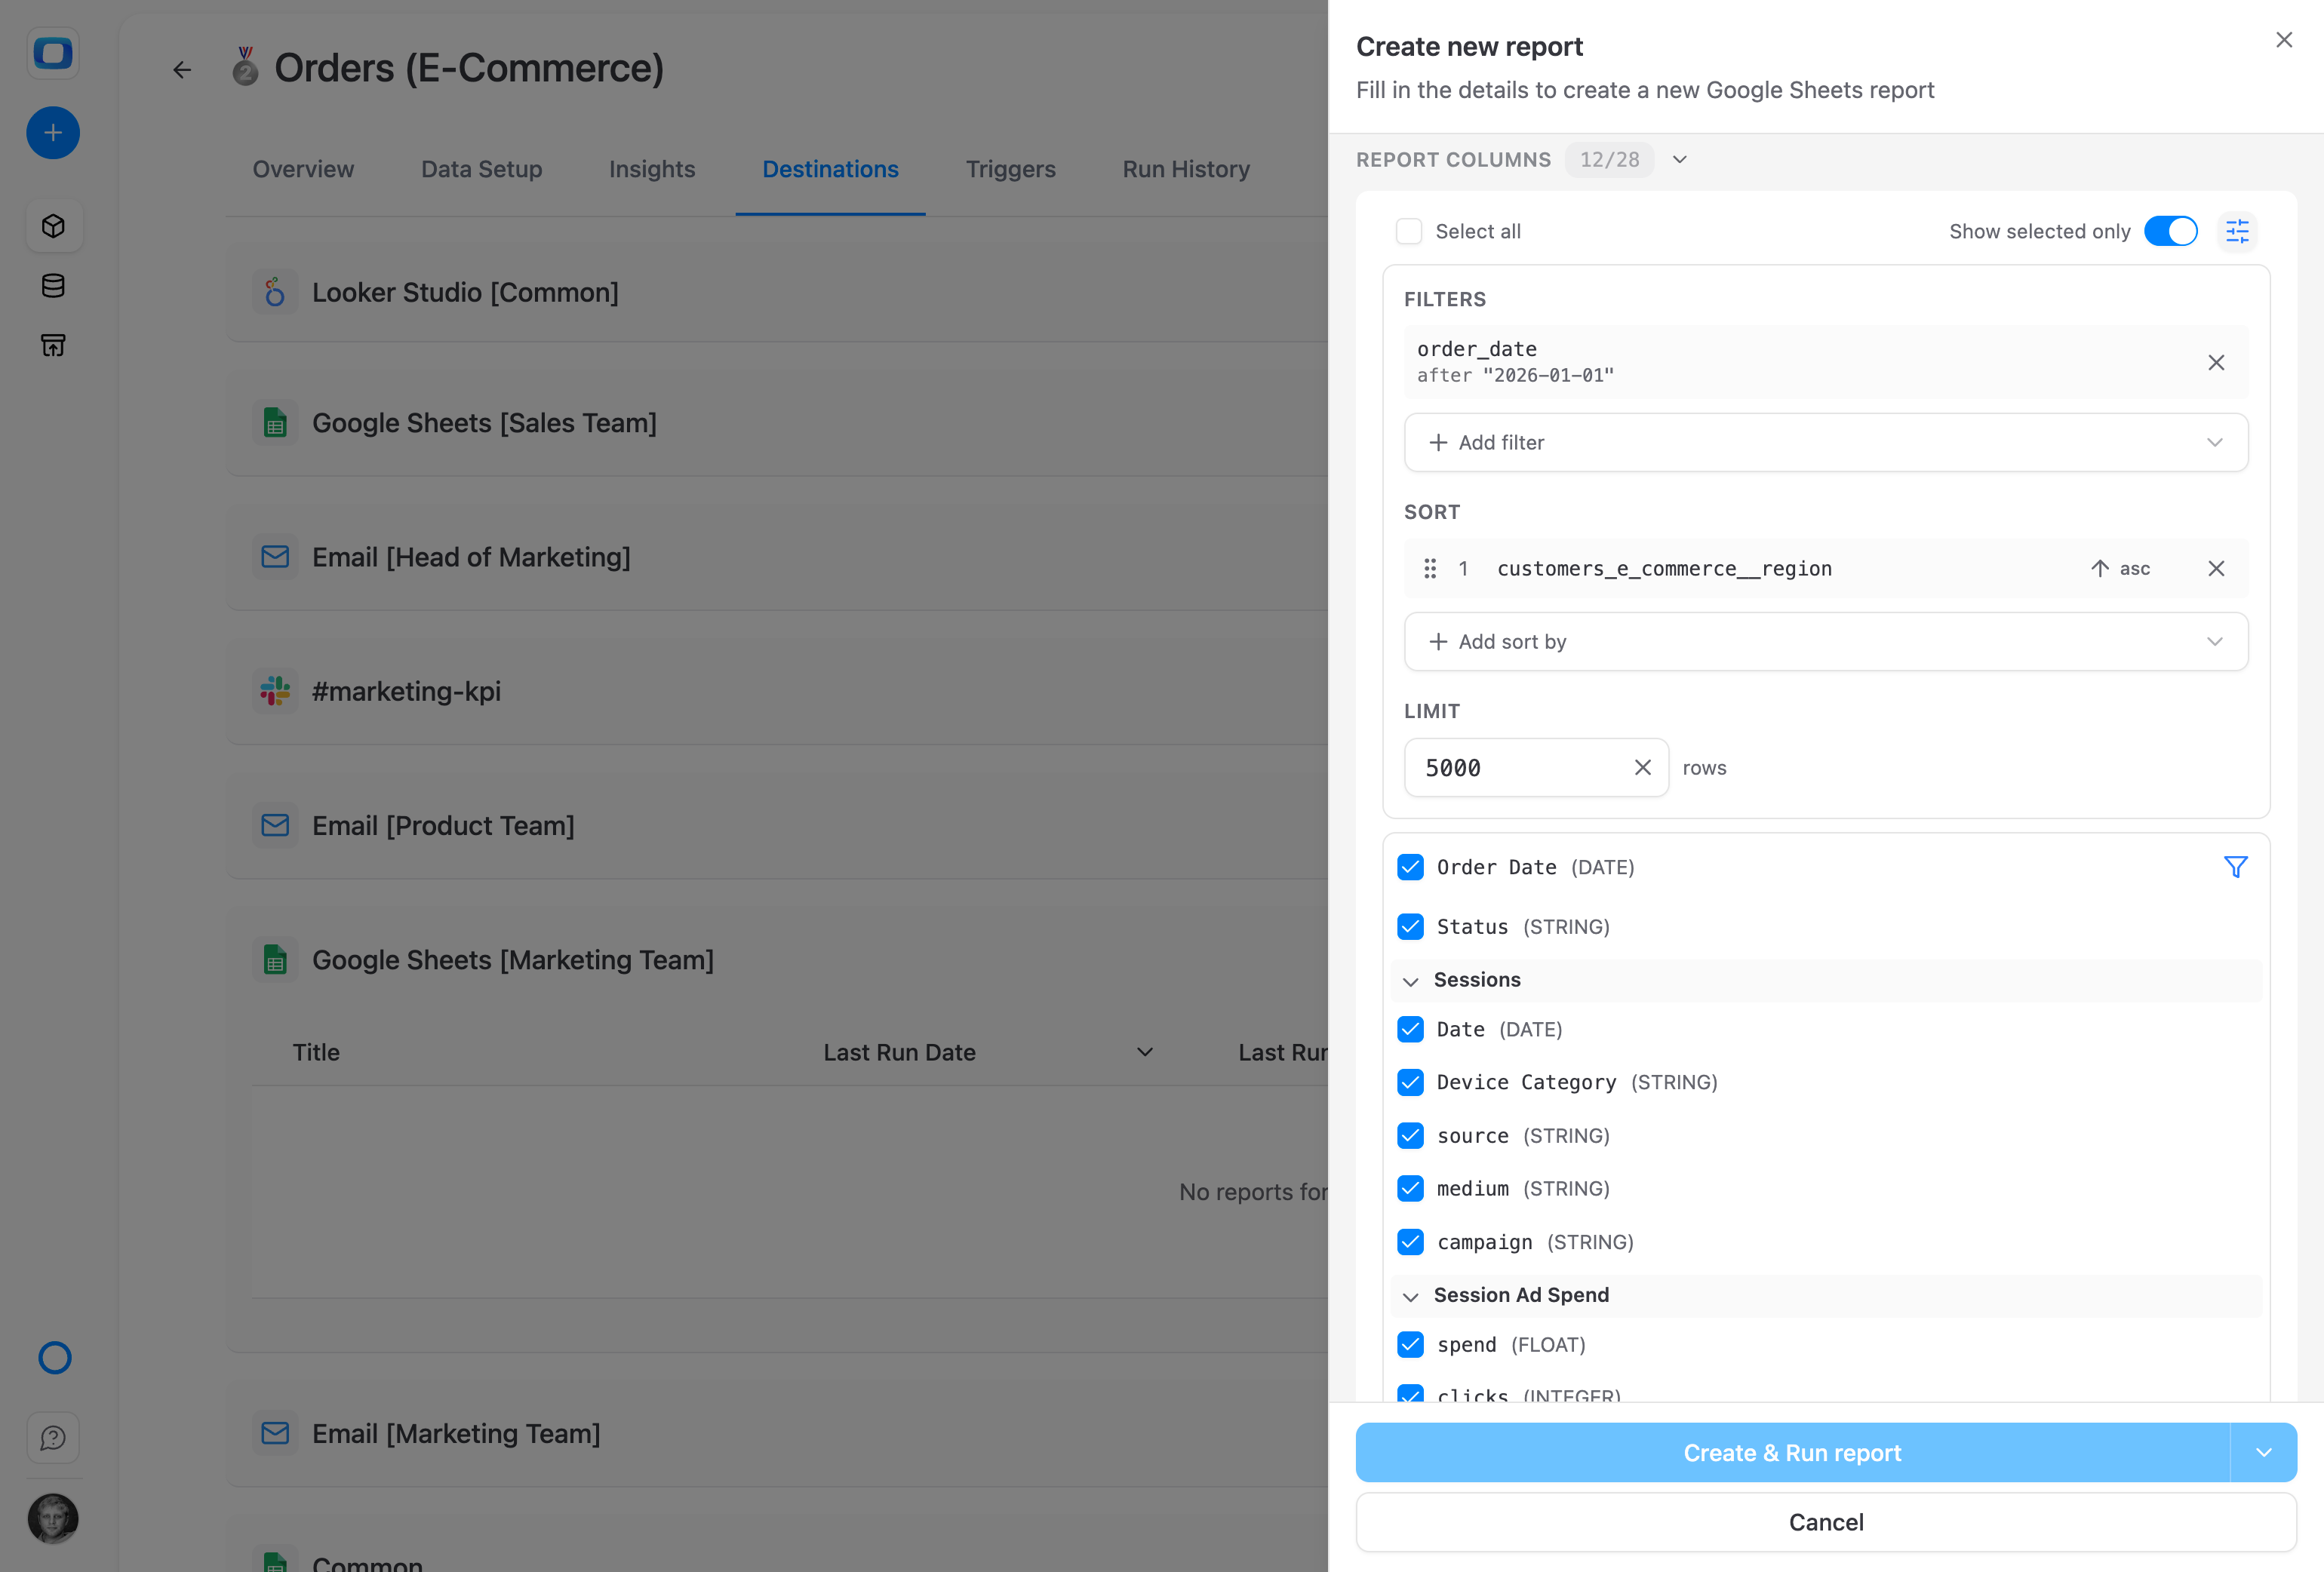
Native and joined fields appear in the same picker — in Google Sheets Extension, Looker Studio, or AI prompts. Just pick the columns you need; the join runs behind the scenes.
New CRM field today? Add it to the Data Mart, expose it in the relationship, and every existing report can use it tomorrow. No quarterly modeling sprints.
Most flexible & free
Self-managed, full control
Community
Forever free & growing on GitHub
For teams automating reporting in Corporate DWH while valuing data autonomy: gaining full control over data connectivity and enablement
MOST POPULAR
Best for teams
Team
Starts at $875/mo + $35/seat (5 seats included)
For small and mid-size teams looking to automate collaborative reporting & get AI insights
For security-first teams
Enterprise
Custom contract
For organizations looking for a tailored self-managed solution with an extra layer of flexibility, security & support included
Outcomes your company gets the moment your data marts go live.
Define KPIs once in a semantic layer and reuse them across reports, tools, and teams without rewriting logic.
Track revenue, CAC, margin, and more – from a single governed system that aligns every stakeholder.
Make confident decisions faster, knowing everyone sees the same numbers and definitions.
Back every number with transparent, standardized logic – ready for stakeholder reviews or audits anytime.
Stats with comment threads attached — like a colleague verifying your numbers in a shared sheet.
Connected BigQuery, set up 37 data marts, built a data model and had live reports in Sheets in under 15 minutes. My team thought I was joking when I showed them how they can now get live reports right in their sheets.
Declare your first join in minutes — and let every report pull blended data, no SQL required.


We migrated 200+ reports from Looker to OWOX Data Marts. Our team now self-serves without filing a single Jira ticket. Easily the best infrastructure decision we made this year.