What Is Visual Representation in Data Modeling?
Visual representation in data modeling refers to the use of diagrams and charts to map how data flows, connects, and is structured.
Instead of relying only on technical descriptions or raw schema definitions, visual models provide a clear picture of relationships between data entities, making it easier for both technical and non-technical stakeholders to understand the structure and flow of information.
Importance of Visual Representation in Data Modeling
Visual representations make complex data models more accessible and easier to understand. They help teams align on shared data definitions, identify redundancies or gaps, and improve collaboration across departments. For analysts and decision-makers, these diagrams bring clarity to what data exists, how it connects, and how it supports business logic. Visuals also speed up onboarding, reduce miscommunication, and support better data governance.
How Visuals Are Used in Data Modeling
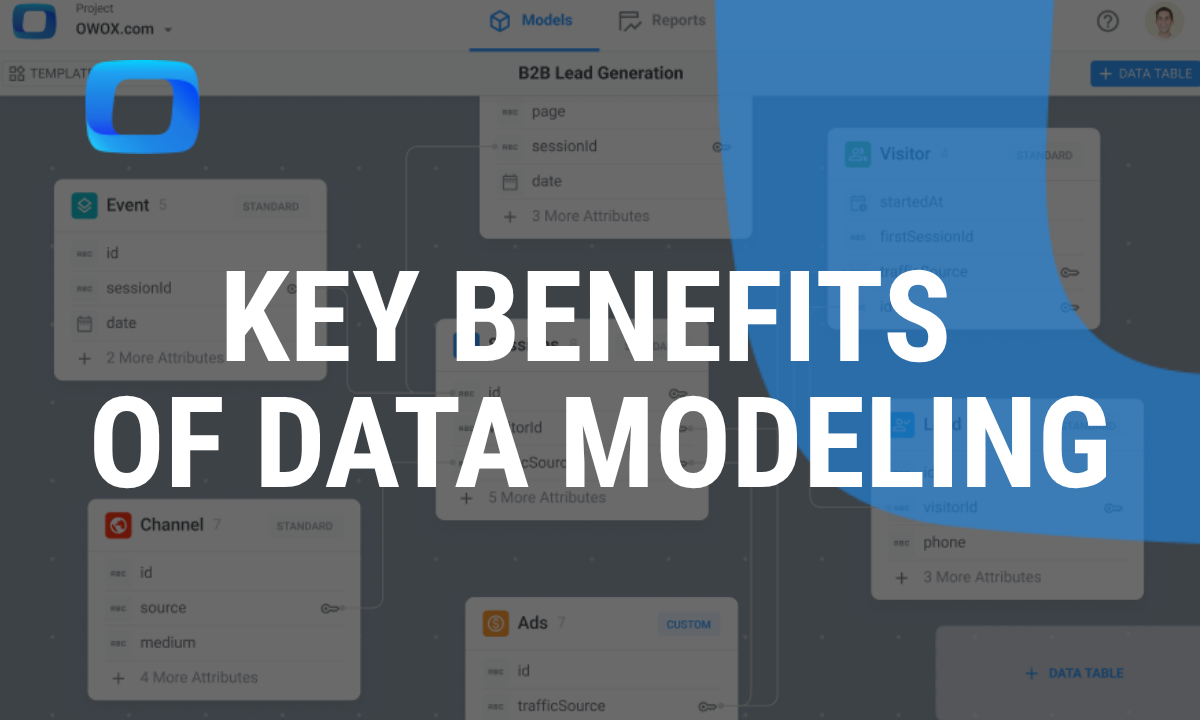
Visuals in data modeling typically show entities (like tables), their attributes (columns), and the relationships between them. Tools such as ER diagrams, star and snowflake schemas, and UML diagrams are commonly used to depict how data moves and transforms across systems. These visuals help teams design, communicate, and validate data models before they’re implemented in databases or analytics platforms.
Types of Visual Representation in Data Modeling
Common visual formats used in data modeling include:
- Entity-Relationship Diagrams (ERDs): Map entities, attributes, and relationships.
- Star Schema Diagrams: Show fact tables and related dimension tables for analytics.
- Snowflake Schemas: A more normalized version of the star schema.
- UML Class Diagrams: Represent data objects and their relationships, often used in software development.
- Flowcharts: Visualize data movement and transformations across systems.
Each serves different modeling and communication needs depending on the project stage and audience.
Challenges with Visual Representation in Data Modeling
While visuals can simplify understanding, they also introduce challenges:
- Limited customization: Some tools don’t offer the flexibility to tailor visuals for specific audiences or use cases.
- Data overload: Large volumes of data can make diagrams overwhelming and reduce clarity.
- Integration barriers: Visualization tools may not integrate well with existing systems or modeling workflows.
- Misinterpretation risks: Without clear labeling and context, stakeholders may misread relationships or data flows.
- Data quality concerns: Outdated or inaccurate visuals can lead to misinformed decisions.
- Security exposure: Diagrams might unintentionally reveal sensitive schema details.
- Tool cost constraints: Advanced modeling platforms may be expensive or inaccessible to some teams.
These issues can undermine the effectiveness of visual modeling if not managed properly.
Best Practices for Visual Representation in Data Modeling
Following proven practices can make visual models more effective, accurate, and easier to work with.
- Keep it simple: Focus on clarity and avoid unnecessary complexity.
- Use standard symbols: Adopt a consistent notation (e.g., crow’s foot for ERDs).
- Group logically: Organize entities by subject area or business process.
- Maintain alignment with schema: Ensure visuals reflect the current state of the database.
- Provide legends and labels: Help viewers interpret relationships and objects.
- Review regularly: Update diagrams as models change and use them in documentation.
- Tailor to the audience: Create high-level visuals for business teams and detailed ones for developers.
Visual modeling is essential for effective communication, governance, and execution in modern data systems. Whether designing a new warehouse, cleaning legacy systems, or aligning data across teams, visuals bring structure and understanding. Well-designed diagrams support smoother collaboration, help stakeholders grasp relationships quickly, and provide a reliable reference for future updates and decision-making.
Simplify Visual Representation in Data Modeling with OWOX Data Marts
Creating clear visual representations of data models helps teams understand relationships, hierarchies, and flows, but maintaining accuracy as systems evolve can be challenging. With OWOX Data Marts, every dataset, join, and transformation is documented and structured automatically, making it easy to visualize data relationships across your stack. This transparency supports collaboration, troubleshooting, and model governance.


.png)


Finally, a tool that doesn't ask business users to learn a new dashboarding UI. Our marketing team already knows Sheets. OWOX just delivers the right data.
Joinable data marts concept was the thing that sold us. We can now use the semantic layer without building one.
Self-hosted the OSS version on Digital Ocean. Zero vendor lock-in. Contributed a Shopify connector back in week two.