
Why Your GA4 Export to BigQuery is Useless without Data Modeling
Struggling with GA4 events data in BigQuery? Discover how data modeling turns chaos into clarity and enables self-serve analytics.

.png)
You’d think having all your GA4 data in BigQuery would finally solve your reporting problems. After all, the raw data is all there, ready to be queried. But the moment you dive in, the excitement fades.
You’re met with nested fields, cryptic custom parameters, and inconsistent formats. Instead of quick insights, you get hours of cleanup. Without a clear data model, your GA4 export doesn’t unlock value - it hides it.
In this article, we’ll explain why GA4 exports are tough to work with straight out of the box. We’ll also cover how data modeling fixes these issues, what a clean setup looks like, and how tools like OWOX BI help simplify it all.
The Harsh Truth About [GA4] BigQuery Export
Exporting GA4 data to BigQuery starts off exciting, but the reality is messy. Nested fields and unclear parameters make analysis confusing. Most teams give up early. Here, we’ll cover why GA4 exports feel overwhelming and what makes them so hard to work with.
GA4 Export Tables Are Complex
GA4 exports look massive and unorganized at first glance. With so many columns with unclear field names, it’s hard to know where to begin. The sheer volume and inconsistency quickly turn excitement into confusion for most data analysts & teams.
Overload of Nested Fields and Custom Params
GA4 lets you create unlimited custom events and parameters, which sounds useful at first.
But each event stores its details in nested arrays as key-value pairs, making the data hard to access.
Something as simple as a button click label is buried several layers deep. When events don’t follow a consistent format, things get even more confusing for analysts.
Analysts Give Up After First Export
Most data teams begin their GA4 to BigQuery export expecting easier reporting. But once they see the complex schema, unclear event names, and lack of session structure, things fall apart.
Some give up entirely, while others spend hours just trying to understand the basics. Without a proper data model, it’s hard to move forward or trust the results.
GA4 Raw Data Is So Hard to Work With
GA4 sends event-based data that’s hard to organize. There’s no clear session structure, and key details are buried deep inside fields. Without cleanup and modeling, even simple questions become difficult to answer in BigQuery.
No Sessions Table, Just Events Everywhere
GA4 uses an event-based structure, which means it doesn’t include a sessions table like Universal Analytics did. There’s also no built-in session ID in many cases. As a result, grouping events into user sessions isn’t straightforward. You have to manually create logic to define session boundaries, which adds complexity and increases the chances of getting inaccurate results.
User Identification Isn’t Straightforward
GA4 doesn’t rely on one consistent user ID. It may use user_pseudo_id, user IDs (if they’re set), or other google signals to track users. But these identifiers aren’t always present or reliable.
This inconsistency makes it difficult to link user activity across different sessions or devices. Without a stable identifier, following a user’s full journey becomes guesswork instead of accurate tracking.
Important Parameters Buried in event_params Arrays
In GA4, important information like page titles, button clicks, or campaign sources isn’t stored in regular columns.
Instead, these values are hidden deep inside the event_params array. To extract them, you must unnest ga4 event parameters and then find the specific key-value pair you need.
This process adds several steps to every query, making basic analysis more complex than it should be.
UNNEST and CASE Are Required for Simple Field Access
Even pulling simple data points like the page URL or traffic source requires extra work in GA4’s BigQuery export. You have to use SQL functions like UNNEST to flatten nested fields and CASE statements to extract the right values.
What should be a basic query becomes a long, multi-step process, slowing down your analysis and increasing the chance of making mistakes.
Joining GA4 Tables in BigQuery Is Difficult
Connecting GA4 data across users, sessions, and events isn’t easy. It’s just the single table, that you need to somehow split into different objects or tables, and they might not have clear relationships or consistent keys.
As a result, building reports often means writing complicated logic just to stitch the right data together.
Tracing the Full User Journey Is Nearly Impossible
Following a user’s full path, from their first event to becoming a lead, should be simple. But GA4’s export makes it extremely difficult. There are no clean, relational keys to connect events, sessions, and leads. Identifiers like user_pseudo_id are scattered and inconsistent.
As a result, analysts have to create complicated logic and make assumptions just to stitch together the journey, often ending up with unreliable insights.
Inconsistent Naming and Timestamp Logic Break Joins
GA4 exports rely heavily on fields like event_timestamp and user_pseudo_id, but these fields don’t always work the same way across records. Sometimes, all events in a batch share the same timestamp, even if they happened at different moments.
Without a clear event order or a standardized session structure, joining data becomes fragile. This leads to issues like duplicate sessions or incorrect attribution, making accurate reporting a major challenge.
Hacking Queries Replaces Insightful Reporting
GA4’s export schema is so complex that even basic reports require advanced SQL. Analysts constantly rely on functions like UNNEST, COALESCE, and MAX to break apart nested fields, extract values, and clean up the results.
This process can be time-consuming and error-prone. Instead of digging into insights, teams get stuck rewriting the same long queries, slowing down decision-making and reducing data confidence.
You Can’t Trust GA4 Reports Without a Data Model
GA4’s raw data often gives different results depending on how it’s queried. Without a structured data model, metrics can be inconsistent and confusing. This leads to dashboards that no one fully trusts or depends on.
Same Metrics Often Produce Different Results
In GA4, even basic numbers like “session count” can vary depending on how and where you look. Without a data model, these differences lead to confusion and wasted time
For the same date range, numbers might differ like this:
- GA4 UI shows 2,450 sessions
- BigQuery shows 2,780 sessions
- Looker Studio connected to GA4 shows 2,520 sessions
These gaps happen due to missing filters, improper handling of repeated event IDs, or inconsistent use of user identifiers.
A structured model removes this guesswork and builds trust.
Attribution Models Break Without a Defined Flow
Attribution works best when you can clearly follow a user’s journey, from the first click to conversion. But in GA4 exports, those connections are broken. There’s no clean flow linking visitors to sessions and sessions to traffic sources. Everything is fragmented, and piecing it together takes guesswork.
Without a structured data model, marketing teams can’t confidently say which channel or touchpoint actually drove a lead or sale. This weakens decision-making and makes it harder to optimize campaigns based on real performance.
More Time Debugging, Less Time Delivering Value
Instead of analyzing trends or exploring new insights, analysts working with raw GA4 data often find themselves stuck in cleanup mode. They spend hours unnesting fields, fixing broken joins, and applying filters just to make reports accurate. Every new request feels like starting from scratch.
This constant back-and-forth slows down the team and reduces productivity. Without a clean data model, reporting becomes a technical burden, leaving less time for valuable, insight-driven work that actually supports business goals.
How to Get Clean and Usable GA4 Data
Making sense of GA4 exports doesn’t have to be a struggle. With the right structure in place, you can turn messy, raw data into clean, reliable tables that are ready for reporting and analysis.
Start with a Marketing Reporting Data Model
Using GA4 data becomes much easier when you organize it around how marketers think. A marketing reporting data model does exactly that. Instead of raw, unstructured events, it groups data into clear categories like users, sessions, events, and conversions. This gives you a cleaner, more intuitive way to understand performance.
With this structure, you don’t need to constantly reshape or unnest data. It mirrors your reporting needs, helping you answer business questions faster and with more confidence.
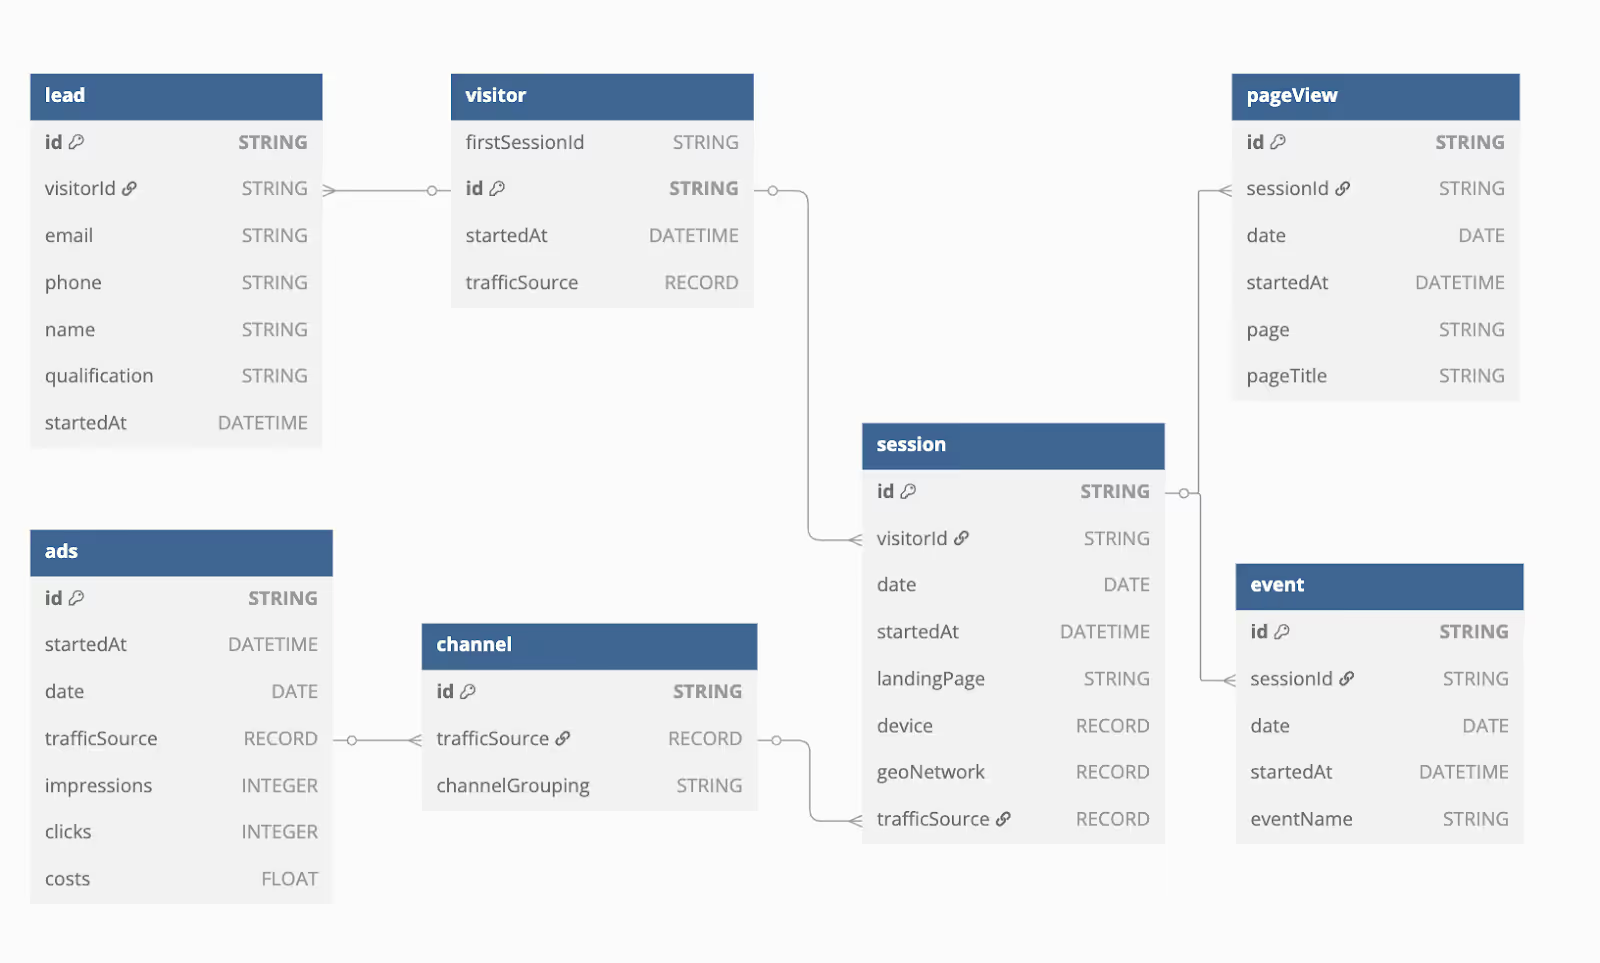
Build Key Modeled Tables for Reliable GA4 Reporting
In a well-modeled GA4 dataset, raw nested events are turned into flat, ready-to-use tables that reflect each stage of the user journey:
- Visitor: Stores user IDs and properties like device type and location.
- Session: Includes session start time, traffic source, and engagement data.
- Event: Logs user actions with key event details and campaign tags.
- PageView: Tracks page titles, URLs, and related session info.
- Lead: Connects conversions to CRM or purchase data.
- Ads: Merges ad spend and click data from platforms like Google and Facebook.
- Channel: Groups traffic into buckets like “Paid Search” or “Organic Social.”
These tables simplify joins, improve consistency, and support accurate, business-friendly reporting.
Use Consistent Keys and Pre-Modeled Joins for Easy Queries
When your GA4 data uses consistent keys like visitor_id, session_id, lead_id and event_id, everything becomes easier to connect. These identifiers allow you to reliably join tables without running into mismatches or confusing results. It saves time and reduces errors in reporting.
Pre-modeled joins also make query writing simple. Since the relationships between users, sessions, and events are already defined, analysts don’t need to build logic from scratch. This boosts efficiency and makes data analysis more reliable.
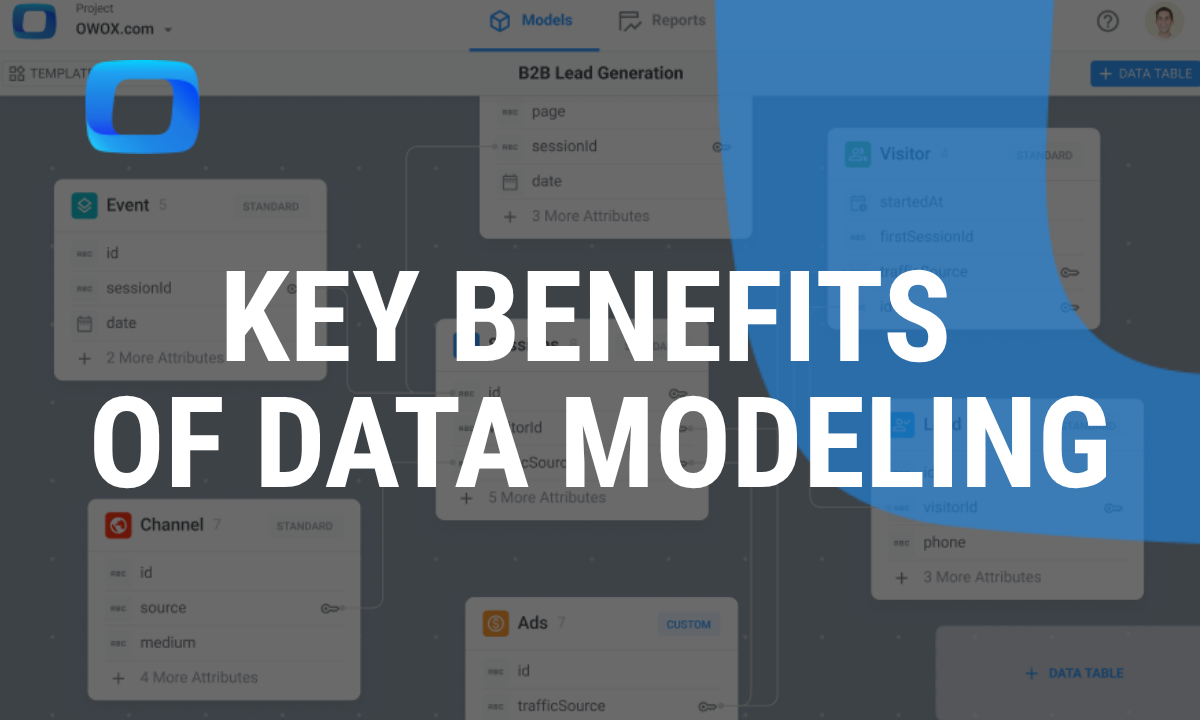
How Data Modeling Unlocks Reliable and Efficient Reporting
Data modeling turns GA4’s complex exports into clean, easy-to-use tables. The benefits of data modeling include helping teams get faster answers, build accurate reports, and connect data across platforms, without writing complicated SQL every time a new question comes up.
Instantly Analyze Conversion Rates and Funnel Drop-Offs
A structured data model helps you quickly measure how users move through your funnel. By organizing events step-by-step, like landing page, product view, and purchase, you can clearly see where people drop off. This makes it easier to spot problem areas and take action to improve conversion rates without spending hours fixing raw data first.
Seamlessly Integrate Ad Spend, CRM, and Web Data
With a strong data model, combining GA4 data with ad platforms, CRM tools, and website activity becomes smooth. This creates a complete view of how users interact with your brand, from ad click to purchase. It helps marketing teams track ROI, understand customer behavior, and plan better strategies using all their data in one place.
Transition from Complex Queries to Trustworthy Metrics
Data models use consistent keys and relationships, so you don’t need to write long, complicated SQL just to get a simple metric. Pre-modeled joins make querying easier, and the numbers stay accurate across reports. This saves time, improves trust in your data, and keeps teams aligned on what the metrics really mean.
Pre-Aggregated Data Enables Faster Dashboards
Pre-aggregating data means summarizing it before you build reports, like storing monthly totals instead of daily rows. This makes dashboards load much faster, especially for time-based metrics or large datasets. It reduces the pressure on your BI tools and helps teams get results quickly, without waiting for queries to run every time.
Indexing Critical Columns Reduces Report Load Time
Indexing helps your database find data faster. By creating indexes on key columns like dates or user IDs, reports run quickly without scanning the whole dataset. It’s important to index the right fields, so reports stay fast without slowing down data updates. The result: smoother performance and quicker insights.
Empower Teams with Self-Service Access to Modeled Data
A clean, well-organized data model makes it easy for non-technical users to build reports on their own. When tables and columns have clear names and related data is grouped logically, teams don’t need SQL skills to find what they need. This saves time, reduces dependency on analysts, and boosts confidence in reporting.
How OWOX BI Instantly Models Your GA4 Data for Marketing Reporting
In this section, we’re covering how OWOX BI simplifies the entire GA4 to BigQuery experience. From automatic data structuring to seamless integrations, you’ll see how it saves time and removes the pain of manual data modeling.
Schema Built from Thousands of Real Marketing Setups
OWOX BI’s data model isn’t built in a vacuum, it’s shaped by real-world marketing needs. Based on thousands of setups from actual clients, the model is designed to capture sessions, leads, channels, and campaigns clearly. It reflects how marketing teams work, so you get a structure that makes sense for reporting, analysis, and decision-making.
Automatically Connects GA4, Ads, and CRM Data
With OWOX BI, you don’t need to stitch together data manually. The platform automatically connects your GA4 export with ad sources like Google Ads or Facebook Ads, and even your CRM. This gives you a full-funnel view of customer behavior, from first click to final conversion, without spending hours on custom data engineering.
Fully Compatible with BigQuery - No Extra Tools Required
OWOX BI runs inside your existing BigQuery environment. There’s no need for third-party connectors, separate data pipelines, or extra storage tools. You simply plug in your GA4 export, and the model handles the rest. It’s a simple, fast setup that works with what you already have, saving time and avoiding complexity.
BI-Ready Data for Instant Reporting Anywhere
The OWOX BI data model works smoothly with tools like Looker Studio, Google Sheets, Tableau, or Power BI. Your GA4 data is already cleaned and structured, so you don’t need extra prep work. Just connect and start building reports with reliable metrics. It saves time and ensures consistency across every dashboard, with no technical setup or complex queries needed.
Explore the GA4-Ready Data Model from OWOX BI
If you're tired of spending hours trying to make sense of GA4 data in BigQuery, it's time for a better approach. OWOX BI gives you a fully-modeled, ready-to-use data structure built specifically for marketers and analysts. It simplifies complex exports into clean tables with reliable relationships, so you can focus on insights, not SQL.
Forget about nested fields, broken joins, and confusing metrics. With OWOX BI, your GA4 data is structured, consistent, and easy to report on across any BI tool.
Frequently asked questions

![[GA4] BigQuery Export: How to UNNEST GA4 Event Parameters](https://cdn.prod.website-files.com/676a9690ef4ec151a69571ff/6a0df0f9a3040c9da9d17f10_%5BGA4%5D%20BIGQUERY%20EXPORT.png)
![[GA4] BigQuery Export: How to Extract GA4 User Properties and Metrics](https://cdn.prod.website-files.com/676a9690ef4ec151a69571ff/6a0df068d5295fb916194309_%5BGA4%5D%20BIGQUERY%20EXPORT.png)


Finally, a tool that doesn't ask business users to learn a new dashboarding UI. Our marketing team already knows Sheets. OWOX just delivers the right data.
Joinable data marts concept was the thing that sold us. We can now use the semantic layer without building one.
Self-hosted the OSS version on Digital Ocean. Zero vendor lock-in. Contributed a Shopify connector back in week two.