
How to Use Query History Log in BigQuery?
Discover how to use the Query History Log in BigQuery to review past queries, improve efficiency, and manage database performance.

Ever wished you could go back and see exactly what queries you or your team ran in BigQuery? Querying history logs makes it easy to look back and see exactly what happened. They let you revisit past queries, figure out what went wrong, and build on what worked, whether you’re debugging an issue or just checking data access.

In this article, we’ll explain what query history logs are, how to access them, and why they matter. You’ll learn how to view past queries, use audit logs for compliance, and analyze query performance. We’ll also cover advanced tips, common issues, and tools to simplify your workflow.
Introduction to Query History Logs in BigQuery
Query history in BigQuery helps you keep track of all the queries you’ve run automatically. This built-in feature saves every query, making it easy to revisit and learn from your past work. Whether you’re fixing an issue or building on previous analysis, having this history speeds up your workflow. It acts like a timeline of your data exploration.
Looking at past queries also helps you understand how your analysis has changed over time. You can spot trends, improve future queries, and make better decisions using this information. In short, query history is a simple but powerful way to manage and improve your work in BigQuery.
Benefits of Query History Logs in BigQuery
Query history logs in BigQuery offer more than just a record of past queries; they help you work faster, smarter, and more accurately. In the sections below, we’re covering key benefits like reuse, performance tuning, accuracy, and team collaboration.
Improve Efficiency by Reusing Past Queries
Query history in BigQuery helps you save time by letting you reuse queries you’ve already written. Instead of starting from scratch every time, you can copy and adjust past queries to fit new tasks. This is especially useful for recurring reports or analyses. Over time, it saves you effort and helps you get more done by cutting out repetitive manual tasks.
Ensure Accuracy with Reference to Successful Queries
Using past successful queries as a reference helps maintain accuracy in your analysis. When you're unsure how to approach a task, looking at queries that previously delivered correct results gives you a strong starting point. This practice supports consistency across projects and ensures that you're applying trusted logic to new data problems.
Optimize Performance Through Historical Query Analysis
Your query history is a great way to find slow or inefficient queries. By reviewing execution time, slot usage, and other metrics, you can spot areas that need improvement. Tweaking complex logic or removing unnecessary joins can make a big difference. These small fixes help speed up your queries and reduce BigQuery costs over time.
Support Collaboration and Knowledge Sharing
Teams work better when they can see what others have done. BigQuery’s query history lets users review each other’s queries, learn from past work, and build on successful examples. This makes handovers easier and encourages better teamwork. Sharing queries saves time and disseminates useful knowledge across your team without requiring additional meetings.
Key Features of BigQuery Query History Logs
BigQuery query history logs offer detailed records of every executed query, including timing, status, and resource usage. In this section, we’re covering the key details these logs provide and how they help with performance tracking and analysis.
Information Provided in Query History Logs
BigQuery’s query history section gives you a full list of the queries you’ve run, along with important details like execution time, query ID, and resource usage. This view helps you understand when each query ran and how much data it processed. You can also use filters to narrow results by date, user, or query content.
Having access to this information makes it easier to track your work and see how your queries have evolved. It’s especially useful when you’re trying to debug something or want to reuse a previous query, keeping everything organized and easy to find.
BigQuery Query History for Performance Analysis
When analyzing query performance, your history log gives access to key metrics like duration, bytes processed, and slots used. These figures help you spot slow or costly queries that may need optimization. High resource use often points to complex joins or unfiltered data scans that could be improved.
BigQuery also shows query plans and error messages within the history view. These tools help you find performance bottlenecks and troubleshoot problems. Over time, reviewing this data helps you write faster, cleaner queries and manage your BigQuery resources more effectively.
Audit Logs vs. Query History: Compliance and Security Insights
While query history focuses on executed queries and their performance, audit logs track a much broader range of user activities. These include who accessed what data, when it happened, and what they did with it. That’s why audit logs are so important for security checks and keeping things accountable in BigQuery.
Audit logs help detect unusual behavior, such as unauthorized access or sudden spikes in data activity. They’re also key for meeting compliance needs, since they record detailed system events. Unlike query history, audit logs capture everything from job creation to permission changes, making them critical for audits and regulatory checks.
How to Query History Logs in BigQuery?
Querying history logs in BigQuery helps you retrieve detailed records of past jobs, including queries, loads, and exports. In this section, we’ll show you how to access these logs using both the BigQuery interface and SQL-based system views.
Navigate to the Job History Section in the BigQuery Console
To review query history activity in BigQuery, navigate to the Job History section.
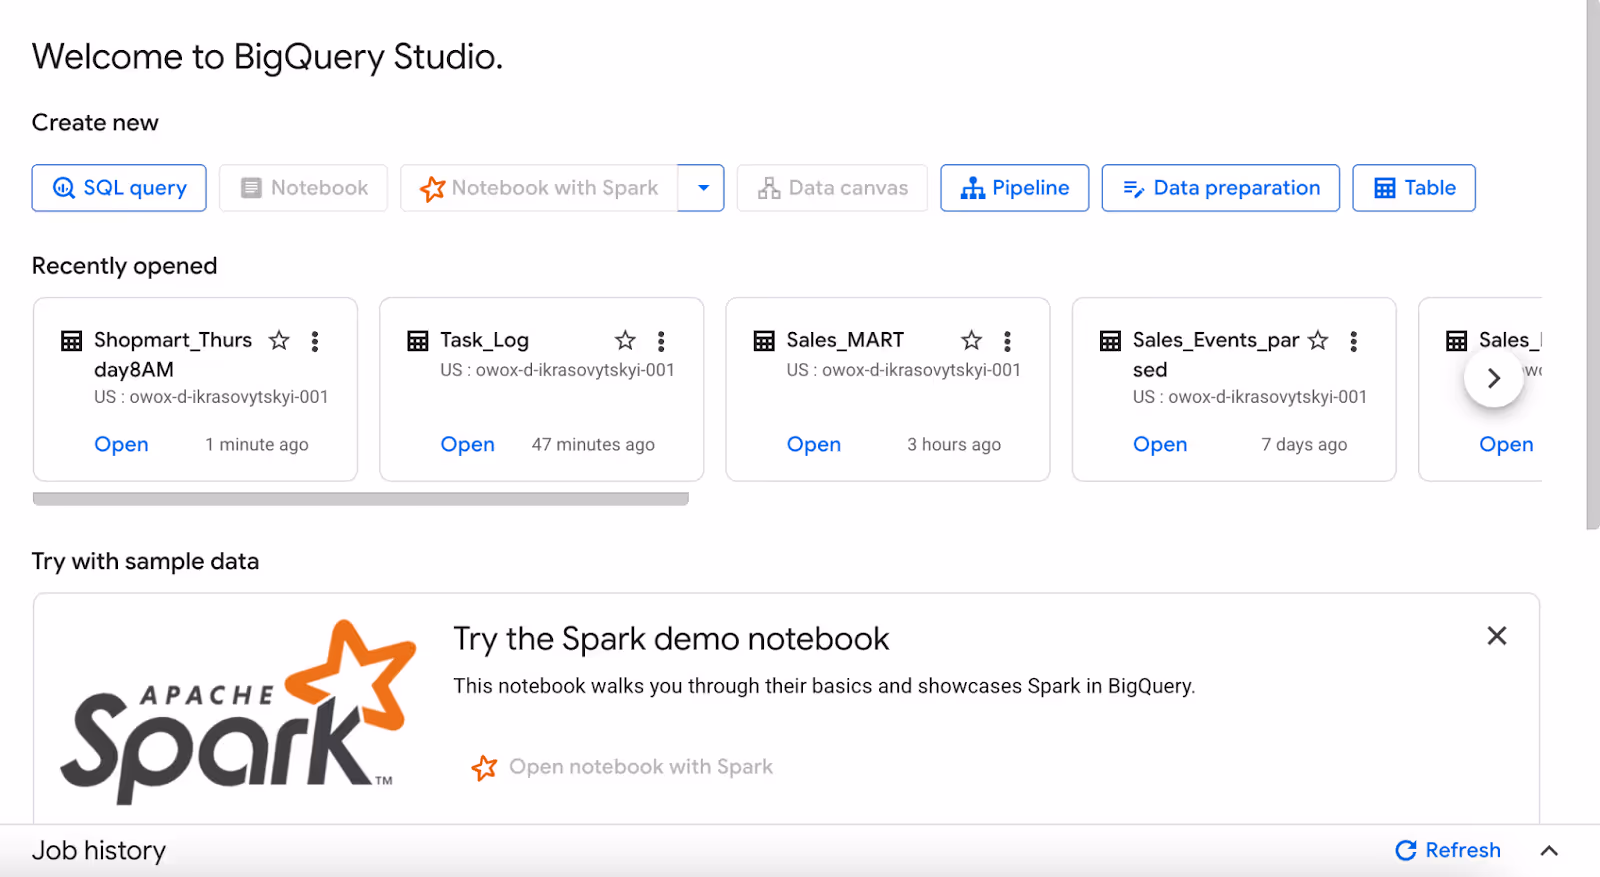
Once you click on the arrow beside the “Refresh” option, a window of history will pop up.
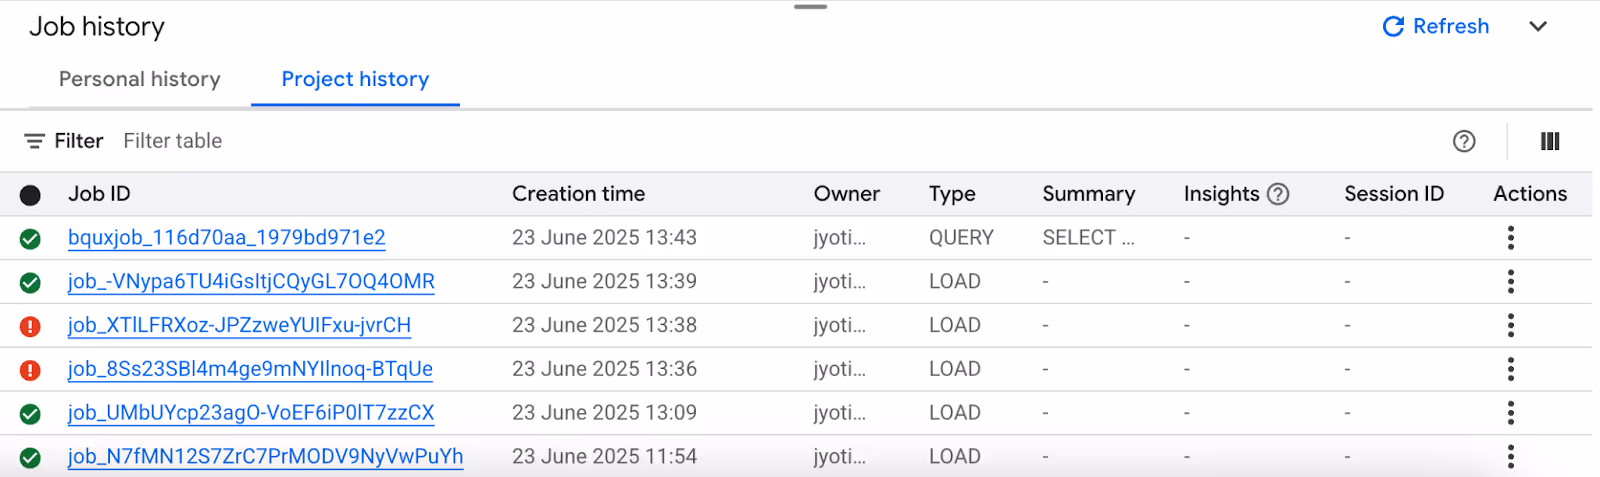
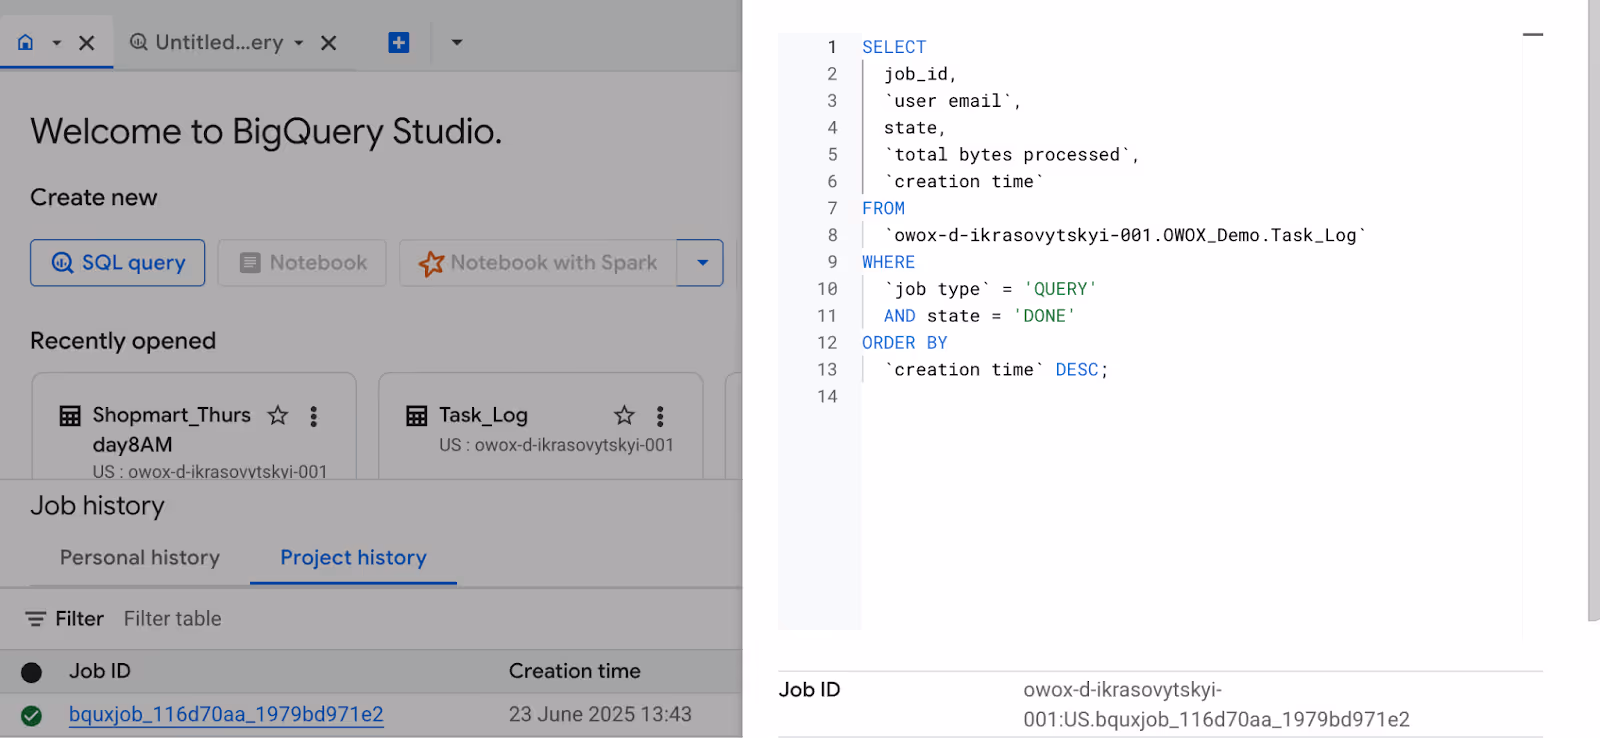
You can click on each one and see the query used.
View Query History with INFORMATION_SCHEMA.JOBS
You can also access query history using SQL by querying the INFORMATION_SCHEMA.JOBS view. It shows metadata for all jobs in your project, including queries, loads, and exports.
Using INFORMATION_SCHEMA.JOBS
The INFORMATION_SCHEMA.JOBS view gives you details about every job that’s run in your BigQuery project, whether it’s a query, a data load, or an export. It’s a handy way to track what’s been done and how well it performed.
Example:
Suppose you want to review all completed query jobs across the project to see who ran them and how much data they processed. The query below lists all successful jobs, ordered by when they were created.
1SELECT
2  job_id,
3  user_email,
4  state,
5  total_bytes_processed,
6  creation_time
7FROM
8  `region-us`.INFORMATION_SCHEMA.JOBS
9WHERE
10  job_type = 'QUERY'
11  AND state = 'DONE'
12ORDER BY
13  creation_time DESC;
Here:
- job_id, user email, state: Identifies the job and its completion status.
- Total bytes_processed: Shows how much data the query scanned.
- creation_time: Used for sorting queries by when they were run.
- Filters: Focuses on QUERY jobs that were successfully completed.
This query helps you monitor completed queries, track resource usage, and analyze when each query was run. It’s a simple way to review performance and spot trends across your BigQuery jobs.
Using INFORMATION_SCHEMA.JOBS_BY_USER
The INFORMATION_SCHEMA.JOBS_BY_USER view shows job metadata for only the currently logged-in user. It’s helpful when you want to review your query activity without seeing jobs run by others in the project.
Example:
Suppose you want to review your recent successful queries and see how much data each one processed, without viewing jobs from other users. The query below lists only your completed query jobs, sorted by the most recent.
1SELECT
2  job_id,
3  state,
4  total_bytes_processed,
5  creation_time
6FROM
7  `region-us`.INFORMATION_SCHEMA.JOBS_BY_USER
8WHERE
9  job_type = 'QUERY'
10  AND state = 'DONE'
11ORDER BY
12  creation_time DESC;
Here:
- job_id, state: Identifies each job and confirms it completed successfully.
- total_bytes_processed: Displays the volume of data scanned per query.
- creation_time: Orders the jobs from most recent to oldest.
- View scope: Automatically filters results to only show your own jobs, no need to specify your email.
This provides a clear view for individual users who want to review, debug, or optimize their own BigQuery queries. It removes noise from shared project history, helping you stay focused on your activity.
Advanced Techniques for Query History Analysis
BigQuery offers more than just viewing past queries. You can use tools to track query performance and even automate the process. Below are two simple ways to do this effectively.
Integrating Query History with Monitoring Tools
You can connect BigQuery query history to tools like Looker Studio or Cloud Monitoring to track performance visually. Using labels in INFORMATION_SCHEMA.JOBS, you can identify Looker Studio-triggered jobs, monitor usage, and troubleshoot reports more efficiently.
Example:
Suppose you want to identify which BigQuery jobs in the last 7 days were triggered by Looker Studio reports, along with the related report and data source URLs. The query below extracts those details using job labels.
1-- Define Looker Studio label keys and values
2DECLARE requestor_key STRING DEFAULT 'requestor';
3DECLARE requestor_value STRING DEFAULT 'looker_studio';
4
5CREATE TEMP FUNCTION GetLabel(labels ARRAY<STRUCT<key STRING, value STRING>>, label_key STRING)
6AS (
7  (SELECT l.value FROM UNNEST(labels) l WHERE l.key = label_key)
8);
9
10CREATE TEMP FUNCTION GetDatasourceUrl(labels ARRAY<STRUCT<key STRING, value STRING>>)
11AS (
12  CONCAT("https://lookerstudio.google.com/datasources/", GetLabel(labels, 'looker_studio_datasource_id'))
13);
14
15CREATE TEMP FUNCTION GetReportUrl(labels ARRAY<STRUCT<key STRING, value STRING>>)
16AS (
17  CONCAT("https://lookerstudio.google.com/reporting/", GetLabel(labels, 'looker_studio_report_id'))
18);
19
20SELECT
21  job_id,
22  GetDatasourceUrl(labels) AS datasource_url,
23  GetReportUrl(labels) AS report_url
24FROM
25  `region-us`.INFORMATION_SCHEMA.JOBS
26WHERE
27  creation_time > TIMESTAMP_SUB(CURRENT_TIMESTAMP(), INTERVAL 7 DAY)
28  AND GetLabel(labels, requestor_key) = requestor_value
29LIMIT 100;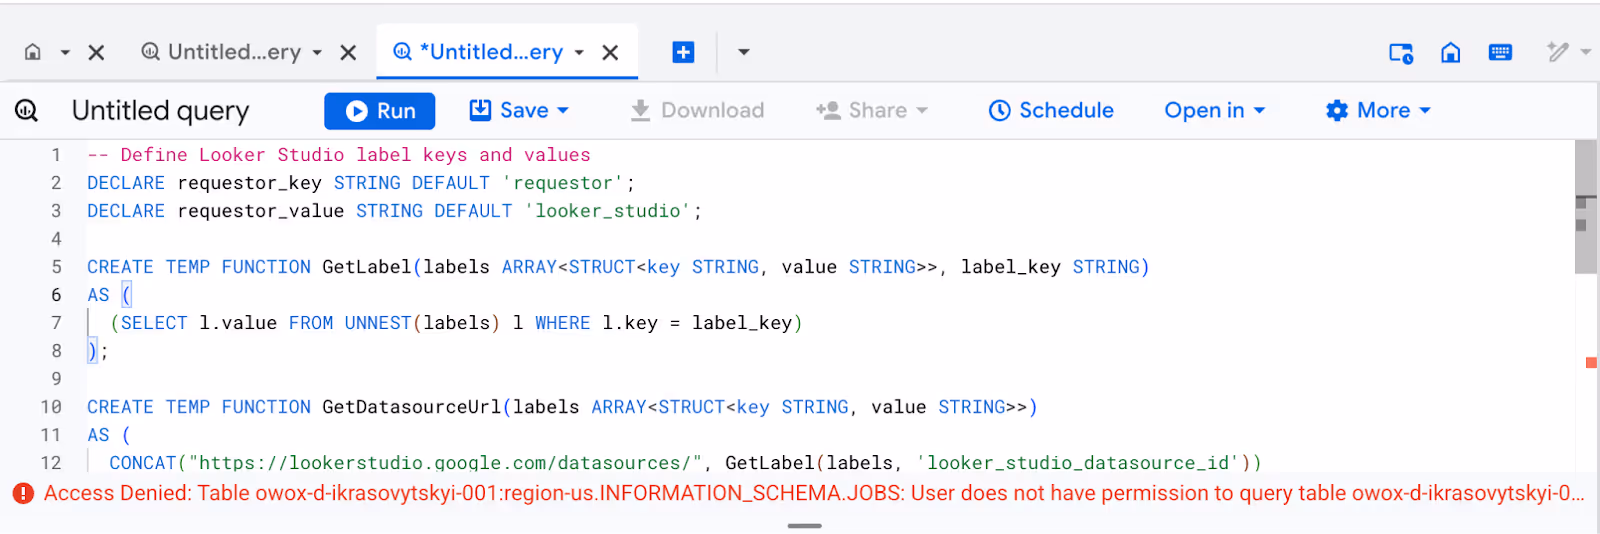
Here:
- Label extraction functions: These pull specific values from the job labels array.
- URL constructors: Builds direct links to Looker Studio reports and data sources.
- Time filter: Limits the result to the last 7 days of activity.
- Label filter: Includes only jobs triggered by Looker Studio.
This query helps you monitor which reports and dashboards are actively querying BigQuery. It’s useful for debugging, optimizing performance, or understanding Looker Studio usage patterns in your data workflows.
Automating Query History Analysis
You can save time by setting up scheduled queries to automatically analyze your query history and automate the analysis of your query history by setting up scheduled queries that run at regular intervals. This helps you track performance, spot issues early, and reduce manual effort.
Example:
Suppose you want to monitor all queries that scanned over 5 MB of data in the last 7 days. The scheduled query below will help you keep track of heavy queries automatically.
1SELECT
2  job_id,
3  user_email,
4  total_bytes_processed,
5  creation_time
6FROM
7  `region-us`.INFORMATION_SCHEMA.JOBS
8WHERE
9  job_type = 'QUERY'
10  AND state = 'DONE'
11  AND total_bytes_processed > 5242880  -- 5 MB
12  AND creation_time >= TIMESTAMP_SUB(CURRENT_TIMESTAMP(), INTERVAL 7 DAY)
13ORDER BY
14  creation_time DESC;
Here:
- total_bytes_processed > 5242880: Filters queries that used more than 5 MB of data.
- TIMESTAMP_SUB: Limits results to the last 7 days.
- ORDER BY creation_time: Sorts results from newest to oldest.
This query can be saved and scheduled in BigQuery to run daily or weekly. It provides you with ongoing visibility into resource-intensive queries, enabling you to monitor usage and enhance query performance over time.
Common Errors and Troubleshooting Tips for Query History Logs
Even though BigQuery makes it easy to track queries, you might run into issues while accessing or analyzing query history logs. In the next sections, we’ll cover common errors and simple troubleshooting tips to help you resolve them quickly.
Verify Permissions for Query History Access
⚠️ Common issue: You can’t see your query history or session logs in BigQuery, even after running queries.
✅ Solution: Make sure your user account has roles like bigquery.admin or bigquery.jobUser. These roles allow access to job and session logs. Check IAM permissions in the Google Cloud Console to update or request the correct access.
Fix Incomplete Logs by Checking Logging Configurations
⚠️ Common issue: Some queries are missing from your history, or logs appear incomplete in Cloud Logging.
✅ Solution: Make sure your audit logs are turned on in Cloud Logging settings. Check for BigQuery Data Access logs, whether they are correctly set or not, and review your retention settings so you don’t accidentally lose important log data.
Effectively Managing Query History in BigQuery
Managing your query history in BigQuery helps you stay organized, improve performance, and ensure data accuracy. In the sections below, we’ll cover practical ways to monitor queries, filter history, connect with audit pipelines, and handle exporting or deleting logs.
Monitoring Query Execution to Optimize Workloads
Query history in BigQuery is more than just a list of past queries, it’s a tool for improving performance. By reviewing queries that run slowly, consume high resources, or often fail, you can pinpoint areas to fix. Optimizing these queries helps speed up workloads and reduce costs. Look out for patterns in execution time and resource use. Small changes can make a big difference.
Filtering INFORMATION_SCHEMA Queries by Specific Parameters
BigQuery’s INFORMATION_SCHEMA views let you filter query history by time, user, project, or job status. This helps you focus only on what matters, whether you're troubleshooting or reviewing past workloads. If you use filter, you can keep your analysis clean and relevant, especially when working with large volumes of query data or specific time ranges.
Integrating Query History Data with Auditing Pipelines
You can connect your query history with audit log pipelines to get a full picture of data usage. This is useful for tracking user activity, identifying unusual patterns, or ensuring compliance. Integrating with tools like Cloud Logging or BigQuery itself helps centralize your monitoring efforts and supports automated auditing and reporting.
Deleting and Restoring Query History
BigQuery allows you to delete individual queries from your history to keep things clean. However, once deleted, queries can't be recovered unless they were exported earlier. If supported in your environment, the restore feature may let you recover recently deleted queries. Always export important queries before deleting them permanently.
Exporting Your Query History Data
BigQuery lets you export query history for backup or deeper analysis. This is useful when you want to track trends over time or use the data outside the platform. You can use built-in export tools, data transfer services, or APIs to move the data wherever you need it. It’s a simple way to keep more control over your query records and analyze them outside BigQuery when needed.
Make Your Work Easier with BigQuery Functions
BigQuery provides a comprehensive set of built-in functions that simplify the transformation, analysis, and management of large datasets. These functions help reduce complexity in your queries, improve performance, and support faster, more efficient data processing across all types of workloads.
- Date Functions: Shift dates, calculate differences, or extract day, month, and year. Useful for filtering and time-based analysis.
- Timestamp Functions: Format, extract, and compare timestamp values using functions like TIMESTAMP_DIFF and FORMAT_TIMESTAMP. Ideal for analyzing time-based events and session data.
- String Functions: Modify and extract text using functions like CONCAT and REGEXP_EXTRACT. Ideal for cleaning and formatting data.
- Statistical Aggregate Functions: Calculate metrics like average, standard deviation, and correlation for data analysis.
- Conversion Functions: Change data types with CAST, SAFE_CAST, or TO_JSON_STRING. These are useful when cleaning data or transforming it for analysis and reporting.
- DML Functions: Modify table data directly using INSERT, UPDATE, DELETE, and MERGE. Great for managing records without relying on external ETL tools.
Enhance Your Data Analysis with OWOX Reports
Take your BigQuery analysis to the next level with the OWOX Reports Extension for Google Sheets. It helps you quickly build reports, visualize data, and monitor query performance right inside Google Sheets, without writing complex code or using multiple tools.
With just a few clicks, you can automate dashboards, slice data with pivot tables, and share insights easily with your team. OWOX streamlines your reporting workflow, saving you time and enabling you to make more informed decisions with your data.
Frequently asked questions


Finally, a tool that doesn't ask business users to learn a new dashboarding UI. Our marketing team already knows Sheets. OWOX just delivers the right data.
Joinable data marts concept was the thing that sold us. We can now use the semantic layer without building one.
Self-hosted the OSS version on Digital Ocean. Zero vendor lock-in. Contributed a Shopify connector back in week two.