Welcome to our article about Looker and Looker Studio, powerful data analytics and visualization tools. In today's data-driven world, it's essential for businesses to have access to effective tools that can help them make fully-informed decisions. That's where Looker and Looker Studio come in. With robust capabilities, both tools offer an excellent solution for companies looking to take their data analytics and visualization to the next level.
Whether you're a small startup or an established enterprise, Looker and Looker Studio (formerly Google Data Studio) can help you unlock the full potential of your data. In this article, we'll explore the features and capabilities of Looker and Looker Studio, provide a step-by-step guide on how to use these tools effectively and highlight the benefits of using them for data analytics and visualization. We'll also provide real-life case studies to showcase the effectiveness of these tools and answer some frequently asked questions.
For merging and collecting marketing data, you can use marketing analytics platforms, such as OWOX BI. Here’s a brief list of its benefits:
- Works with all your sources and for all purposes
- Can easily deal with UTM tags in your advertising campaign statistics
- Automatically checks data quality and reports all errors
- Collects everything in a single dataset in Google BigQuery and natively connects that dataset with Looker Studio so you can enjoy full-fledged reporting
What is Looker?
Looker is an advanced solution for data analytics and visualization that empowers businesses to make informed decisions based on data. It is designed to be analyst-friendly, with an intuitive dashboard(Looker Dashboard) that allows users to navigate and analyze data easily. Looker is a cloud-based platform that can be accessed from anywhere, making it a convenient choice for businesses on the go.
The Looker dashboard is highly customizable, allowing users to tailor it to their specific needs. It provides a range of visualization tools, including charts, graphs, and tables, that can be used to create interactive reports and dashboards. With Looker, businesses can gain valuable insights into their operations, customers, and markets.
Looker is a versatile tool that can be used for a wide range of applications, from sales and marketing to finance and human resources. It can help businesses identify trends, optimize processes, and increase revenue. By providing real-time data and powerful analysis tools, Looker empowers businesses to make informed decisions that drive growth and success.
Looker Dashboard Walkthrough
When you first log in to Looker, you'll be presented with the Looker dashboard. The dashboard is customizable, so your view may look different from someone else's. However, it will likely contain some of the same core elements, such as:
| Element | Description |
|---|---|
| Data fields | A list of available data fields that can be used to filter and analyze your data. |
| Filters | Tools are used to narrow down your data based on specific criteria. |
| Visualizations | Charts, graphs, and other visual tools are used to represent your data. |
| Reports and Dashboards | Customizable views of your data that can be used to gain insights and share information. |
By using these tools together, you can better understand your data and use that knowledge to make informed decisions. Looker dashboard makes exploring complex data sets easy and identifies patterns and trends that might not be immediately obvious.
To get started with Looker, all you need is a data source and a desire to learn. With its intuitive interface and powerful analysis tools, Looker can help you unlock the full potential of your data.
How to Use Looker
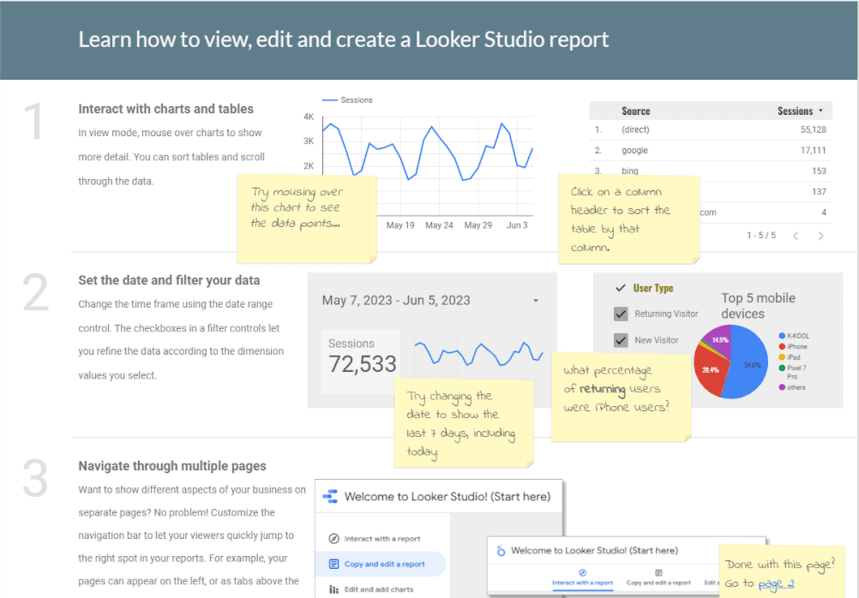
Looker is a powerful tool for data analytics and visualization, but it can take some time to get used to. If you're new to Looker, follow these steps to start using it effectively:
- Get familiar with the Looker interface: When you first log in to Looker, you'll see the Looker interface, which is where you can create and manage reports, dashboards, and other data visualizations. Spend some time familiarizing yourself with the interface and the different features available.
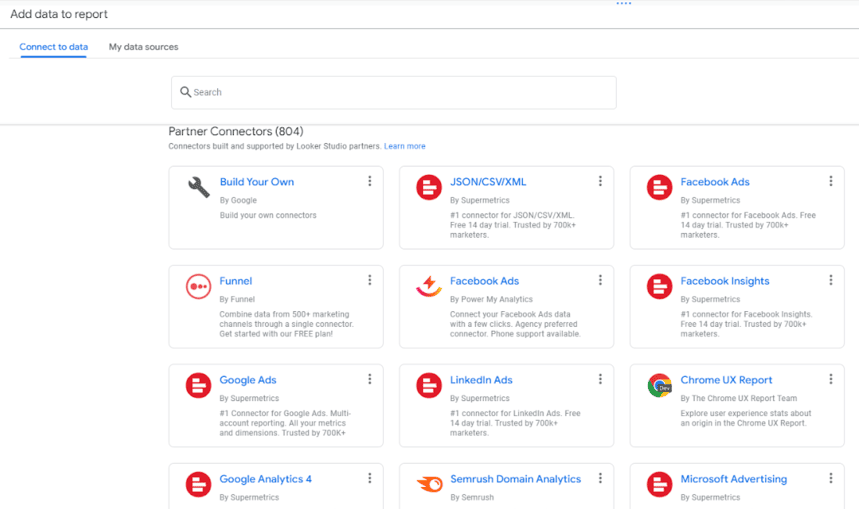
- Connect your data sources: Looker can connect to a wide range of data sources, including data warehouses, databases, and more. However, if you are considering Looker products, you are using Google Cloud infrastructure, and that’s why you will most likely connect Google BigQuery as the main place for storing all of your marketing and sales data. To start analyzing your data in Looker, you'll need to connect at least one data source to the platform.
- Create reports: Once you've connected your Google BigQuery as a data source, you can create reports in Looker. Reports are customizable data visualizations that can help you see trends, identify patterns, and draw insights from your data.
- Build dashboards: Dashboards are collections of reports and visualizations that provide an overview of your data. With Looker, you can build custom dashboards that give you a real-time view of your business performance.
- Analyze your data: Looker provides powerful tools for data analysis, including the ability to drill down into your data to see more detailed information. Spend some time exploring your data in Looker to uncover insights that can help your business.
Best Practices for Using Looker
To get the most out of Looker, keep these best practices in mind:
- Define clear metrics: Before you start using Looker, make sure you know what metrics you want to track and how you want to measure them. This will make creating reports and dashboards that provide meaningful insights easier.
- Collaborate with your team: Looker allows you to share data visualizations with your team, making it easier to collaborate and make decisions based on data.
- Experiment with different visualizations: Looker provides a wide range of visualization options, from bar charts to heat maps. Experiment with different visualizations to find the ones that work best for your data.
Looker is a great tool for businesses looking to make data-driven decisions. With its powerful analytics and visualization capabilities, Looker can help you uncover insights that would be difficult to find with other tools.
Looker Studio (formerly Google Data Studio)
Looker Studio (formerly Google Data Studio)is a powerful data visualization tool that comes with Looker. It empowers users to create impactful visualizations for better data understanding. It offers a user-friendly interface with intuitive drag-and-drop functionality for swift data formatting and visualization. Looker Studio encompasses a diverse set of chart types, such as scatter plots, bar charts, line charts, and heat maps, and allows users to design custom graph types for tailored visualizations.
An essential advantage of Looker Studio is its extensive integration capabilities, enabling data retrieval from multiple sources like databases, cloud storage services, and web services. This facilitates data consolidation and analysis, identifying crucial trends and patterns.
Overall, Looker Studio helps businesses of all sizes make better decisions by allowing them to analyze and visualize their data effectively.
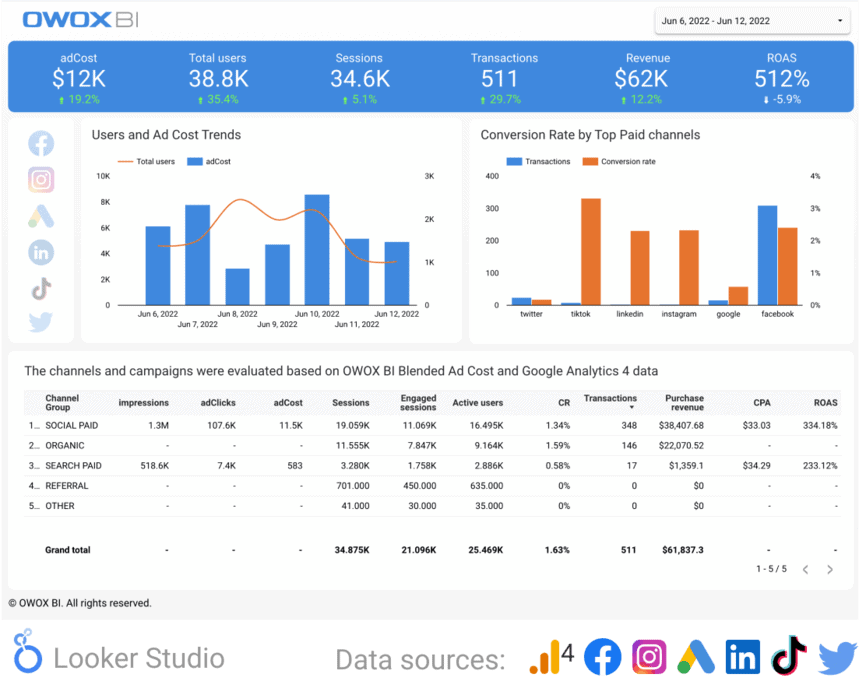
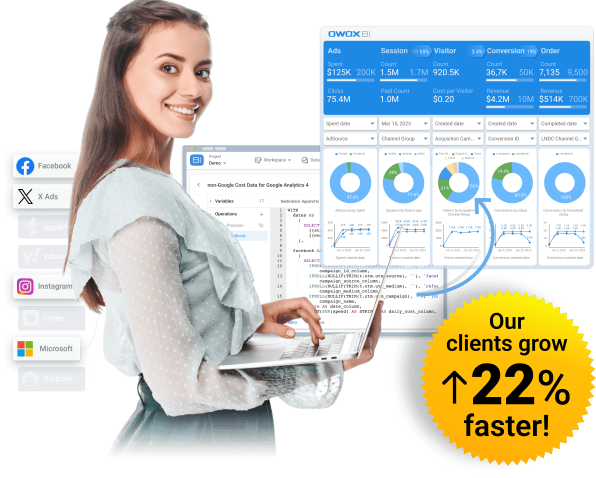
Data Analytics in Looker Studio with OWOX BI
OWOX BI is a powerful all-in-one data analytics tool that offers a wide range of features to help businesses make data-driven decisions. From data collection for your marketing and sales data into Google BigQuery and the most accurate server-side streaming for your website user behavior data, through seamless data transformation with plug-and-play templates to your data, to attribution modeling capabilities and robust data preparation for dashboards in Looker Studio allow users to analyze data in real-time, track performance, and identify trends and patterns so they can make data-driven decisions and grow ROI.
One of the key benefits of OWOX BI is its ability to handle large volumes of data. With OWOX BI, businesses can analyze data from multiple sources, including advertising platforms like Facebook, Twitter, and Bing, CRMs like Hubspot, project management tools like Asana, sales tools like SalesForce and databases, and DWHs. This makes it an ideal tool for businesses that must consolidate marketing (and other) data from multiple sources into a unified view.
Looker Studio then offers a range of reporting features that allow users to create custom reports and automate reporting processes. OWOX BI helps users to prepare the data for ad-hoc reports on the fly or set up scheduled reports to be updated on a regular basis.
One of the most powerful features of OWOX BI is the ability to help businesses identify trends and patterns in their data. With OWOX BI data modeling capabilities and advanced analytic tools, users can easily identify correlations between different data sets, and gain insights that would not be possible with traditional reporting tools.
Looker Studio data visualization capabilities are also a major advantage for data collected and prepared by OWOX BI. With Looker Studio, businesses can create compelling visualizations that make data easier to understand. From simple pie charts to complex heat maps, Looker Studio offers a range of visualization options to suit every need.
Whether you're looking to improve your business's performance, track key metrics, or make data-driven decisions, OWOX BI is an easy-to-setup yet powerful way to collect & process the data, and Looker Studio is a powerful tool that can help you get the marketing insights you need.

Data Visualization with Looker Studio
Looker Studio provides businesses with powerful data visualization tools that enable them to create compelling visualizations to communicate complex data in a clear and compelling way.
With Looker Studio, you can create customized dashboards that allow you to visualize your data in a way that fits your needs best. The platform has several visualization options, including line charts, bar charts, and scatter plots.
The Looker Studio interface is intuitive, making it easy to create dynamic visualizations that help to analyze and interpret data more efficiently. With a range of interactive components such as drop-down menus and sliding scales, businesses can build custom visualizations that enable users to drill down into their data and gain deeper insights quickly.
Looker Studio also offers the ability to customize the look and feel of your visualizations with built-in branding options. You can customize the colors and font style to match your company’s branding to keep your visualizations in line with your overall corporate identity.
Just don’t forget to collect the raw marketing data first and prepare it for being visualized in Looker Studio.

Looker Studio’s data visualization features can help businesses identify patterns, trends, and correlations in their data that may not be immediately obvious. By using the platform's visualization capabilities, businesses can gain deeper insights into their data, enabling them to make more informed decisions.
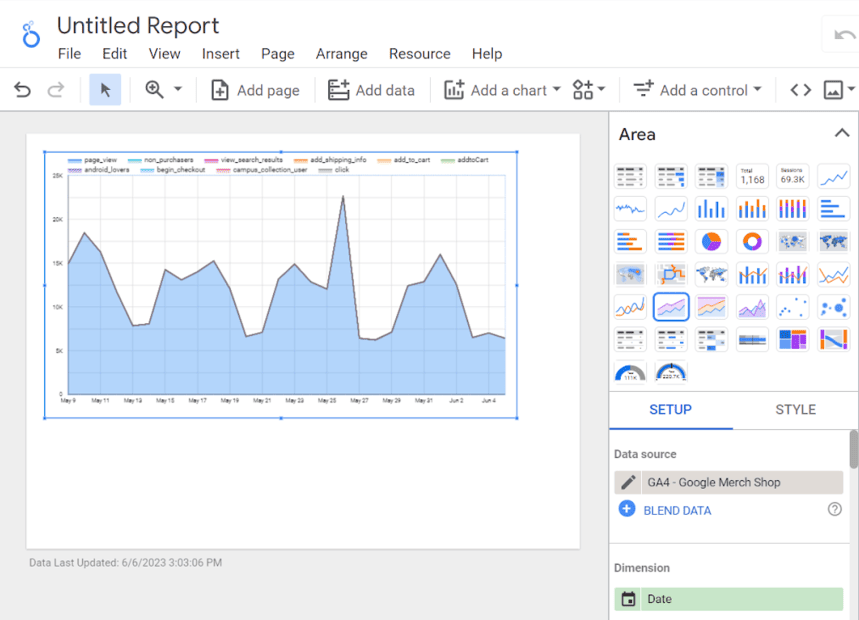
Customizing Visualizations with Looker Studio
To create a custom visualization, you can use Looker’s drag-and-drop interface to add or remove data sources, change metrics, and adjust filters. This process is straightforward and can be completed without any coding experience.
Looker Studio also provides you with the ability to create custom dashboards that allow you to visualize your data in a way that fits your needs best. You can use these dashboards to track key performance indicators, monitor trends, and identify areas for improvement.
In conclusion, Looker and Looker Studio provide businesses with powerful data visualization tools that enable them to create customized visualizations to better understand their data. By using these tools, businesses can gain deeper insights into their data, identify patterns and trends more easily, and make more informed decisions.
Uncover in-depth insights
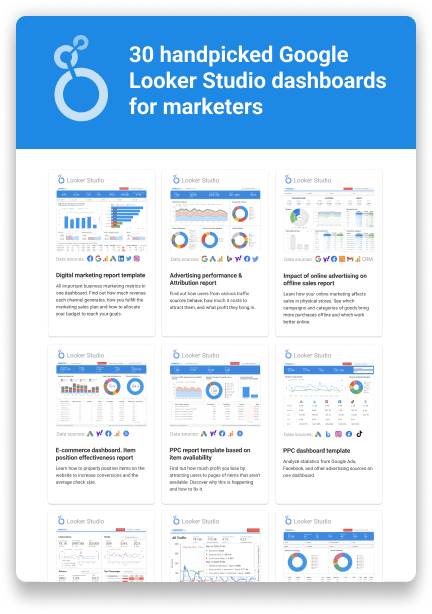
Top 30 Handpicked Google Looker Studio Dashboards for Marketers
Download nowBonus for readers
Benefits of Looker Studio
Looker Studio is a powerful data visualization tool that can help businesses make informed decisions and improve performance. By leveraging this tool, businesses can gain a deeper understanding of their data and use that knowledge to drive growth and success.
Save Time and Resources
One of the key benefits of using Looker Studio (with data collected & prepared by OWOX BI) is the ability to save time and resources. With these tools, businesses can quickly and easily access their data, analyze it, and create compelling visualizations without the need for extensive technical expertise. This allows teams to focus on more important tasks, such as developing new products or improving customer experiences.
Better Decision-Making
OWOX BI provides comprehensive and reliable data, while Looker Studio provides businesses with the visualization of the information they need to make better decisions. By analyzing data in real-time, businesses can identify trends, track performance, and make informed decisions that drive growth and profitability. With Looker Studio, businesses can create custom reports and dashboards that provide actionable insights, making it easy to identify key areas for improvement.
Improved Collaboration
OWOX BI and Looker Studio also enable improved collaboration between teams. With these tools, teams can easily share data and insights, collaborate on projects, and create custom reports and dashboards that are tailored to specific needs. This allows businesses to work more effectively and efficiently, improving overall performance.
Visualize Complex Data
Another key benefit of Looker Studio is the ability to visualize complex data prepared by OWOX BI. With Looker tools, businesses can create compelling visualizations that make it easier to understand and interpret complex data sets. This can help teams identify patterns, trends, and opportunities that might otherwise be missed.
Looker Studio is an incredibly powerful tool for creating stunning visualizations that make complex data easy to understand.
Increased Efficiency
Finally, OWOX BI and Looker Studio can help businesses increase efficiency. By automating many of the processes involved in data analysis and visualization, businesses can reduce the amount of time and resources required to gain insights and make informed decisions. This can lead to increased productivity, improved profitability, and a more streamlined workflow overall.
Case Studies
Many companies have successfully incorporated OWOX BI and Looker Studio to improve their data analytics and visualization capabilities. Here are a few examples:
| Company | Industry | Challenge | Results |
|---|---|---|---|
| FxPro | Fintech | Difficulty in accessing and analyzing data | Increased efficiency and accuracy in reporting, leading to better decision-making |
| Delfast | eBike manufacturer | Difficulty in monitoring performance and ad spend | Improved data visibility and real-time performance tracking to save 80% on ad spend |
| Darjeeling | Retail | Limited visibility and understanding of ROPO purchases | Darjeeling’s marketers came to realize that 30 to 40% of customers visit the company’s website before buying offline.The obtained data helps the company optimize their ad budget resources and invest more in online advertising |
These case studies demonstrate how Looker and Looker Studio can be used in different industries to solve various data-related challenges and achieve measurable results.
“OWOX BI has revolutionized the way our team analyzes and interprets data. The ability to create custom reports and dashboards has helped us make more informed decisions and improve overall performance.”
Christophe Lemaire, VP of e-marketing, Acquisition & CRM at Chantelle Group
Gain clarity for better decisions without chaos
No switching between platforms. Get the reports you need to focus on campaign optimization
FAQ
-
What is the pricing for Looker Studio?
Looker Studio’s cost is $0. Setting up Looker is free of charge, allowing you to get started without any upfront costs. However, if you need to access data from platforms outside of Google, there might be expenses associated with acquiring a third-party connector provider. If your data is collected, stored, and prepared by OWOX BI in Google BigQuery, Looker Studio is free for you. -
What types of data sources can Looker Studio connect to?
You can use free connectors built by Google to access data such as Google BigQuery, Google Sheets, Google Ads, Google Analytics 4, and other Google Marketing Platform products. -
Do I need technical expertise to use Looker Studio?
While some technical expertise can be helpful for getting the most out of Looker Studio, the platform is designed to be user-friendly and accessible to a wide range of users. -
Is Looker Studio compatible with my existing tools and systems?
Looker is designed to be flexible and compatible with a wide range of tools and systems. Looker integrates with all of the Google tools seamlessly, while OWOX BI can help you with data collection and preparation, and can be customized to work with your specific systems and workflows. -
Is Looker Studio suitable for small businesses?
Looker Studio is designed to be scalable and can be used by businesses of all sizes. While some of Looker Studio’s advanced features may be more suited for larger organizations, the platform can be customized to meet the specific needs of smaller businesses as well. -
What is a Looker dashboard?
A Looker dashboard is a centralized display of visualizations and data insights, providing an overview of key metrics and trends in a visually appealing format. -
How can I create a dashboard in Looker?
To create a dashboard in Looker, you can utilize LookML (Looker's modeling language) or the Looker Explore interface. LookML allows for more advanced customization, while the Explore interface offers a drag-and-drop experience for creating dashboards.