
What Is a Semantic Data Model?
Understand the concept of semantic data models, their impact on business reporting, and how OWOX BI helps streamline self-service analytics.

Understanding your data is no longer just a technical task; it’s a business necessity. But when data is scattered across systems and full of jargon, making sense of it becomes challenging. That’s where semantic layers and data models come in. They bring clarity by connecting business meaning to raw data.
In this article, you’ll learn what a semantic data model is, how it works, and why it’s changing how teams interact with data. We’ll explore examples, compare them with traditional models, and walk through building one using OWOX BI. Whether you're in marketing, finance, or operations, this guide has you covered. Let’s break it down simply.
Understanding Semantic Data Models: The Concept
A Semantic Data Model (SDM) represents data in a way that captures both its meaning and relationships.
Unlike traditional models focused on structure, SDMs connect real-world concepts like customers, products, or events using clear relationships and context.
The idea began in the 1970s with semantic networks and grew through AI and database research. By the 2000s, the Semantic Web introduced standards like RDF and OWL, enabling smarter data linking and sharing.
Today, SDMs power knowledge graphs, semantic layers, and analytics tools, helping organizations make sense of complex data and drive better, faster business decisions.
How Do Semantic Data Models Work?
Semantic Data Models (SDMs) are built on the principle that data should not just be stored, but understood by both humans and machines. Instead of only organizing data into tables, SDMs use ontologies and vocabularies to attach meaning, define relationships, and create context across different data entities.
Imagine a retail company aiming to simplify its sales data analysis. Instead of digging through raw tables, they organize information based on real-world objects and how they connect.
This model helps a retail company analyze and report on customer purchases by capturing the business logic and relationships between key entities. It enables questions like:
- Which products are selling best by region?
- What are the top payment methods per customer segment?
- Which orders include specific product categories?
By structuring the data semantically, the relationships become more intuitive, and the insights become more actionable.
Entities: Customer, Order, Product, Category, OrderItem, PaymentMethod, Region
Attributes:
- Customer: Name, Email, Phone, RegionID
- Order: OrderDate, TotalAmount, CustomerID, PaymentMethodID
- Product: Name, SKU, Price, CategoryID
- OrderItem: Quantity, ProductID, OrderID
- Category: CategoryName
- PaymentMethod: MethodType (e.g., Credit Card, Cash)
- Region: RegionName
Relationships in real life:
- A Customer places an Order
- An Order includes one or more Products
- A Product belongs to a Category
Ontologies a.k.a. Semantization, which defines clear meanings for “Customer,” “Order,” and “Product,” and formalizes how these are linked (e.g., "places," "includes," "belongs to").

This semantic model captures the full customer purchase journey by linking key business entities with meaningful relationships. It enables clearer insights and more intuitive analysis across sales, products, and customer behavior.
Key Components of a Semantic Data Model
Semantic Data Models are built using core components that give structure and meaning to data. These components define what the data represents, how it's described, and how different data points are related.
Entities
Entities are the core objects or concepts that represent real-world elements such as people, products, locations, or events. Each entity holds specific data points and acts as a foundation in the model structure.
For example, a Customer entity may represent a person who makes purchases, and an Order entity tracks each transaction linked to that customer.
Attributes
Attributes define the specific characteristics or properties of an entity, providing context and clarity to the data being modeled. They help distinguish one entity instance from another by capturing meaningful details.
For example, a Product entity may include attributes like Name, SKU, and Price, while an Order entity may have attributes such as OrderDate and TotalAmount to describe the transaction.
Relationships
Relationships describe how entities are connected or interact with one another, enabling deeper insights through data association. These connections help users understand how different parts of the data relate in a business context.
For instance, a Customer places an Order, and an Order contains multiple Products, creating a clear link between who buys what.
Ontologies
Ontologies provide a structured vocabulary that defines entities, their types, and the nature of their relationships within a specific domain. They enable consistent interpretation of data across systems and teams by formalizing meaning.
For example, an ontology might specify that a Customer places an Order and lives in a Region, allowing both humans and machines to understand and navigate the data meaningfully.
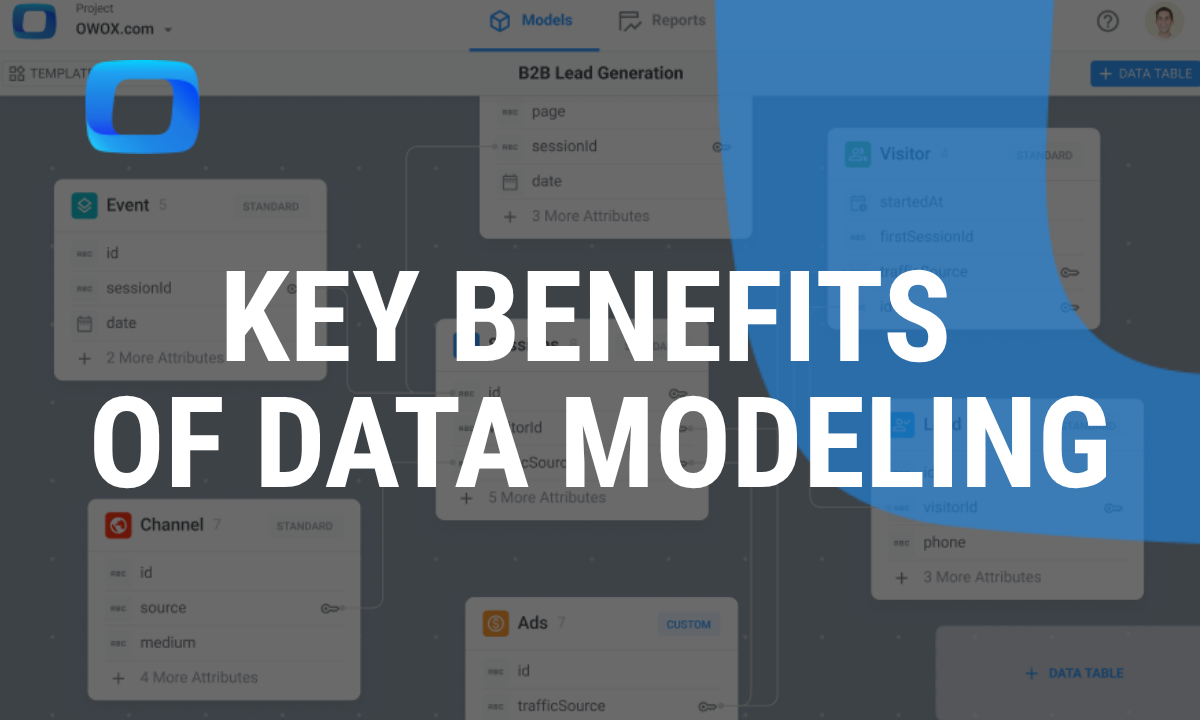
Benefits of Semantic Data Models
Semantic Data Models make it easier to connect data with real-world meaning. They help businesses gain clarity, consistency, and smarter insights without needing deep technical knowledge.
Let's look at some of the benefits of semantic data models:
- Uncover Data Relationships: Reveal hidden connections between data points, making patterns and dependencies easier to understand.
- Enhance Data Visualization: Structure data in a way that supports clearer, more intuitive reporting and dashboard creation.
- Support Application Development: Provide a solid data foundation that accelerates and simplifies the design of data-driven applications.
- Enable Non-Technical Access: Allow business users to explore and analyze data without needing to understand complex database structures.
- Model Real-World Concepts: Identify and represent key elements from the real world, aligning data with actual business scenarios.
- Clarify Entity Characteristics: Highlight important attributes of each data component for improved analysis and accuracy.
- Map Business Processes: Help define and describe real-world workflows before they are implemented in organizational systems.
Types of Semantic Data Models
Semantic Data Models have different structures to show how data is connected. The right type of data model depends on how complex the relationships are. Let’s look at the two main types below.
Hierarchical Semantic Models
Hierarchical Semantic Models arrange data in a top-down, tree-like format, where each entity has a single parent. This makes the structure easy to understand and navigate, especially for data that naturally fits into tiers.
It’s ideal for use cases like product catalogs or organizational charts where clear parent-child relationships exist. For example, a retail site may use it to categorize products into categories, subcategories, and individual items.
Network Semantic Models
Network Semantic Models use a graph-based structure where entities (nodes) can connect to multiple others through labeled relationships (edges). This flexible format allows complex, many-to-many relationships and is perfect for highly interconnected systems.
Social media platforms use this model to connect users, posts, likes, and comments. It supports rich, real-time analysis and allows systems to uncover patterns and user behavior across linked data points.
How Semantic Data Models Function
Semantic Data Models use abstraction to simplify and organize real-world data. They help filter out irrelevant details and focus on meaningful relationships. Let’s explore three key abstraction types used in SDMs.
Classification
Classification groups different objects based on shared characteristics using “instance of” relationships. It helps organize data into logical categories.
For example, employees can be classified into roles like Salesperson, Manager, or Technician. Each instance belongs to a defined class, making data easier to manage, compare, and analyze across various business functions.
Aggregation
Aggregation creates a new object by combining related objects that become its components. It uses “has a” relationships to show that one entity contains or includes others.
For instance, an Order object may aggregate customer details, product items, and payment information. This structure allows systems to treat grouped data as a single, meaningful unit.
Generalization
Generalization connects objects by identifying shared features and creating broader categories using “is a” relationships. It shows how specific entities relate to more general ones.
For example, a Manager and a Developer can both be generalized as Employees. This simplifies data modeling by reducing redundancy and highlighting commonalities between different data types.
Spotting the Differences: Semantic Data Models vs. Traditional Data Models
While traditional data models focus on structure and storage, semantic data models focus on meaning and relationships. Understanding the differences helps in choosing the right model based on your business goals and data complexity.
Relational Data Models vs. Semantic Data Models
The core difference between a relational data model and a semantic data model lies in how they represent and interpret data.
A relational data model is built using tables, rows, and columns where relationships are maintained through foreign keys. While effective for storage and structure, it requires technical queries to understand how data elements relate.
A semantic data model, on the other hand, focuses on real-world meaning by defining entities and their relationships in business terms. It’s fact-oriented and interprets connections between data elements without needing complex queries.
For example, in a sales system, a relational model would require joining multiple tables to see which products a customer purchased. In a semantic model, that same insight is already structured as “Customer places Order containing Product,” making the relationship clear without extra querying.
Dimensional Data Models vs. Semantic Data Models
The core difference lies in purpose and structure. A dimensional data model is designed for analytics and organizes data into facts and dimensions, using star or snowflake schemas. While it is useful for reporting, it lacks context beyond numeric aggregation and requires users to interpret meanings from labels.
A semantic model adds business meaning and clearly defines relationships, making data exploration easier. It allows users to ask business-focused questions without needing to understand the underlying data structure.
For example, in a dimensional model, you might analyze Sales Amount by Product Category using fact and dimension tables. In a semantic model, it’s defined as Product that belongs to a Category and generates Sales, making the business relationship clearer and more actionable.
Object-Oriented Data Models vs. Semantic Data Models
Object-oriented data models organize data using classes, objects, and inheritance, focusing on software structure and reusability. They’re effective in application development but aren’t designed for easy data interpretation.
A semantic model defines data using business-friendly entities and real-world relationships. It focuses on how data is used and understood in a business context. This makes it easier for non-technical users to explore, analyze, and draw insights from the data.
For example, in an object-oriented model, a Customer is a class with attributes like Name, Email, and Phone. In a semantic model, a Customer is an entity that places Orders and belongs to a Region, making the business logic clear and accessible.
Real Use Case Applications of Semantic Data Models
Semantic data models help organizations turn fragmented information into meaningful, unified insights. Across industries, they simplify reporting by connecting data to real-world concepts and business logic. Let’s look at how different sectors apply semantic modeling.
Banking and Financial Institutions
Banks manage large volumes of customer data across credit cards, loans, mobile apps, and support systems. These data sources often operate in silos, making reporting slow and fragmented. Semantic models unify this information for consistent, real-time insights.
For example, a bank wants to create a report that shows which customers are using which financial products, like savings accounts, credit cards, or personal loans.
The data for customers, products, branches, and accounts is stored in different systems. A semantic model brings all of this together by clearly linking each customer to the products they use through their accounts.

This semantic model enables the bank to generate unified reports on product usage, customer behavior, and branch performance. It removes the complexity of scattered systems and supports faster decision-making.
Healthcare
Healthcare providers deal with different types of data like lab results, patient visits, and medications. These records often use different terms, making reporting difficult. A semantic model brings this data together under common labels.
Imagine a clinic that wants to generate reports showing which patients were diagnosed with what conditions, which medications were prescribed, and which doctor handled the visit. The data exists in different systems; some track visits, and others record diagnoses or prescriptions. A semantic model links them together so reporting becomes clear and consistent.

This semantic model simplifies healthcare reporting by linking key data like patient visits, diagnoses, and prescriptions. It allows clinics to generate clear, accurate reports without relying on complex data joins.
Automation
Automation tools work best with structured, consistent data. However, in many organizations, the data used in automation, like employee tasks, documents, or approvals is spread across different formats and systems. When data is unstructured or disconnected, automation tools struggle to scale or deliver accurate results.
Imagine a company that wants to automate reporting on employee onboarding progress. Task lists are in spreadsheets, submitted documents are stored in drives, and status updates are tracked manually. A semantic model combines all this data by connecting employees, tasks, and documents in a structured way.

This semantic model helps automate reporting on employee onboarding by connecting tasks, documents, and checklist items. It simplifies tracking and enables faster HR operations with less manual effort.
Steps in Creating a Data Model with OWOX BI
Building a semantic data model in OWOX BI follows a step-by-step process that aligns data structure with business needs. Each phase helps ensure the model is insightful, scalable, and ready for analysis.
Requirement Gathering
Identify your business goals and the KPIs that the model needs to support. This step ensures the semantic model answers the right questions and delivers insights that matter. Clear objectives help guide every other modeling decision, from data integration to reporting metrics.
Integrate Data Sources
Connect all relevant data sources such as CRM systems, Google Analytics, Google Ads, and databases into a data warehouse.
OWOX BI simplifies this step by offering built-in integrations and 100% Free Open-Source Java Script Connectors library. Unifying your data sources lays the foundation for building accurate, end-to-end analysis.
Entity Identification
Determine the core business entities your model will track, such as Sales, Customers, Products, or Campaigns. These entities represent real-world objects and form the foundation of your semantic structure. Correctly identifying them ensures data is organized and meaningful from the start.
Defining Attributes
Determine the core business entities your model will track, such as Sales, Customers, Products, or Campaigns. These entities represent real-world objects and form the foundation of your semantic structure. Correctly identifying them ensures data is organized and meaningful from the start.
Mapping Relationships
Establish how entities relate to each other. For example, a Customer places an Order, and an Order includes Products. Defining one-to-many or hierarchical relationships ensures the model reflects real business logic and supports cross-entity reporting.
Create Data Layers
Organize your data into logical layers- raw, enriched, and reporting-ready. This structure streamlines data processing and improves transparency. Layered architecture also supports better maintenance, version control, and performance tuning as your data scales.
Build Semantic Data Models with OWOX BI
Use OWOX BI’s interface to model your data based on business logic.
If required, you can build SQL transformations, and structure your data marts & tables to support interactive reporting. This step turns raw data into a user-friendly, analysis-ready model.
Ontology Creation
Develop an ontology that defines how concepts, entities, and attributes are classified and related. This includes naming standards, categories, and business rules. A well-structured ontology brings consistency across the model and makes data easier to interpret for end users and analysts alike.
Common Challenges in Building a Semantic Data Model
While semantic data models offer clarity and business value, building them comes with their own set of challenges. These issues can affect performance, adoption, and long-term scalability if not addressed early.
Below are some of the most common challenges teams face during semantic model development.
Data Quality Issues
Poor-quality or inconsistent data can break a semantic model before it starts delivering value. Ensuring accuracy, completeness, and standardization is critical. Without reliable data inputs, even the most well-designed model will produce flawed outputs, leading to inaccurate reporting.
Managing Complex Relationships
Semantic models often involve multiple entities, each with several connections to others. As the number of entities grows, managing the interdependencies and keeping track of how they relate becomes increasingly difficult.
Securing Stakeholder Buy-In
Getting all stakeholders, such as business users, IT teams, and data analysts to agree on how data should be modeled is not easy. Different teams may have their interpretations of data elements, or may resist changes to existing workflows.
Graph Data Modeling Technique
Unlike traditional tabular models, semantic models often use graph-based structures to represent relationships. While powerful, this technique is less familiar to many teams, especially those used to working with relational databases. The unfamiliar structure can create confusion and reduce confidence in the model’s design.
Need for More Practice and Experience
Semantic modeling requires a strong understanding of both the data and the business context it represents. Teams unfamiliar with semantic concepts may struggle with modeling best practices, naming conventions, or structuring relationships.
Best Practices and Considerations for Building Semantic Data Models
To get the most value from semantic data models, they need to be clear, efficient, and easy to maintain. The best practices below help ensure your models support accurate reporting and adapt well to changing business needs.
Keep Models to a Minimum
Avoid creating multiple overlapping models. Instead, build the fewest number of semantic models needed to serve your reporting needs. This reduces duplication, simplifies maintenance, and makes version control easier. A single, well-structured model can serve multiple teams and reports across the organization without added complexity.
Ensure Comprehensive Coverage
A semantic model should include all necessary entities, metrics, and relationships required to answer relevant business questions. It should reflect how your organization actually works, covering all key areas without leaving gaps.
Focus on Optimization and Performance
As data grows, performance matters. Your semantic model should be designed to refresh quickly, load visuals fast, and support efficient DAX calculations. Use indexing, reduce unnecessary columns, and manage relationships smartly.
Implement Strong Security Measures
Protecting your data is essential. Apply security settings like row-level security to control access based on roles or user groups. Make sure sensitive information is restricted and only visible to authorized users. This builds trust and ensures compliance with internal policies and external regulations.
Design for Flexibility and Scalability
Businesses evolve, and your model should too. Create your semantic model with future changes in mind, such as new data sources, KPIs, or departments. A flexible structure allows you to adapt quickly without starting from scratch, saving time and keeping your analytics environment up to date.
Build Powerful Semantic Data Models with OWOX BI
OWOX BI allows you to build semantic data models that reflect real business logic. It connects scattered data sources into one unified, meaningful structure. With visual modeling and no-code tools, teams can easily define entities and relationships. This makes reporting faster, clearer, and more consistent across departments.
The platform supports hierarchies, custom metrics, and business-friendly naming. It adapts as your data evolves, ensuring long-term flexibility and control. Even non-technical users can explore data through intuitive, structured layers.
Frequently asked questions


Finally, a tool that doesn't ask business users to learn a new dashboarding UI. Our marketing team already knows Sheets. OWOX just delivers the right data.
Joinable data marts concept was the thing that sold us. We can now use the semantic layer without building one.
Self-hosted the OSS version on Digital Ocean. Zero vendor lock-in. Contributed a Shopify connector back in week two.