Snowflake schema in data modeling: definition, diagram and example
A snowflake schema is a way to lay out a data warehouse: a fact table in the middle, with dimension tables that are split further into sub-tables, so the diagram branches like a snowflake. It is a design pattern and has nothing to do with the Snowflake data warehouse product. This guide covers the definition, the diagram, a SQL example, the comparison with a star schema and when the extra joins are worth it.
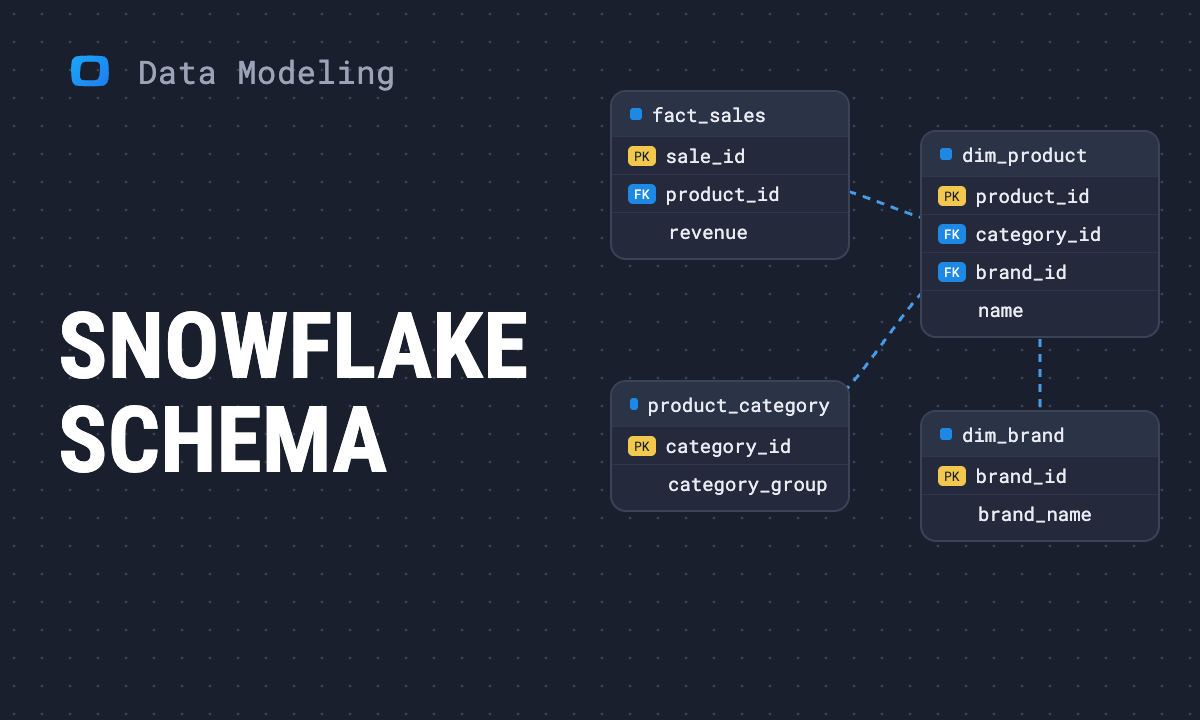
A snowflake schema is a data warehouse layout in which a central fact table connects to dimension tables, and those dimensions are normalized into further sub-tables. Product points to category, category points to category group. The branches make the diagram look like a snowflake.
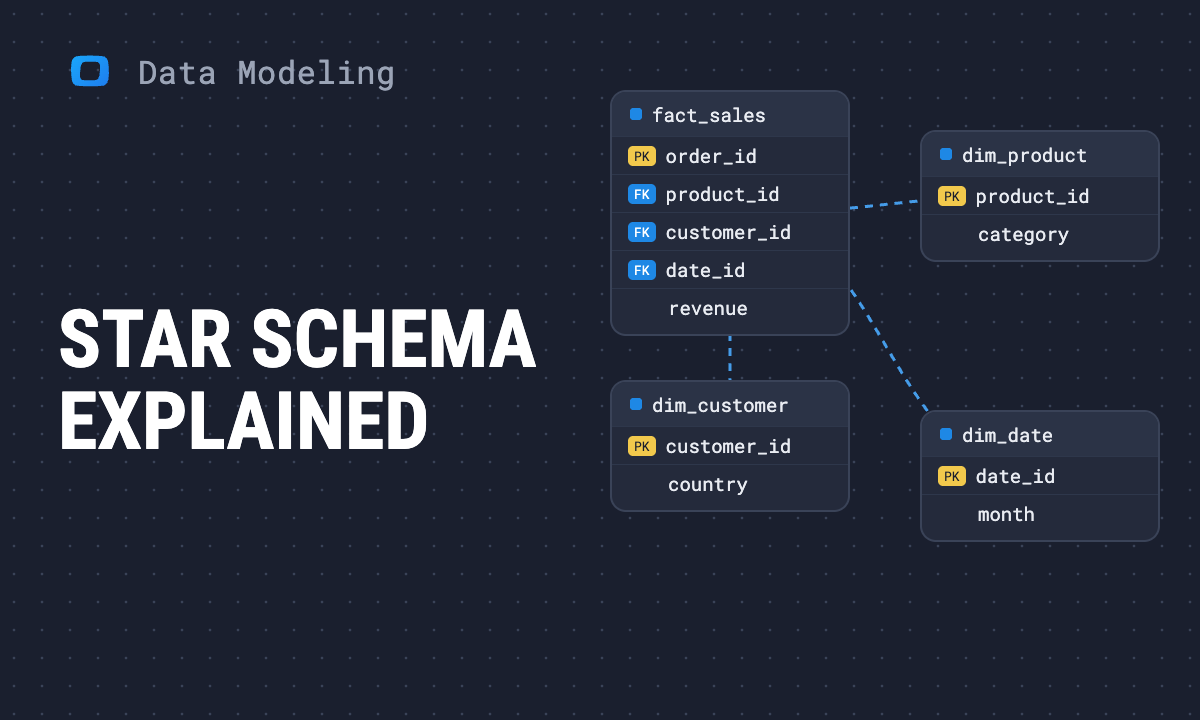
It is a star schema with one change: where a star keeps each dimension as one wide table, a snowflake splits it by level.
One clarification first, because the name causes confusion. A snowflake schema is a design pattern, not the Snowflake data warehouse. You can build a snowflake schema on any warehouse, and most models built on Snowflake the product are not snowflake schemas.
What a snowflake schema is
A snowflake schema has the same two table types as any dimensional model:
- A fact table with one row per event, holding numbers such as quantity and amount, and a key to each dimension.
- Dimension tables that describe the events: product, customer, store, date.
The difference is inside the dimensions. In a snowflake schema, a dimension that contains a hierarchy is split so that each level has its own table. Brand, category, size and colour stop being text columns on the product row and become tables of their own, each referenced by a key.
That is normalization, the same idea used in application databases: store each fact once, and point to it.
Snowflake schema diagram
The diagram below is a sales model. fact_sales is in the centre. Each dimension around it branches again.
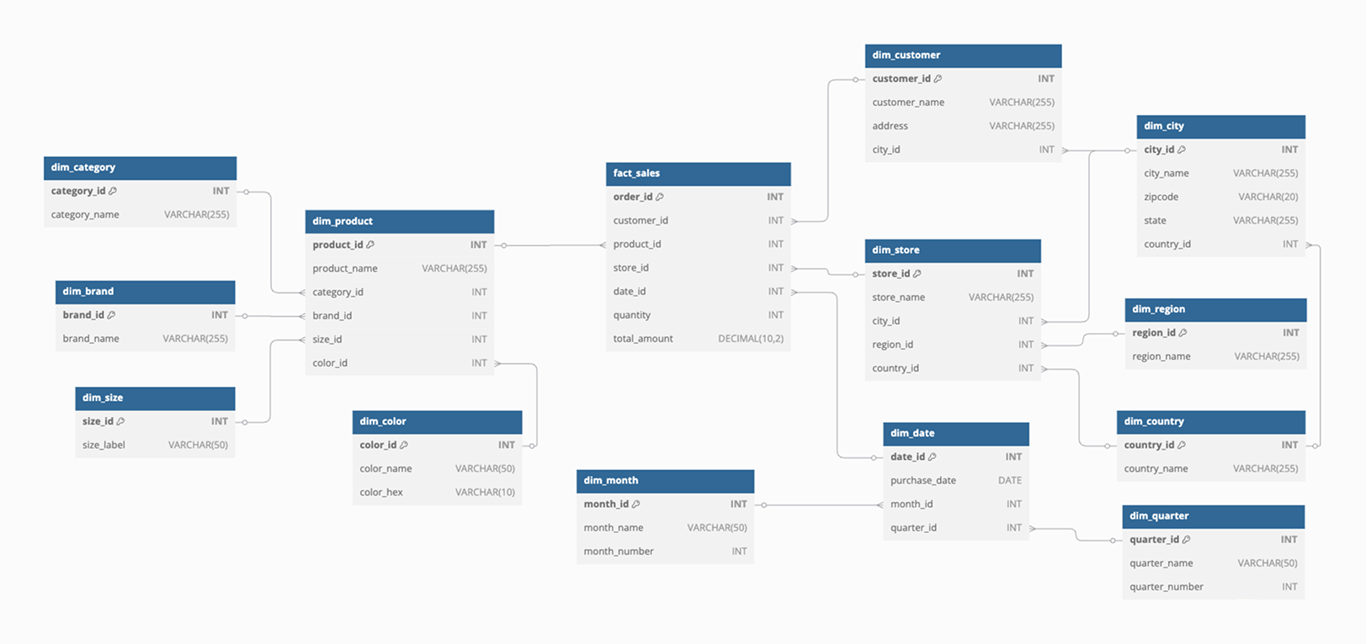
Following one branch makes the pattern clear. The product dimension keeps the product name and four keys. Category, brand, size and colour each live in their own table:
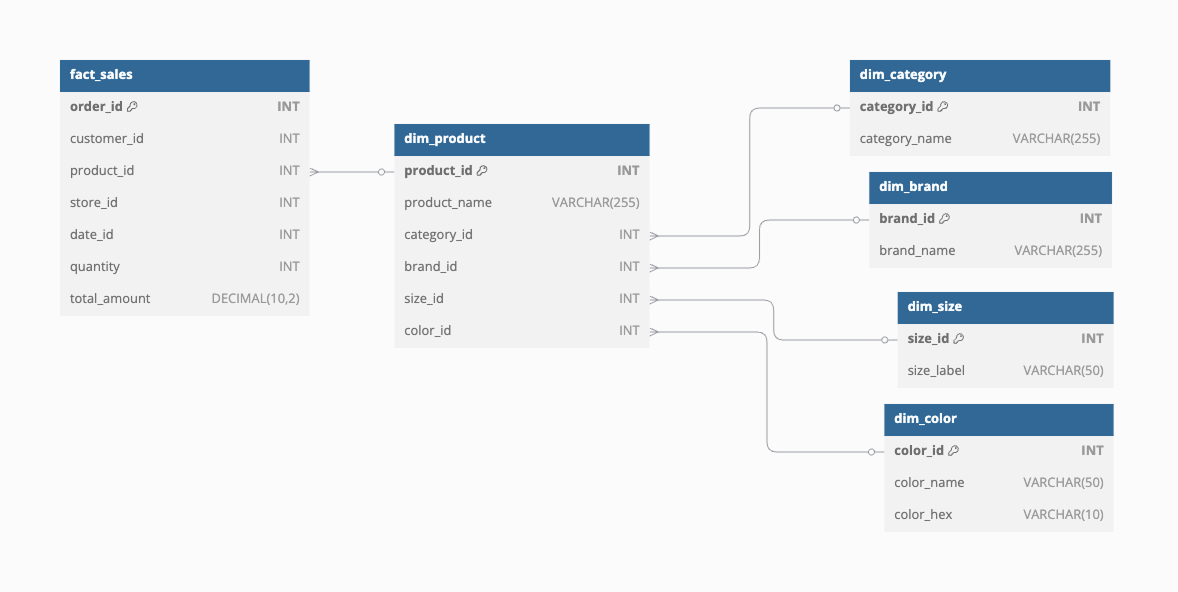
To read a snowflake schema diagram, start at the fact table and count the joins to the attribute you need. One join gets you to a product. A second gets you to its category. In a star schema the count is always one.
OWOX Data Marts
See your first report built in real time. 15 minutes.
- Connect your data warehouse
- Pick your metrics
- Get a live Google Sheets report
In the time it takes to write a ticket. Then imagine never writing that ticket again.
Book a DemoWe'll use your actual use case
A snowflake schema example in SQL
A snowflake schema example in SQL
The OWOX demo e-commerce dataset in Google BigQuery has a snowflaked product dimension. Order lines are in purchases, each line points to products, and each product points to product_category, which holds the category name and a category group.
Revenue by category group therefore needs two joins from the fact table:
SELECT
  c.category_group,
  c.category_name,
  ROUND(SUM(p.line_net_revenue))
    AS revenue
FROM
  `owox-demo.ecommerce.purchases` p
JOIN
  `owox-demo.ecommerce.products` pr
  ON pr.product_id = p.product_id
JOIN
  `owox-demo.ecommerce.product_category` c
  ON c.category_id = pr.category_id
GROUP BY 1, 2
ORDER BY revenue DESC
Run on 7 October 2026, it returned:
| Category group | Category | Revenue |
|---|---|---|
| Hard Goods | Electronics | 4,961,224 |
| Soft Goods | Apparel | 1,250,488 |
| Hard Goods | Home & Kitchen | 653,196 |
| Soft Goods | Sports | 632,601 |
The benefit shows when something changes. Moving Sports from Soft Goods to Hard Goods is one updated row in product_category. In a star schema, where the group is repeated on every product row, it is an update to every sports product.
Snowflake schema vs star schema
Snowflake schema vs star schema
The two are the same model at different levels of normalization.
| Snowflake schema | Star schema | |
|---|---|---|
| Dimension tables | Normalized into sub-tables | One denormalized table each |
| Joins to reach an attribute | One per level of the hierarchy | One |
| Repeated values | Stored once | Repeated on each dimension row |
| Updating a hierarchy | One row | Many rows |
| Query writing | Longer, more joins | Shorter |
| BI tool friendliness | Needs the join path defined | Works with little setup |
| Storage | Smaller dimensions | Larger dimensions |
Two of these rows matter less than they used to. Dimension tables are small next to fact tables, so the storage saved is modest, and columnar warehouses compress repeated text well. The rows that still matter are the join count and the cost of updating a hierarchy.
For the star side, see star schema. For a point-by-point comparison, see star schema vs snowflake schema.
Advantages and disadvantages
Advantages
- One place to change a hierarchy. A category, region or account group is stored once.
- Consistent attributes. Two products cannot carry two spellings of the same brand.
- Shared sub-dimensions. A geography or calendar table can serve several dimensions.
- Fits sources that are already normalized. Reference data maintained in another system loads without flattening.
Disadvantages
- More joins in every query. Each level adds one, and each is a chance to join on the wrong key.
- Harder for business users. A person building a pivot has to know that category is two tables away.
- More tables to keep in step. A missing row in a sub-dimension silently drops fact rows from an inner join.
- Little performance gain on a columnar warehouse, where scanning a wide dimension is cheap.
When to use a snowflake schema
When to use a snowflake schema
Normalize a dimension when at least one of these is true:
- The hierarchy is owned elsewhere. A product taxonomy from a product information system or a chart of accounts from finance should be loaded as it is maintained.
- The hierarchy changes often. Regions are redrawn, categories regrouped. One row is safer than a mass update.
- Several dimensions share the same sub-table. Customers, stores and suppliers all have a country.
- A dimension is very large and one of its attributes is long text repeated millions of times.
Keep it as a star when none of them applies. Most reporting models end up mixed: a star, with one or two dimensions snowflaked for a reason someone can state.
Design guidelines
Five rules keep a snowflake schema from producing wrong totals.
- Fix the grain of the fact table first. State what one row is, such as one order line. The snowflaking happens in dimensions and must not change it.
- Use surrogate keys at every level. Each sub-dimension gets its own key owned by the warehouse.
- Make every branch complete. Every product needs a category, and every category a group. Add an “Unknown” row instead of leaving a key empty, so inner joins do not drop sales.
- Share conformed dimensions. When two fact tables use the same product dimension, they can be reported side by side.
- Reconcile the totals. The sum over the deepest level must equal the sum over the fact table. In the example above, the four categories add up to 7,497,509, the total of the fact table’s net revenue.
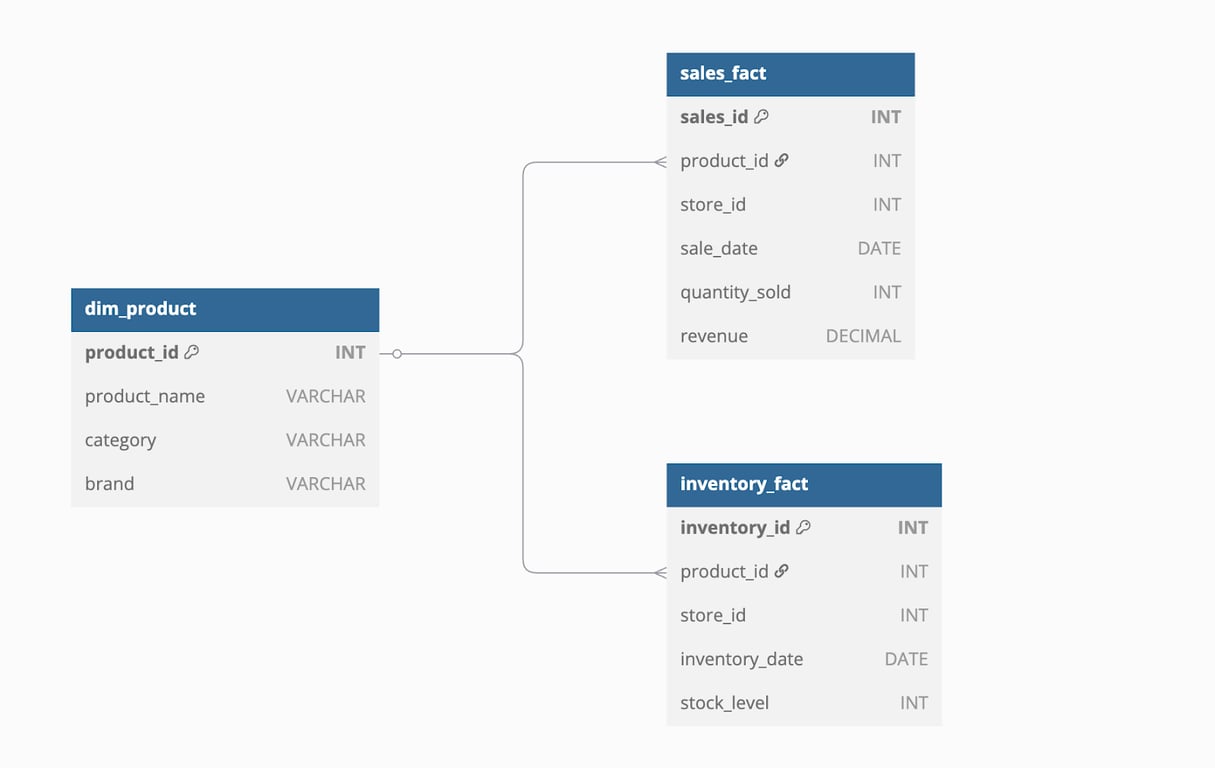
More on the method in dimensional data modeling.
Making a snowflake schema usable for reporting
Making a snowflake schema usable for reporting
The practical weakness of a snowflake schema is the join path. The analyst who built it knows that category group is two joins from the fact table. The person building a report often does not, and a wrong or missing join does not raise an error. It returns a different number.
There are two common fixes. One is to publish flattened views on top of the snowflake, so reports see a star. The other is to declare the join path once, so that tools follow it.
In OWOX Data Marts both are available. An analyst can define a Data Mart whose SQL already joins the branch, like the query above, and describe its output fields. Or each table can be its own Data Mart, with relationships declared between them on their keys. A report in Google Sheets or Looker Studio then picks fields across related Data Marts, and the join uses the declared key.
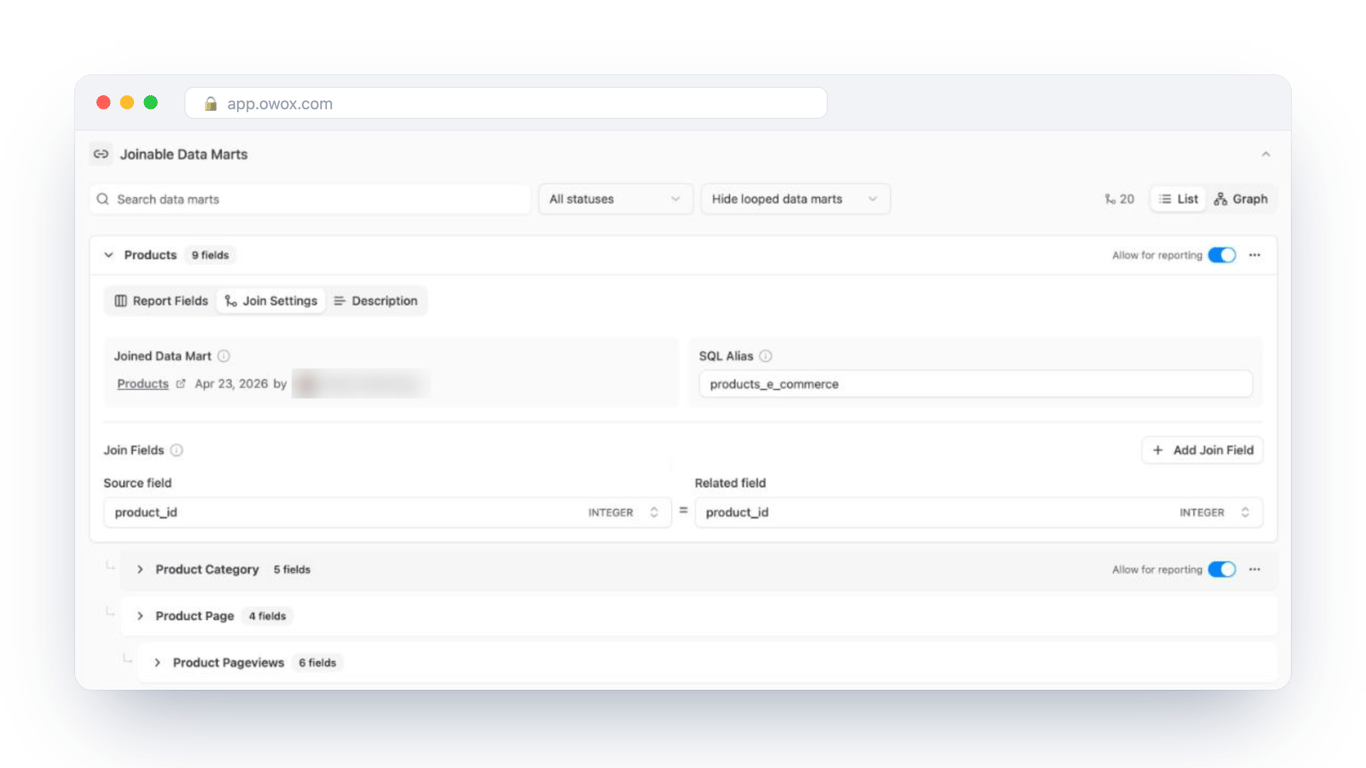
The analyst still designs the schema and writes the SQL. OWOX Data Marts publishes and governs it on the where the data lives: Google BigQuery, Snowflake, AWS Redshift, AWS Athena or Databricks. See Joinable Data Marts for how relationships work.
Turn your data into decisions.
Governed data marts give you the clean foundation ML needs to actually work.
- No AI hallucinations
- Analyst-governed definitions
- Every number traces to SQL
Frequently Asked Questions
What are the components of a snowflake schema?
A fact table with measures and dimension keys, dimension tables that describe the events, and sub-dimension tables that hold each level of a hierarchy, such as category and brand for a product. Surrogate keys connect every level.
What does a snowflake schema diagram show?
A fact table in the centre, dimension tables joined to it by keys, and further tables branching from those dimensions, one per level of each hierarchy. To read it, start at the fact table and count the joins to the attribute you need.
Is a snowflake schema the same as the Snowflake data warehouse?
No. A snowflake schema is a design pattern for laying out fact and dimension tables. Snowflake is a data warehouse product. A snowflake schema can be built on any warehouse, and most models stored in Snowflake the product are not snowflake schemas.
What are the disadvantages of a snowflake schema?
Every query needs more joins, business users have to know the join path, and there are more tables to keep complete. A missing row in a sub-dimension silently drops fact rows from an inner join. On a columnar warehouse the performance and storage gains are small.
When should you use a snowflake schema?
When a dimension's hierarchy is owned by another system, changes often, is shared by several dimensions, or is very large with long repeated text. If none of these applies, keep the dimension flat as in a star schema.
What are the advantages of a snowflake schema?
A hierarchy is stored once, so changing it is one row instead of a mass update. Attribute values stay consistent, sub-dimensions such as geography can be shared between dimensions, and reference data that is already normalized in its source loads without flattening.
How is a snowflake schema different from a star schema?
A star schema keeps each dimension as one denormalized table, so every attribute is one join from the fact table. A snowflake schema normalizes dimensions into sub-tables, for example product, category and category group, so reaching an attribute takes one join per level.