Types of data models and data modeling techniques in DBMS
Data models are classified in two ways. By level of detail there are three: conceptual, logical and physical. By structure there are the classic DBMS models: hierarchical, network, relational, entity-relationship, object-oriented and dimensional, plus document and graph. This guide explains each with an example and says which to use for what.
There are two answers to “what are the types of data models”, because data models are classified in two ways.
- By level of detail there are three: conceptual, logical and physical. They describe the same data, from a whiteboard sketch down to tables in a specific database.
- By structure there are the classic DBMS models: hierarchical, network, relational, entity-relationship, object-oriented and dimensional, with document and graph models as later additions.
A real project uses one from each list. A reporting warehouse, for example, is usually a dimensional structure taken through all three levels.
What a data model is
A model is a description of data: what things are recorded, what is known about each, and how they relate. It is written before the database and outlives any single report built on it.
A model answers three questions. What are the entities (customer, order, product)? What attributes does each have? How are they connected, and how many of one go with how many of the other? Everything else, from table design to the totals in a dashboard, follows from those answers. For the process of building one, see what is data modeling. For the description of what the data means and how each number is calculated, see semantic data models.
Types of data models at a glance
Types of data models at a glance
| Type | Classified by | Shape | Used for |
|---|---|---|---|
| Conceptual | Level | Entities and relationships, no detail | Agreeing scope with the business |
| Logical | Level | Entities, attributes, keys, no vendor | Designing the structure |
| Physical | Level | Tables, types, indexes on one database | Building it |
| Hierarchical | Structure | Tree, one parent per record | File systems, directories, XML |
| Network | Structure | Graph, many parents per record | Legacy mainframe systems |
| Relational | Structure | Tables joined by keys | Most business applications |
| Entity-relationship | Structure | Diagram of entities and relationships | Designing relational databases |
| Object-oriented | Structure | Objects with attributes and methods | Complex objects, CAD, media |
| Dimensional | Structure | Fact tables and dimension tables | Reporting and analytics |
| Document and graph | Structure | Nested documents, nodes and edges | Flexible content, connected data |
OWOX Data Marts
See your first report built in real time. 15 minutes.
- Connect your data warehouse
- Pick your metrics
- Get a live Google Sheets report
In the time it takes to write a ticket. Then imagine never writing that ticket again.
Book a DemoWe'll use your actual use case
The three levels: conceptual, logical and physical
The three levels: conceptual, logical and physical
The three levels are stages of one design, not alternatives. Each adds detail the previous one left out.
Conceptual data model
A conceptual model names the things the business tracks and how they relate. It has no data types and no keys, and it should be readable by someone who has never written SQL.
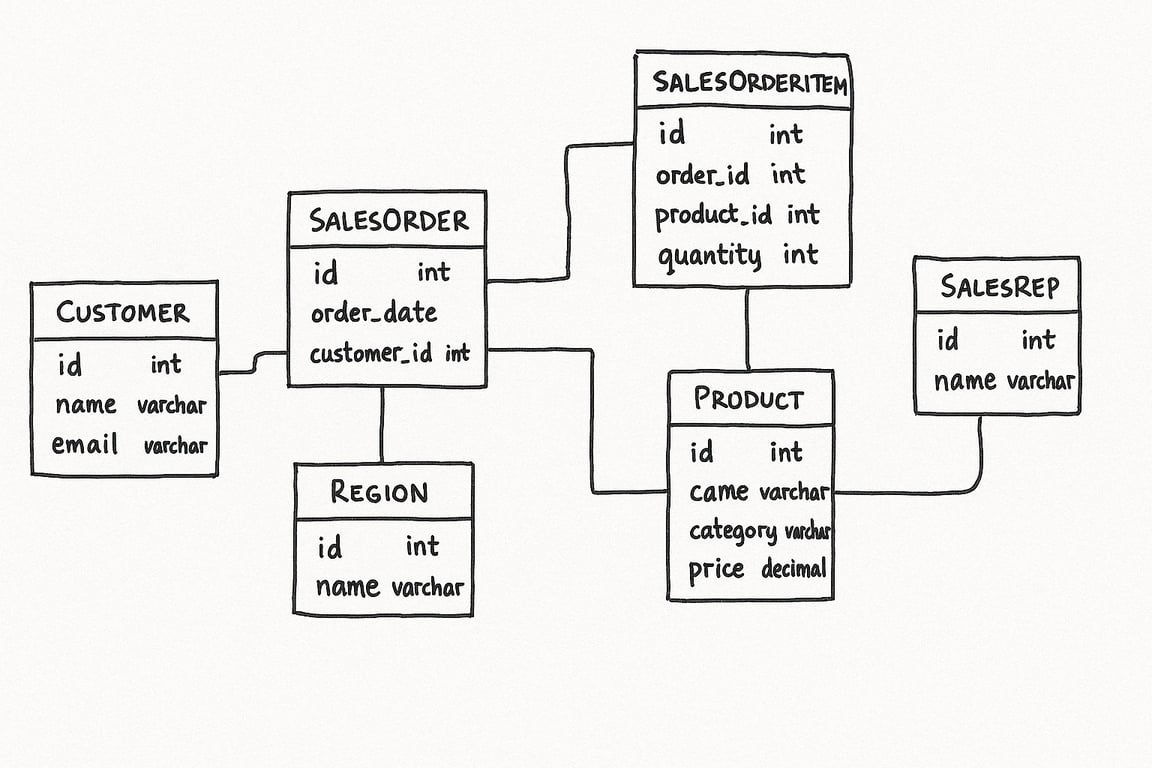
Its job is agreement. If sales and finance mean different things by “customer”, this is the cheapest place to find out. More in conceptual data modeling with examples.
Logical data model
A logical model adds every attribute, the primary and foreign keys, and the cardinality of each relationship. It is still independent of any database product.
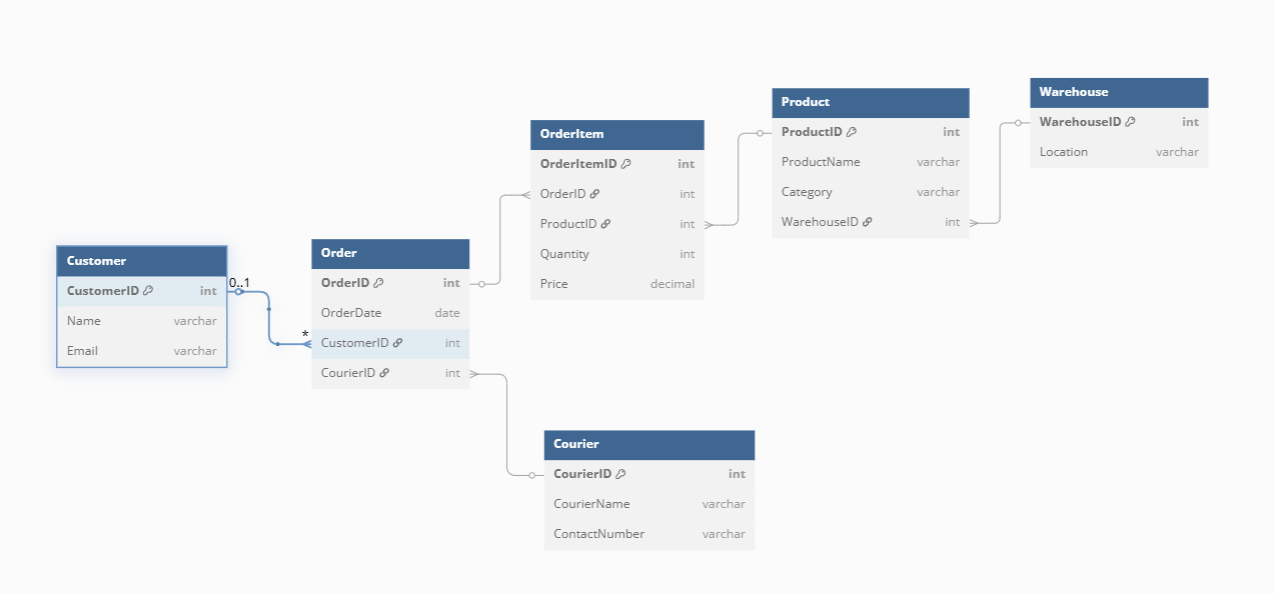
This is where structure is decided: what one row of each entity stands for, and which key connects it to the next.
Physical data model
A physical model is the logical model made concrete for one database: table and column names, data types, constraints, indexes, partitions.
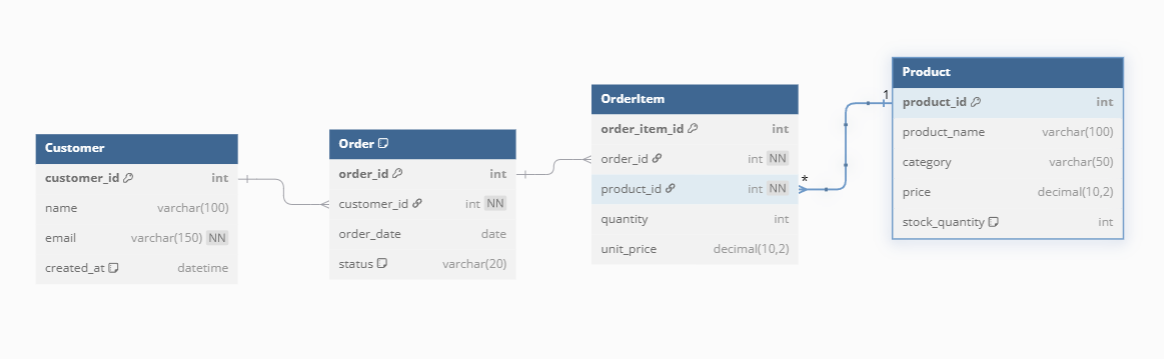
The same logical model produces different physical models on different platforms. A date column, a partition and a nested field are not declared the same way everywhere. For a side-by-side comparison, see logical vs physical data models.
| Conceptual | Logical | Physical | |
|---|---|---|---|
| Shows | Entities, relationships | Plus attributes, keys | Plus types, indexes |
| Depends on a database | No | No | Yes |
| Main reader | Business and analysts | Analysts, architects | Engineers |
Types of data models in DBMS, by structure
Types of data models in DBMS, by structure
The second classification is about how records are organised and linked. These are the models a DBMS course lists, in roughly the order they appeared.
Hierarchical data model
Data is a tree. Each record has one parent and any number of children, and you reach a record by walking down from the root. IBM’s IMS, built in the 1960s, is the classic example.
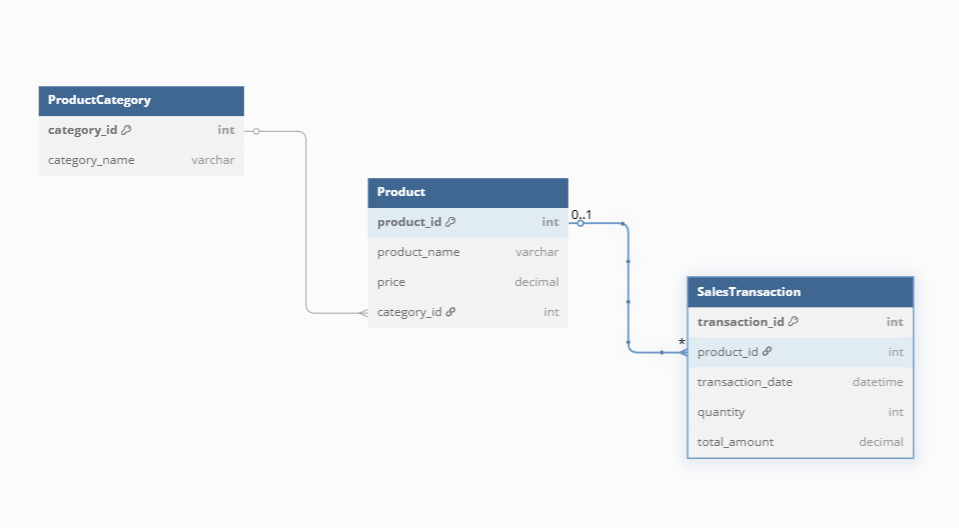
Example: category, then product, then sale. It is fast when questions follow the tree and awkward when they do not. A product in two categories has to be stored twice.
Network data model
The network model removes the one-parent limit: a record can have several parents, so the structure is a graph. It was standardised by CODASYL around 1970.
Example: an order line belongs both to an order and to a product. This handles many-to-many relationships, at the cost of programs that have to navigate the links by hand.
Relational data model
Data lives in tables. Rows are connected by matching values in key columns, and SQL retrieves them without the program knowing how they are stored. E. F. Codd proposed the model in 1970, and it is the default for business systems.
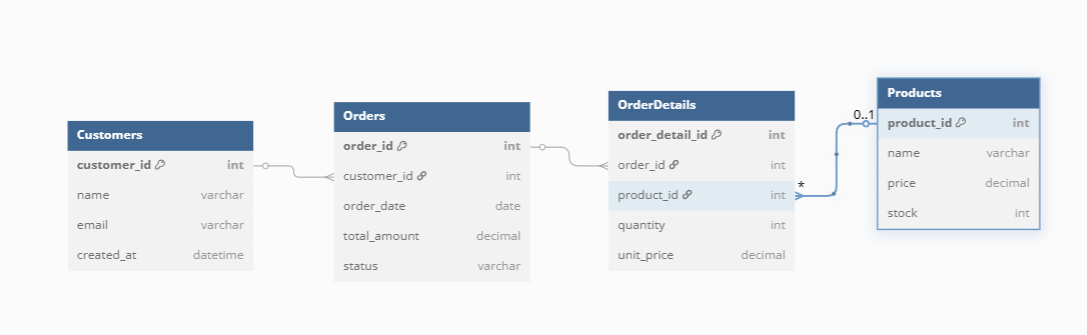
Example: Customers, Orders, OrderDetails and Products, joined on customer, order and product ids.
Entity-relationship model
The entity-relationship (ER) model, introduced by Peter Chen in 1976, is a way of drawing a design: entities as boxes, relationships as lines, attributes listed inside. It is a design notation more than a storage model, and most relational databases start as an ER diagram.
Example: the three diagrams in the previous section are all ER diagrams at different levels of detail.
Object-oriented data model
Data is stored as objects that bundle attributes with the methods that act on them, organised into classes with inheritance. It suits applications with complex, nested objects.
Example: DigitalProduct and PhysicalProduct both inherit name and price from Product. Details in object-oriented data models.
Dimensional data model
The dimensional model is built for reporting. Measurable events go into fact tables, and the things that describe them go into dimension tables. The usual layout is a star schema.
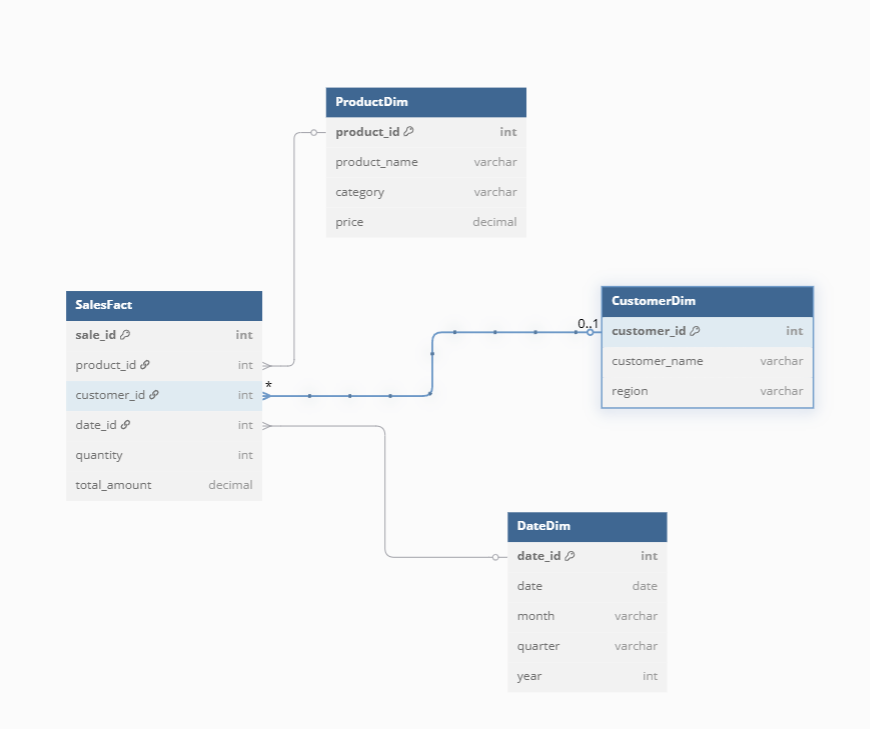
Example: a sales fact with quantity and amount, joined to product, customer and date dimensions. See star schema, snowflake schema and dimensional data modeling.
Document and graph models
Two later structures are common outside the classic list. A document model stores each record as a nested document, which suits content whose shape varies. A graph model stores nodes and the edges between them, which suits questions about connections, such as fraud rings or recommendations.
Which data model to use
Pick by the question the system has to answer most often.
| If you need to | Use |
|---|---|
| Record transactions reliably in an application | Relational, in normalized form |
| Report and aggregate across many records | Dimensional, as a star schema |
| Store complex objects exactly as the program holds them | Object-oriented or document |
| Follow connections several steps deep | Graph |
| Agree what the data means before building anything | Conceptual model first, in any of the above |
Most companies end up with two: a relational model inside each application and a dimensional model in the warehouse where the applications’ data is combined for reporting.
What a data model gives you, and what it does not
What a data model gives you, and what it does not
A model that is written down gives a team three things:
- One definition per thing. “Customer” and “order” mean the same in every table.
- Joins that are decided once. The keys and the cardinality are in the model, so nobody guesses them in a query.
- Cheaper change. A new source or metric is fitted into a known structure instead of bolted onto a report.
It does not keep itself true. A diagram in a wiki drifts from the tables within weeks, and a correct model does not stop a report from reading the wrong table. The common failure modes are in mistakes in data modeling.
From a data model to reports people can check
From a data model to reports people can check
For reporting, the practical test of a data model is whether the people building reports are held to it.
In OWOX Data Marts the model is made of the same objects the reports read. Each entity is a Data Mart: SQL, a table or a view that an analyst defines, with a description, an owner and described fields. The lines in the diagram are relationships between Data Marts, declared on their join keys. Together, the Data Marts in one data storage are the data model.
A report in Google Sheets or Looker Studio then picks fields from Data Marts and uses the declared joins. The model is not a separate document that can fall behind, because it is what the reports run on. The analyst still designs it and writes the SQL. The product publishes and governs it.
To start from an existing design instead of a blank page, the industry data models are worked examples, with walkthroughs for e-commerce, SaaS, fintech, healthcare and marketplaces, and Joinable Data Marts explains how relationships are declared.
Turn your data into decisions.
Governed data marts give you the clean foundation ML needs to actually work.
- No AI hallucinations
- Analyst-governed definitions
- Every number traces to SQL
Frequently Asked Questions
Which data model is used for reporting and analytics?
The dimensional model, usually laid out as a star schema: fact tables hold measurable events and dimension tables hold the things that describe them. Applications that record transactions use a normalized relational model, and the warehouse combines their data in dimensional form.
What are the types of data models?
By level of detail there are three: conceptual, logical and physical. By structure there are the classic DBMS models: hierarchical, network, relational, entity-relationship, object-oriented and dimensional, with document and graph models as later additions. A real project uses one from each list.