Machine learning in marketing: the uses your data can actually support
You have read the lists of machine learning uses in marketing and still cannot tell which ones you could run on the data you have. This guide keeps the uses that hold up today, says what each needs and who runs the model, and gives three SQL checks to run first. On our demo shop, no conversion campaign reaches Meta's learning threshold and the recency signal a churn or lifetime value model needs is flat; on Google's public demo shop it is not.
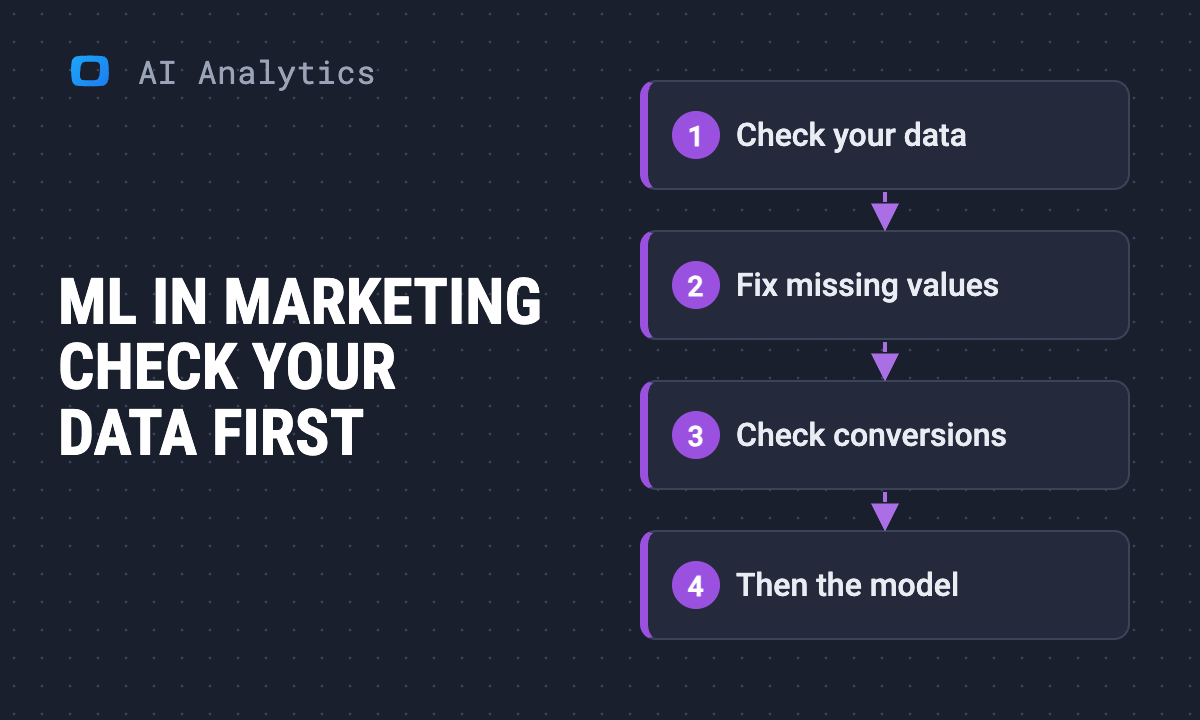
Most lists of machine learning in marketing give you eleven uses and no way to choose. The useful question is narrower: which of them can run on the data you already have? Three counts answer it, and if your orders and ad data already sit in one warehouse, you can get all three in an afternoon:
- Conversions per campaign per week. This decides whether the ad platforms’ own models can learn on your campaigns.
- Repeat buyers and history. This decides whether lifetime value and churn models have anything to learn from.
- A signal check. If the obvious behaviours (how recently, how often, how much) do not separate future buyers from the rest, no model will.
On our demo shop, the counts ruled out more than they allowed, which is worth knowing before anyone spends a quarter on a model.
The uses that hold up, and what each needs
The uses that hold up, and what each needs
The first question for each use is who runs the model. If the ad platform runs it, your job is feeding it enough clean conversions. If you run it, you need the data, the history and someone to maintain it.
| Use | Who runs the model | What it needs from you |
|---|---|---|
| Bidding and targeting in ad platforms | The platform | Enough conversions per campaign, sent back correctly |
| Data-driven attribution in GA4 | Key events set up and tracked | |
| Customer segmentation | You or your analyst | A customer table with orders joined to it |
| Lifetime value prediction | A data team | Repeat buyers, a year or more of orders, a signal |
| Churn prediction | A data team | The same, plus a written definition of churn |
| Sales and demand forecasting | You or a data team | At least two years of daily history, so every season appears twice |
The uses most lists add, such as chatbots, sentiment analysis and content optimization, run on tools rather than on your own marketing data, so the checks below do not decide them.
Bidding and targeting: the platform’s model, your conversions
Meta says an ad set leaves the learning phase “after about 50 results in the week after the ad set’s last significant edit” (Meta Business Help Center, read October 2026). Google, on its help page for judging Target CPA, recommends you “measure performance for the last 30 days, including at least 30 conversions” (Google Ads Help, read October 2026).
Those two numbers turn “should we use automated bidding” into a count you can run.
Attribution: machine learning you already have
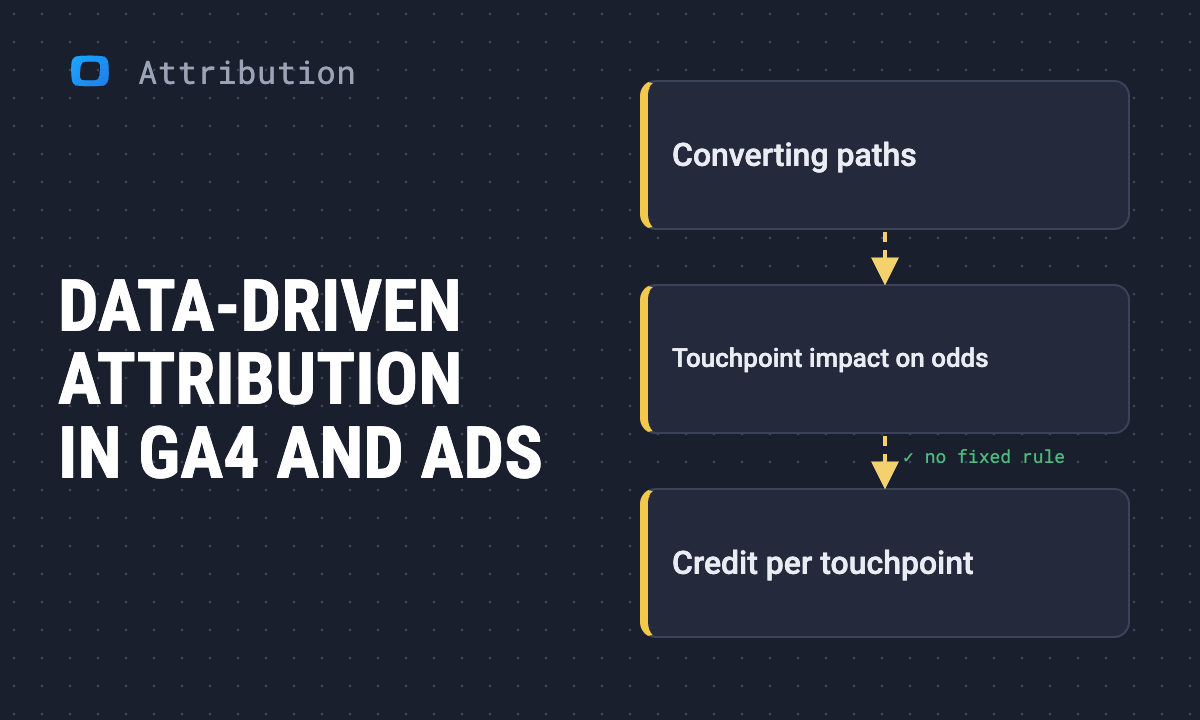
GA4’s data-driven attribution “uses machine learning algorithms to evaluate both converting and non-converting paths” (Google Analytics Help, read October 2026). In our view, for most teams that is the machine learning in attribution worth using, and the question is no longer which model to build but which decisions to make with it. See data-driven attribution for how it assigns credit.
Lifetime value and churn: only if there is a signal
Both models predict who buys again. They need customers who have bought more than once, a long enough history to see what happened after, and a behaviour that differs between people who came back and people who did not. The third condition is the one most teams skip, and it is the cheapest to test. In most shops recency is the first place to look: our RFM analysis guide explains why it usually separates buyers best.
Check your data first: three SQL queries
Check your data first: three SQL queries
The queries below ran on our demo e-commerce data in Google BigQuery on 26 October 2026. The data is synthetic: a demo shop, not a customer. Your table and column names will differ; if SQL is not your job, hand these three to whoever owns your warehouse. Each one only reads data.
1. Conversions per campaign per week
WITH last_day AS (
  SELECT MAX(date) AS d
  FROM `owox-demo.ecommerce.ad_performance`
),
weekly AS (
  SELECT
    source,
    campaign,
    DATE_TRUNC(date, WEEK) AS week,
    SUM(platform_conversions) AS conversions
  FROM `owox-demo.ecommerce.ad_performance`, last_day
  WHERE date > DATE_SUB(last_day.d, INTERVAL 30 DAY)
  GROUP BY source, campaign, week
)
SELECT
  source,
  campaign,
  SUM(conversions) AS conversions_30d,
  MAX(conversions) AS best_week
FROM weekly
GROUP BY source, campaign
ORDER BY conversions_30d DESC
On the demo shop, 17 campaigns have rows in the 30 days to 17 October 2026; the ad data in this table ends there, while orders run to today. The six with the most conversions:
| Campaign | 30 days | Best week |
|---|---|---|
| Facebook, retargeting, cart abandoners | 59 | 16 |
| Facebook, brand awareness, US | 58 | 23 |
| TikTok, video views, cold traffic | 38 | 13 |
| Facebook, prospecting, lookalike 2% | 35 | 12 |
| TikTok, conversions, warm audience | 25 | 9 |
| TikTok, brand awareness, US | 22 | 9 |
Each platform has its own rule, so read the results platform by platform:
- Facebook (Meta’s rule, about 50 results a week per ad set): Meta counts each ad set’s own optimisation event, so only the campaigns built for conversions belong in this check: the cart-abandoner retargeting and the lookalike prospecting campaigns. Their best calendar weeks are 16 and 12; Meta counts the 7 days after an ad set’s last significant edit, which can shift a week’s total by a few, not by 30. A campaign total is an upper bound for any one ad set inside it, so none of their ad sets clears the threshold. The awareness and video-views campaigns optimise for other events and are left out.
- Google (Google’s guideline for judging a bid strategy, 30 conversions in 30 days): the best Google campaign has 13. None reaches it.
- TikTok and Microsoft Advertising: not checked against their own published rules here.
2. Repeat buyers and history
WITH completed AS (
  SELECT customer_id, order_date
  FROM `owox-demo.ecommerce.orders`
  WHERE status = 'Completed'
    AND customer_id IS NOT NULL
),
per_customer AS (
  SELECT customer_id, COUNT(*) AS orders
  FROM completed
  GROUP BY customer_id
)
SELECT
  (SELECT MIN(order_date) FROM completed) AS first_order,
  (SELECT MAX(order_date) FROM completed) AS last_order,
  COUNT(*) AS customers,
  COUNTIF(orders >= 2) AS repeat_customers
FROM per_customer
Completed orders run from 1 January 2024 to 26 October 2026. 4,768 customers placed at least one, and 4,082 of them placed two or more. On paper, that is plenty for a lifetime value model, though a repeat rate of 86% is itself a sign that this is generated data rather than a live shop.
3. The signal check
Pick a cutoff date six months back. Split the customers who had bought by then into four equal groups by how recently they last bought, and see what share of each group bought again in the six months after.
WITH completed AS (
  SELECT customer_id, order_date
  FROM `owox-demo.ecommerce.orders`
  WHERE status = 'Completed'
    AND customer_id IS NOT NULL
),
before_cutoff AS (
  SELECT
    customer_id,
    DATE_DIFF(DATE '2026-04-28', MAX(order_date), DAY) AS days_since_last
  FROM completed
  WHERE order_date <= DATE '2026-04-28'
  GROUP BY customer_id
),
after_cutoff AS (
  SELECT DISTINCT customer_id
  FROM completed
  WHERE order_date > DATE '2026-04-28'
    AND order_date <= DATE '2026-10-25'
),
labelled AS (
  SELECT
    b.days_since_last,
    a.customer_id IS NOT NULL AS bought_again,
    NTILE(4) OVER (ORDER BY b.days_since_last, b.customer_id) AS recency_group
  FROM before_cutoff AS b
  LEFT JOIN after_cutoff AS a USING (customer_id)
)
SELECT
  recency_group,
  COUNT(*) AS customers,
  MIN(days_since_last) AS from_days,
  MAX(days_since_last) AS to_days,
  ROUND(AVG(IF(bought_again, 1, 0)) * 100, 1) AS pct_bought_again
FROM labelled
GROUP BY recency_group
ORDER BY recency_group| Group | Days since last order | Bought again in the next 6 months |
|---|---|---|
| 1 (most recent) | 0 to 80 | 45.3% |
| 2 | 80 to 171 | 46.6% |
| 3 | 171 to 340 | 46.0% |
| 4 (least recent) | 340 to 848 | 47.1% |
Each group holds 1,143 customers; where customers share a boundary value, it can appear in two groups. How recently someone bought makes no difference to whether they buy again: the rates sit within two points of each other, and the least recent group is slightly ahead.
OWOX Data Marts
See your first report built in real time. 15 minutes.
- Connect your data warehouse
- Pick your metrics
- Get a live Google Sheets report
In the time it takes to write a ticket. Then imagine never writing that ticket again.
Book a DemoWe'll use your actual use case
What the checks said about our demo shop
What the checks said about our demo shop
Bidding: merge before you automate. No Facebook conversion campaign gets near Meta’s 50 a week, and no Google campaign reaches the 30 in 30 days Google suggests for judging a bid strategy. Run campaign by campaign, the platforms’ models would be working with a fraction of the volume their own guidance describes. The machine-learning decision here is a structure decision: fewer, larger campaigns first.
Lifetime value and churn: the data is there, the recency signal is not. 4,082 repeat buyers is enough volume. But recency, the first signal such a model would lean on, came back flat. Run the same split by number of orders and by spend before you decide; here we checked recency only. That is expected here, because the demo data is generated without real buying habits. The next check shows what a pass looks like. In a real shop, a flat result points to something you can fix first, such as one person split across several customer ids, or orders missing from the table.
What a pass looks like. We ran the same check on thelook_ecommerce, a fictitious clothing shop that Google publishes as a public BigQuery dataset, with the cutoff 180 days before its last order. It ran on 26 October 2026; the dataset refreshes daily, so a re-run will move the cutoff and the numbers a little:
WITH completed AS (
  SELECT user_id AS customer_id, DATE(created_at) AS order_date
  FROM `bigquery-public-data.thelook_ecommerce.orders`
  WHERE status = 'Complete'
),
cutoff AS (
  SELECT DATE_SUB(MAX(order_date), INTERVAL 180 DAY) AS d
  FROM completed
),
before_cutoff AS (
  SELECT
    customer_id,
    DATE_DIFF(cutoff.d, MAX(order_date), DAY) AS days_since_last
  FROM completed, cutoff
  WHERE order_date <= cutoff.d
  GROUP BY customer_id, cutoff.d
),
after_cutoff AS (
  SELECT DISTINCT customer_id
  FROM completed, cutoff
  WHERE order_date > cutoff.d
),
labelled AS (
  SELECT
    b.days_since_last,
    a.customer_id IS NOT NULL AS bought_again,
    NTILE(4) OVER (ORDER BY b.days_since_last, b.customer_id) AS recency_group
  FROM before_cutoff AS b
  LEFT JOIN after_cutoff AS a USING (customer_id)
)
SELECT
  recency_group,
  COUNT(*) AS customers,
  MIN(days_since_last) AS from_days,
  MAX(days_since_last) AS to_days,
  ROUND(AVG(IF(bought_again, 1, 0)) * 100, 1) AS pct_bought_again
FROM labelled
GROUP BY recency_group
ORDER BY recency_group| Group | Days since last order | Bought again in the next 180 days |
|---|---|---|
| 1 (most recent) | 0 to 224 | 5.9% |
| 2 | 224 to 546 | 3.8% |
| 3 | 546 to 1,062 | 2.8% |
| 4 (least recent) | 1,062 to 2,658 | 2.2% |
About 5,200 customers sit in each group. Here the most recent buyers come back at 2.7 times the rate of the least recent. Few of them come back at all, but recency sorts them, which is the first input a lifetime value or churn model needs. That is a pass.
What we would run on our demo shop: segmentation by what people buy and cohort analysis, both on the order data as it stands, and the two checks again each quarter.
Machine learning in attribution: where the decisions sit
Machine learning in attribution: where the decisions sit
Attribution feeds decisions at four levels, and machine learning helps at two of them:
| Level | Who decides, how often | What machine learning does there |
|---|---|---|
| Vision | Board and marketing director, yearly | Little. Brand and offline spend are not in the click data |
| Strategy | Marketing and e-commerce directors, monthly | Data-driven attribution helps split budget between channels |
| Tactics | Paid acquisition manager, weekly | Less: per-campaign volumes are often too small for a model of your own |
| Execution | Inside the ad platforms, in real time | The platforms’ own bidding models, if they have the conversions |
At execution level the platforms see every auction and act in real time, and an outside model sees neither. Your leverage is upstream, in the strategy decisions and in the conversions you send the platforms.
Where OWOX Data Marts fits
OWOX Data Marts does not train models. It keeps the three checks above as SQL in your warehouse that an analyst writes once and publishes as Data Marts, so the counts refresh on a schedule and arrive in a report in Sheets. When a check finally says yes, the model itself runs where the data is. In Google BigQuery, BigQuery ML “lets you create and run machine learning (ML) models by using either GoogleSQL queries” (Google Cloud documentation, read October 2026). Our guide to BigQuery ML covers that step.
What to do this week
- Run the conversions query on the campaigns built for conversions. A Meta ad set well below about 50 results a week, or a Google campaign below the 30 in 30 days Google suggests for judging a bid strategy, is a candidate for merging with a neighbour before you judge automated bidding on it. For other platforms, check their own published rule.
- Run the repeat-buyer query. If repeat customers are a small share, start with segmentation or cohort analysis, not lifetime value prediction.
- Run the signal check. If the four groups come back at nearly the same rate, fix customer identity and order tracking before you buy a model. If they separate, you have the first input a lifetime value or churn model needs.
Turn your data into decisions.
Governed data marts give you the clean foundation ML needs to actually work.
- No AI hallucinations
- Analyst-governed definitions
- Every number traces to SQL
Frequently Asked Questions
How does machine learning help advertising?
Mostly through the ad platforms' own models: automated bidding and targeting in Google Ads and Meta. They need enough conversions to learn from. Meta says an ad set leaves the learning phase after about 50 results in the week after its last significant edit, and Google recommends judging a bid strategy on the last 30 days with at least 30 conversions. Count conversions per campaign per week before you switch automated bidding on; if few campaigns reach those numbers, merging campaigns helps more than any model.
When is machine learning worth it in marketing?
When your data passes three checks: enough conversions per campaign per week for the ad platforms' models, enough repeat buyers and history for lifetime value or churn models, and a signal, meaning that how recently, how often or how much people bought actually separates future buyers from the rest. If a check fails, fix the data or the campaign structure first; a model will not find what the data does not hold.
Which machine learning uses can a marketing team run without a data team?
Three, usually: automated bidding and targeting in the ad platforms, data-driven attribution in GA4, which uses machine learning to evaluate converting and non-converting paths, and customer segmentation on your order data. Lifetime value prediction, churn prediction and demand forecasting need more history, a written definition of the outcome, and someone to maintain the model.
What is machine learning in marketing?
Software that learns patterns from your past marketing and sales data and uses them to predict or decide: which bid to place, which customers are likely to buy again, how a channel contributed to a sale. Most marketing teams already use it inside ad platforms and GA4. Building your own models only pays off when your data has the volume and the signal to learn from.
What data do you need for customer lifetime value prediction?
Customers who have bought more than once, a year or more of order history so you can see what happened after each purchase, and a behaviour that differs between customers who came back and those who did not. Test the last one first: split customers by how recently they last bought and check what share of each group bought again in the following months. If the groups come back at nearly the same rate, a model has nothing to learn from.