
What Is Snowflake? A Beginner’s Guide
Discover Snowflake’s role in modern analytics, how it centralizes data, supports teams, and delivers trusted insights without technical jargon

If you work in marketing, product, or business operations, you’ve probably heard people say, “Let’s put it in Snowflake,” or “The data lives in Snowflake.” But what is Snowflake, really? And why is everyone in analytics so excited about it?
.png)
This guide explains Snowflake in plain language, without assuming a background in data engineering. By the end, you should understand what Snowflake does, how it fits into your analytics stack, and how you can start using it to get reliable, governed data for reporting and decision-making.
What Is Snowflake in Simple Terms?
At its core, Snowflake is a cloud data warehouse.
You can think of it as:
A single, central place in the cloud where your company securely stores, organizes, and analyzes large volumes of data – without having to manage servers, disks, or complicated infrastructure.
Instead of:
- Scattered spreadsheets
- Separate databases for each tool
- Manual CSV exports from ad platforms or CRMs
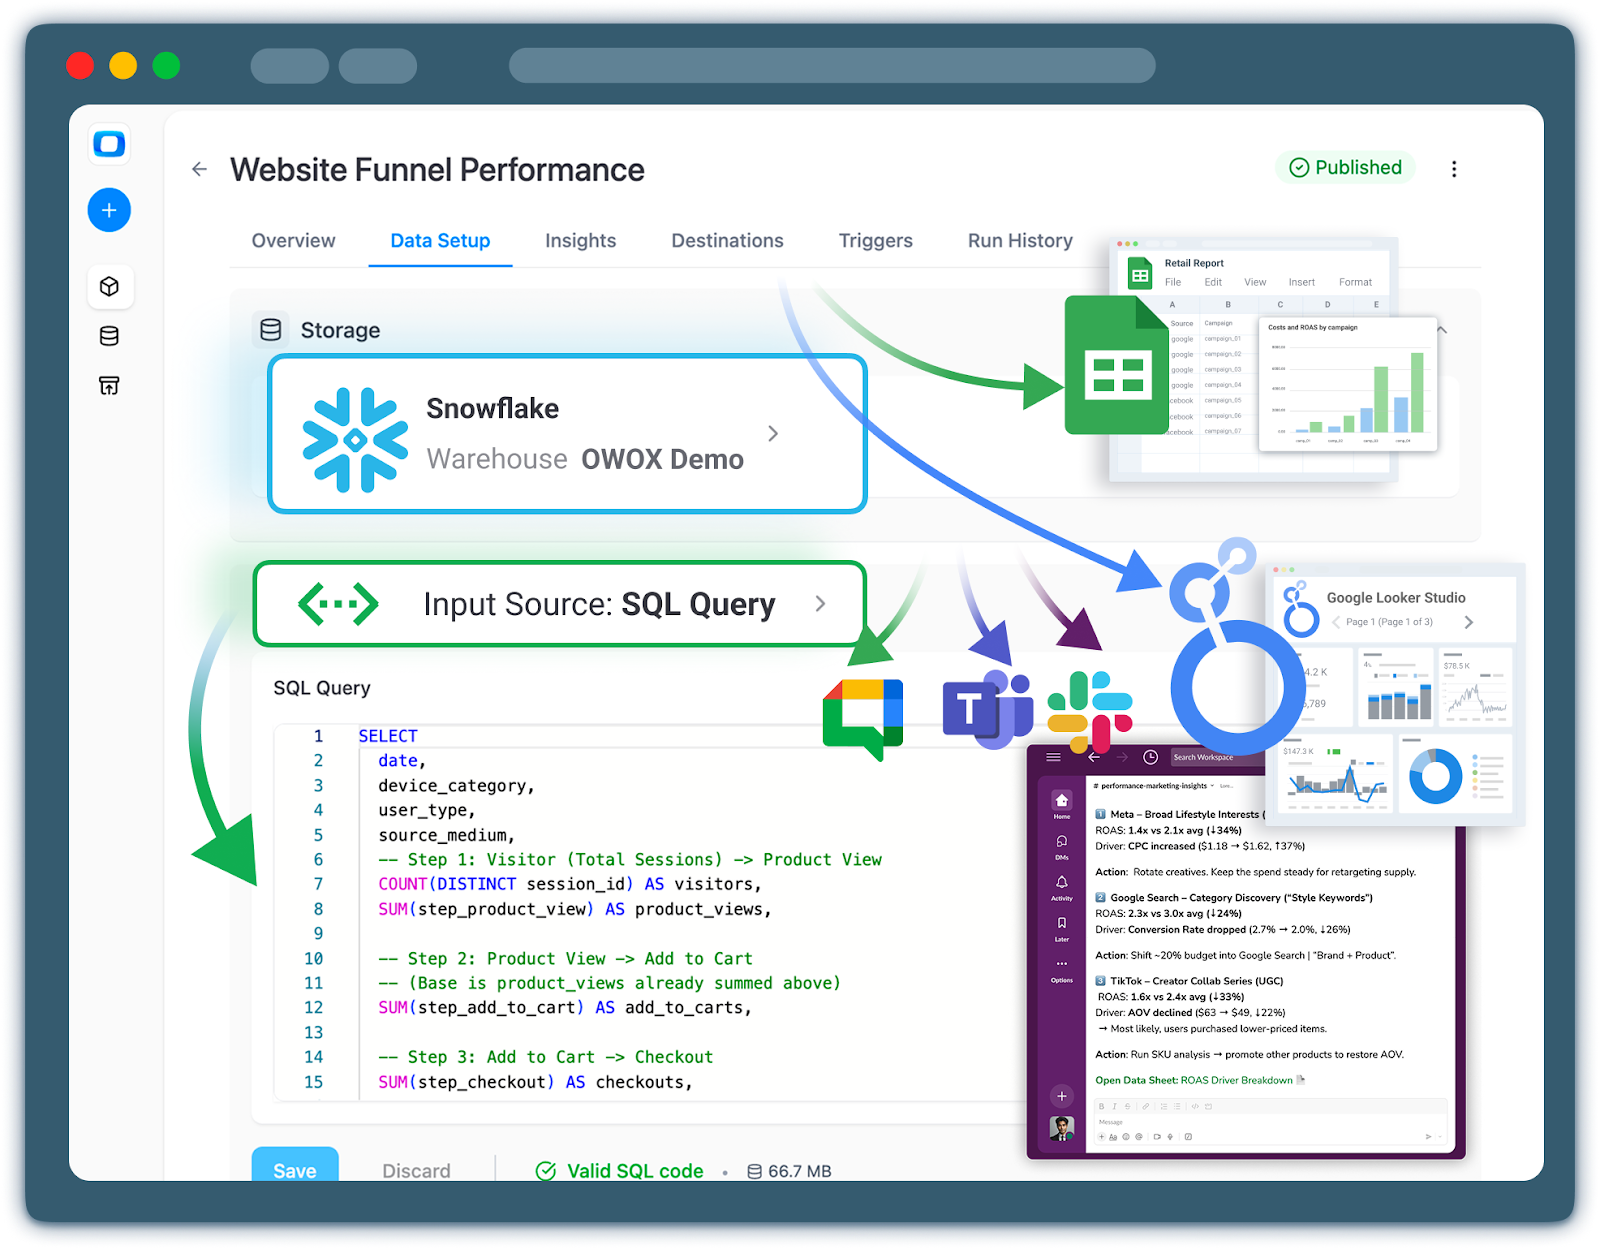
Snowflake lets you bring everything together in one environment, and then analyze it using SQL and your preferred BI tools (Google Sheets, Looker Studio, Power BI, Tableau, etc.)

Some key points in plain English:
- Cloud-native
Snowflake runs on top of cloud providers like AWS, Google Cloud, and Azure. You don’t install hardware or maintain databases – Snowflake handles that. - Store now, analyze when you need
You can load a lot of raw data into Snowflake and then transform, join, and aggregate it later for specific use cases. - Built for many teams, not just IT
Marketing, product, finance, and operations teams can all query the same, consistent source of data (with access controls), instead of building their own disconnected datasets.
Why Snowflake Matters for Business and Analytics Teams
From a business perspective, Snowflake is less about technology and more about how quickly and reliably you can get answers from your data.
Fewer “Data Versions of the Truth”
Without a central warehouse, each team:
- Pulls its own reports
- Applies its own filters and definitions
- Stores data in its own tools (or spreadsheets)
This leads to classic questions in meetings:
- “Why does my report show different revenue than yours?”
- “Which number should we trust?”
- “Where did this metric come from?”
With Snowflake, you aim for a single, governed source of truth:
- Shared tables and metrics definitions
- Standardized logic for revenue, conversions, cohorts, etc.
- Clear data ownership and documentation
That doesn’t just make analysts happy – it reduces debate and speeds up decisions.
Scale Without Constant Rework
As your business grows, you will:
- Add more ad channels and experiments
- Launch more products and markets
- Collect more event and behavioral data
Snowflake is designed to handle growth without:
- Rebuilding dashboards from scratch each time
- Hitting “performance limits” in spreadsheets or BI tools
- Overloading your production databases with analytics queries
You store data once in Snowflake, then build many use cases on top of it.
Key Concepts: Storage, Compute, and Separation
Snowflake’s architecture is often described as “separation of storage and compute.” You don’t need to understand all the technical details, but there are two core ideas that matter for business users.
1. Storage: Where the Data Lives
All your data – events, transactions, marketing spend, CRM records, etc. – is stored in Snowflake tables in the cloud.
Important for non-engineers:
- You don’t worry about disks or capacity planning.
- You can keep years of data, not just a few months.
- Historical data remains available for re-analysis (e.g., cohorts or LTV).
Think of storage as the library: it holds all the books (data), organized and cataloged.
2. Compute: How You Process and Analyze Data
When you run a query, build a dashboard, or transform data, Snowflake uses compute resources (called “virtual warehouses”) to process it.
You can size and scale these independently of storage:
- Small computing for simple reports
- Larger compute for heavy transformations or large joins
- Different compute clusters for different teams or workloads
Back to the analogy:
- Storage = the library shelves
- Compute = the librarians working to find and organize the books for you
The big benefit: you pay for the work being done, not for idle servers, and you can tune performance for each use case.
How Snowflake Fits into a Modern Analytics Stack
Snowflake is typically the central layer in your analytics ecosystem. At a high level, your data flow looks like this:
Sources
- Web & app analytics (e.g., GA4, server-side tracking)
- Marketing platforms (Google Ads, Meta, LinkedIn, etc.)
- Product events (in-app behavior, feature usage)
- CRM and sales (HubSpot, Salesforce, Pipedrive)
- Payments and billing
- Internal databases and spreadsheets
Ingestion / ETL / ELT tools
- Tools that extract data from those sources and load it into Snowflake (like OWOX Data Marts).
Snowflake
- Central storage and processing environment.
- Where data is cleaned, joined, modeled, and governed.
Data models/marts
- Business-ready tables designed for specific questions and teams (marketing effectiveness, product funnels, revenue analytics, etc.).
BI and analytics tools
- Where end-users explore data and create dashboards:
- Looker Studio, Power BI, Tableau, Sheets, etc.
Snowflake is the foundation layer: if it’s well-structured and governed, everything above it (dashboards, experimentation reports, LTV models) becomes easier, faster, and more reliable.
What Makes Snowflake Different From Traditional Databases?
From a non-engineer’s perspective, Snowflake stands out in several practical ways.
Cloud-First, Not “Cloud-Adapted”
Many older data warehouses were built for on-premise hardware and later moved to the cloud. Snowflake was designed from day one to run natively in the cloud.
Implications for you:
- No hardware procurement or maintenance cycles.
- Fast onboarding for new projects or teams.
- Easier to scale globally and across regions.
Concurrency Without Stepping on Each Other’s Toes
In traditional systems, if many people run heavy queries at once, everyone slows down.
Snowflake’s architecture allows:
- Multiple independent compute clusters running against the same data.
- Dedicated resources for different teams or workloads (e.g., marketing vs. finance).
- Isolation of heavy processing jobs from day-to-day reporting.
That means your nightly data processing or complex modeling doesn’t make dashboards unusable for business users in the morning.
Flexible Pricing and Usage
Because storage and compute are separate, you can:
- Store large amounts of data relatively cheaply.
- Control compute costs by:
- Choosing appropriate warehouse sizes,
- Scheduling or pausing the compute when not in use,
- Isolating expensive workloads.
For business teams, this usually translates into predictable costs and the ability to experiment without committing to huge upfront infrastructure investments.
Is Snowflake Only for Big, Technical Companies?
No. Snowflake is used by large enterprises, but its core ideas are helpful even for small teams or companies early in their data journey.
Typical signs your organization is ready for Snowflake:
- You’re combining data from multiple sources (ads, analytics, CRM, product, and billing).
- Your key reports require manual merges in spreadsheets.
- Teams frequently question which numbers are correct.
- You plan to scale experiments, channels, or product analytics.
You don’t need a large data engineering team to start; you need clear priorities and a small, focused scope for the first use cases (for example, marketing ROI and attribution, or core product usage funnels).
This is also where pre-built, business-focused data marts and templates can accelerate adoption: they help you go from “raw data in Snowflake” to “trusted metrics in dashboards” much faster, without designing every model from scratch.
How OWOX Data Marts Help You Get Value From Snowflake Faster
A common challenge with Snowflake is not getting data in, but rather turning raw data into metrics your teams can actually use.
OWOX provides:
- Pre-built, Snowflake-ready data models tailored to marketing and product analytics.
- Business-focused schemas for common questions like:
- “Which channels drive high-LTV customers?”
- “How do cohorts behave over time?”
- “Where do users drop out in our funnels?”
- A self-service interface for configuring and operating these models without building everything from scratch.
You can:
- Start with a clear, narrow use case (e.g., cross-channel marketing performance).
- Plug your existing data sources into Snowflake.
- Deploy ready-made OWOX Data Marts on top of Snowflake to get business-ready tables for dashboards and analysis.
If you’d like to explore this path, you can get started free and see how OWOX Data Marts work on top of your Snowflake environment:
Core Concepts Of Snowflake Explained In Plain Language
To get value from Snowflake, you don’t need to become a database engineer – but you do need a clear mental model of how things are organized and how your queries run.
This section explains the core concepts in everyday language, enabling you to confidently communicate with your data team, review models, and understand what’s happening under the hood when you open a dashboard or run a report.

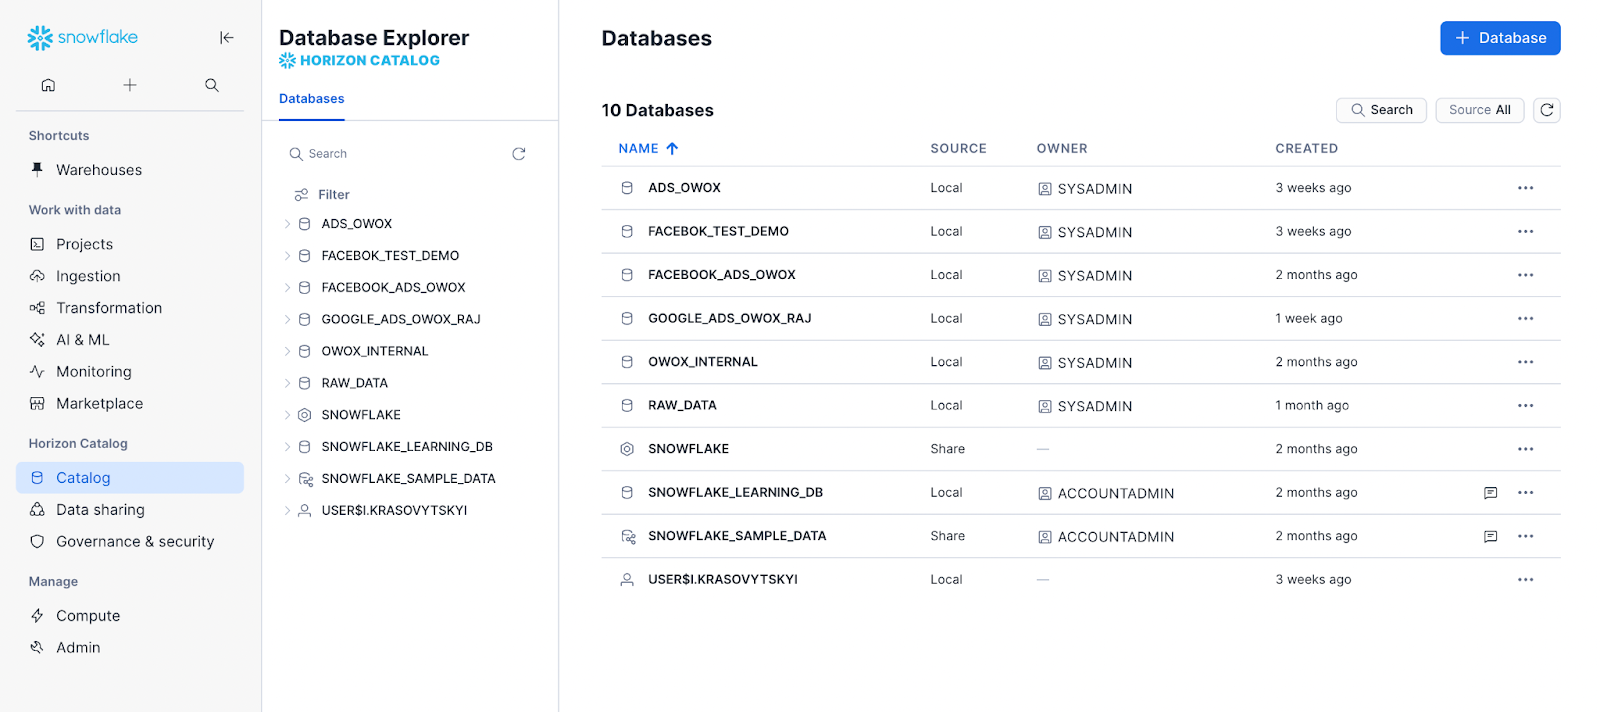
Databases, Tables, And Schemas In Snowflake
Snowflake uses familiar database concepts, but it helps to translate them into something more intuitive.
Imagine you’re looking at a well-organized digital library:
- A database is like a collection (e.g., “Marketing Analytics” or “Product Analytics”).
- A schema is a section inside that collection (e.g., “raw data”, “clean data”, “marts”).
- A table is a spreadsheet-like file inside a section, with rows and columns (e.g., ad_spend, events, customers).
In Snowflake:
- You can have multiple databases for different domains or environments
- Example: ANALYTICS_PROD, ANALYTICS_DEV, FINANCE.
- Each database can contain multiple schemas
- Example inside ANALYTICS_PROD:
- RAW – data as loaded from sources.
- CORE – cleaned and standardized data.
- MARTS – business-ready tables for reporting.
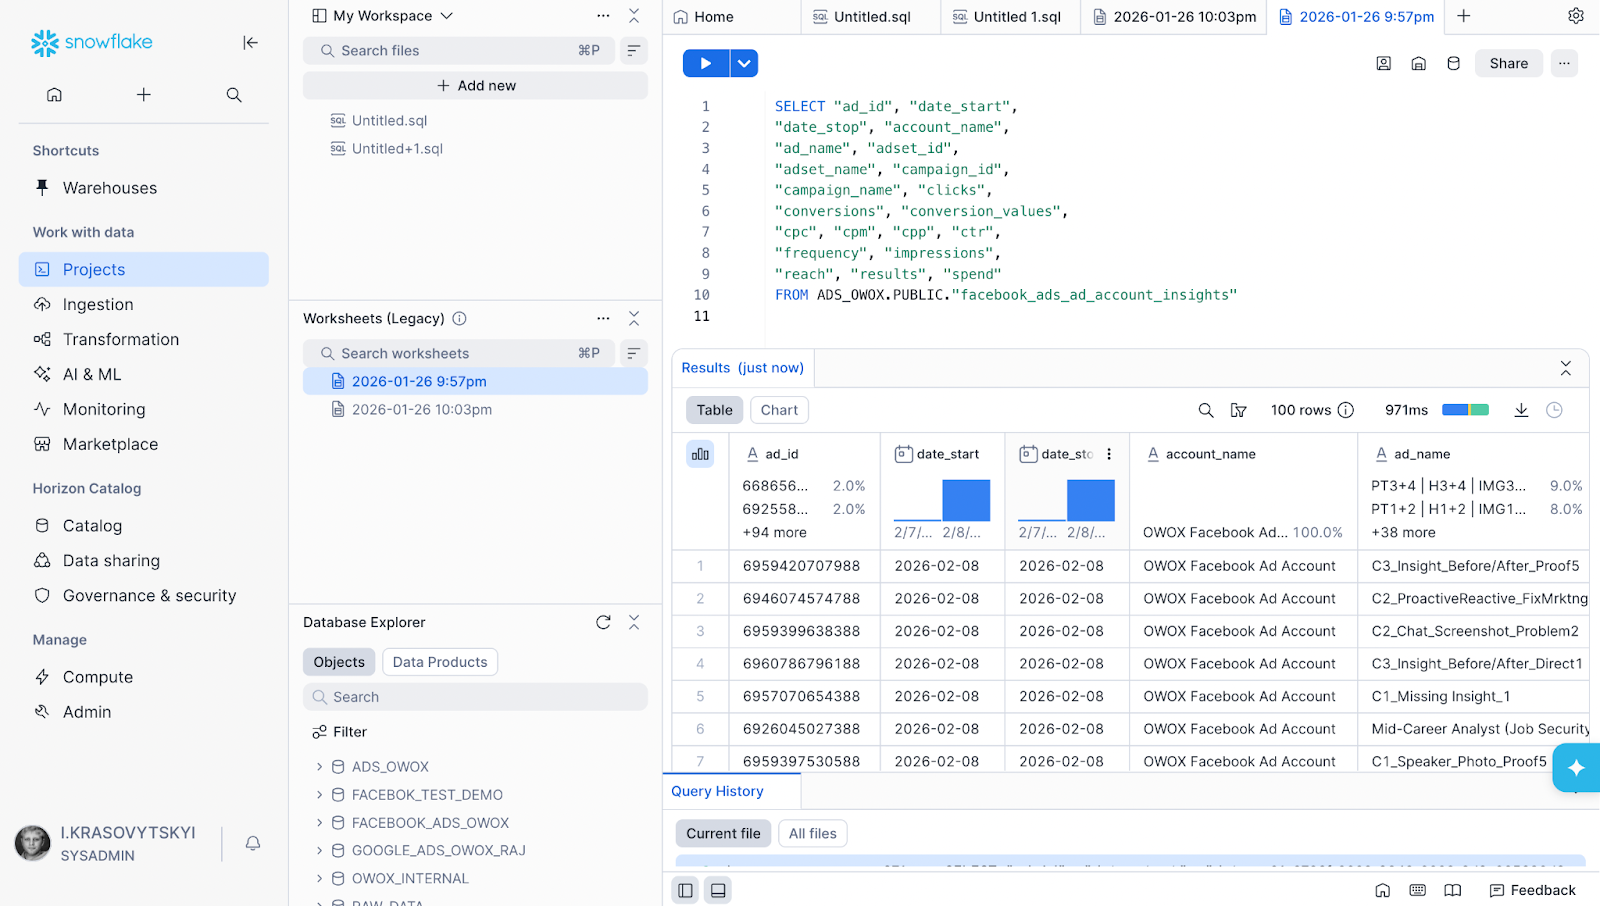
- Each schema contains tables and views
- Tables: actual stored data (e.g., RAW.GA4_EVENTS, RAW.FACEBOOK_ADS).
- Views: “saved queries” that present data in a certain way without copying it.
For non-engineers, the critical takeaway:
- Ask which database, schema, and table your report is using.
This tells you: - How “raw” or “modeled” the data is,
- Who owns it,
- And how safe it is to use for business decisions.
Business-focused layers like OWOX Data Marts, for example, typically live in a dedicated schema (e.g., MARTS.OWOX_MARKETING) to make it clear that these tables are curated and ready for BI tools.
Storage, Compute, And Services: The Three Key Layers
Snowflake’s power comes from a simple but important architectural idea: separating storage, compute, and services.
Think of running analytics like running a restaurant:
- Storage = your pantry and fridge (ingredients).
- Compute = your kitchen and chefs (cooking).
- Services = your front-of-house staff and management system (orders, reservations, rules).
Snowflake follows the same pattern.
1. Storage Layer – Where Data Lives
- All data loaded into Snowflake is stored once, in compressed form, in cloud storage.
- It’s columnar storage (optimized for analytics), but you don’t need to manage file formats or partitions.
From your perspective:
- You can store large datasets without worrying about their physical location.
- Storage is relatively cheap compared to compute.
- The same stored data can be queried by many different compute clusters.
2. Compute Layer – Where Work Happens
- Compute in Snowflake is provided by virtual warehouses (we’ll dive deeper in the next section).
- Each virtual warehouse is an independent cluster of compute resources that can:
- Run queries,
- Transform data,
- Load data into tables.
The key point: compute is separate from storage, so you can scale processing power up or down without touching where data is stored.
3. Services Layer – The “Brain” Of The Platform
This layer handles:
- Authentication and access control (who can see what).
- Query parsing and optimization.
- Metadata and catalog (what objects exist, where, and in which format).
- Transactions and concurrency control.
In restaurant terms, this is the reservation system, wait staff, and manager:
- They decide who gets a table (access).
- They route orders to the right kitchen (query planning).
- They keep track of what’s happening at each table (metadata).
Why separation matters:
- You can scale compute for heavy jobs without replicating data.
- Many teams can work with the same storage simultaneously, each using their own compute.
- Governance (services layer) stays consistent across everything.
Virtual Warehouses: How Snowflake Runs Your Queries
Now, let’s focus on the most practical concept for everyday analytics work: virtual warehouses.
A virtual warehouse in Snowflake is:
A pool of compute resources that Snowflake uses to execute your queries and transformations.
Returning to the restaurant analogy:
- Storage = fridge and pantry.
- Virtual warehouse = a specific kitchen with its own chefs.
- Services = host and manager sending orders to kitchens.
When you or your BI tool runs a query:
- Snowflake’s services layer receives it.
- The query is assigned to a virtual warehouse.
- That warehouse reads data from storage, processes it, and returns the result.
Key properties of virtual warehouses that matter for business users:
Size controls speed and cost
- Larger warehouses can process complex queries faster, but cost more per minute.
- Smaller ones are cheaper but slower on heavy workloads.
You can have many warehouses
- Example:
- WH_ETL for nightly data processing.
- WH_BI_MEDIUM for dashboards.
- WH_DATA_SCIENCE for experimentation.
Each runs independently against the same stored data.
You can start, stop, and auto-suspend
- Warehouses can automatically pause when idle and resume when queries arrive.
- This lets you pay only for active compute, not for infrastructure sitting idle.
Concurrency without collisions
- If marketing is running a heavy cohort analysis and finance is refreshing month-end reports, they can use different warehouses.
- One workload doesn’t “lock” the system for everyone else.
For teams using Snowflake with curated models – for example, OWOX Data Marts feeding dashboards – a common pattern is:
- A robust ETL/ELT warehouse to build and refresh the marts.
- Smaller, always-on BI warehouses serving day-to-day reporting.
You don’t need to manage the technical details, but understanding that “our dashboards run on this warehouse, our data processing runs on that one” helps you:
- Diagnose performance issues,
- Have informed budget discussions,
- And plan for new analytics use cases without fear of “breaking the database.”
Why Choose Snowflake as a Cloud Data Warehouse?
You don’t need to know every engineering detail of Snowflake to use it effectively. But understanding a few big ideas about how it works makes it much easier to:
- Plan new analytics use cases,
- Talk to your data team about performance and costs,
- And trust the platform with sensitive, business‑critical data.
Think of this as an X‑ray view of Snowflake: just enough to see what’s going on inside, in plain language.

Separation Of Storage And Compute And Why It Matters
One of Snowflake’s most important design choices is separating storage (where data lives) from compute (the processing power that runs queries).
A simple analogy:
- Storage = a shared, cloud-based “hard drive” that safely keeps all your data.
- Compute = different “engines” you can attach to that hard drive to process and analyze the data.
Because these are separate, you get several practical benefits.
1. Flexible scaling
- You can store as much data as you need without buying new servers.
- You can scale compute up or down depending on the workload:
- Small engine for quick, lightweight queries.
- Bigger engine for complex transformations or month-end reporting.
You’re never stuck with one “size” of system that is too small for heavy tasks or too big (and expensive) for everyday queries.
2. Cost control
- Storage is billed mostly by how much data you keep.
- Compute is billed only while it’s running.
- You can pause the computation when it’s not needed,
- Use cheaper, smaller compute for routine dashboards, spin up powerful compute only when big jobs are running.
This lets analytics leaders align spend with value: high compute cost only when you’re doing high-impact work.
3. Independence of workloads
Different teams (or types of work) can use separate compute on the same shared data, so one activity doesn’t block another. This becomes crucial as you add more data and more users across the company.

Concurrency And Performance: Many Teams Querying At Once
In older systems, when too many people ran reports at the same time, everything slowed down. It was like having one kitchen serving the entire restaurant – once orders pile up, everyone waits.
Snowflake solves this with its architecture and virtual warehouses:
- Each virtual warehouse is like its own kitchen with dedicated chefs.
- All kitchens share the same pantry (storage), but they prepare meals (queries) independently.
What this means in day-to-day work:
- Marketing, product, and finance can all run heavy queries at the same time without stepping on each other’s toes.
- Data engineers can run nightly or hourly processing jobs without freezing dashboards for business users.
- You can create dedicated compute for:
- Ad‑hoc analysis,
- Scheduled reporting,
- Data science experiments,
- ETL/ELT pipelines.
Snowflake also automatically optimizes queries behind the scenes (indexing, caching, clustering, etc.), but you don’t need to manage these manually. You simply experience:
- Faster queries on large datasets,
- Fewer timeouts in BI tools,
- And much less “please don’t refresh that dashboard right now” coordination.
If you’re using business-ready layers like OWOX Data Marts on top of Snowflake, this concurrency model means:
- One warehouse can handle building and updating the marts.
- Another can serve dashboards and self-service exploration.
So analysts stay productive, and business users get fast, reliable reporting.
Security, Governance, And Access Control Basics
Snowflake is often the central place where companies store some of their most sensitive data: customer information, revenue numbers, product usage, and more. That’s why security and governance are built into the core of the platform.
You can think of Snowflake’s security model as three layers: locking the building, controlling rooms, and tracking what happens.
1. Locking the building: secure connection and encryption
- All connections to Snowflake use secure protocols (encrypted in transit).
- Data is automatically encrypted when stored (“at rest”).
- This ensures that even if someone intercepted traffic or accessed raw storage, they couldn’t read the data.
2. Controlling rooms: roles and permissions
- Users are assigned roles (like “analyst”, “marketing_viewer”, “admin”).
- Roles define:
- Which databases and schemas they can see
- Which tables they can query
- Whether they can modify data or only read it

3. This lets you implement principles like:
- Marketing can see aggregated performance data but not raw PII.
- Finance can see revenue details but not internal experimentation logs.
- External partners get access to dedicated, limited views only.
4. Tracking what happens: auditing and governance
Snowflake keeps track of:
- Who ran which query
- When access was granted or changed
- How data is being used
5. For data leaders, this supports:
- Compliance efforts (GDPR, SOC, etc.)
- Internal policies on data access
- Incident investigation when needed
On top of Snowflake’s native controls, curated layers such as OWOX Data Marts can help further by:
- Exposing only the fields and tables business users actually need,
- Keeping raw, sensitive data in more restricted schemas,
- Ensuring that dashboards and reports use consistent, approved metrics.
The outcome is simple but powerful: teams get fast, broad access to trustworthy data, while the organization maintains tight control over who can see what and how it’s used.
When To Use Snowflake: Common Beginner-Friendly Use Cases
Snowflake is most valuable when your data questions outgrow spreadsheets and disconnected tools. You start feeling it when:
- Reports from different teams don’t match.
- “Just one more” CSV export breaks your master file.
- Stakeholders wait days for numbers that should be available in hours or minutes.
Below are practical, beginner-friendly scenarios where Snowflake makes an immediate difference.

Centralizing Marketing, Product, And Finance Data In One Place
A classic first step with Snowflake is simply getting all your key data into one trusted place.
Instead of:
- Marketing pulling from ad platforms and web analytics,
- Product working with event logs and feature flags,
- Finance relying on billing and CRM exports,
…Snowflake becomes the shared hub where all of this data lands and is kept in sync.
Typical examples:
Marketing
- Combine spend from Google Ads, Meta, LinkedIn, etc.
- Join with website/app behavior and CRM data to see full-funnel performance.
Product
- Centralize product events, experiments, feature usage, and user attributes.
- Understand which behaviors correlate with retention, upgrades, or churn.
Finance / RevOps
- Bring together invoicing, subscriptions, and pipeline data.
- Build reliable revenue, MRR, and cohort views.
Business benefits:
- One version of “how many customers we have”, “what our revenue is”, and “which channels work”.
- Less time reconciling numbers, more time discussing decisions.
- A foundation that can serve many teams, not just analytics.
This is also where OWOX Data Marts help you skip the “blank slate” and jump straight to curated, business-ready models on top of Snowflake.
Powering BI Dashboards And Self-Service Analytics
Once your data is centralized, Snowflake becomes the engine behind your dashboards and self-service analytics.
Instead of every dashboard connecting directly to raw APIs or fragile spreadsheets, BI tools read from clean, governed tables in Snowflake.
Concrete use cases:
Executive dashboards
- Unified views of revenue, acquisition, engagement, and churn pulled from multiple systems.
Marketing performance reports
- Channel and campaign dashboards showing spend, conversions, and LTV in one place.
Product and growth analytics
- Feature usage, funnels, and cohorts that refresh automatically.
How does this change everyday work:
- Analysts define robust models once (often via data marts), then expose them to BI tools.
- Business users can slice by country, segment, channel, or product without raising a ticket every time.
- Dashboards refresh on a schedule, giving near real-time visibility without manual exports.
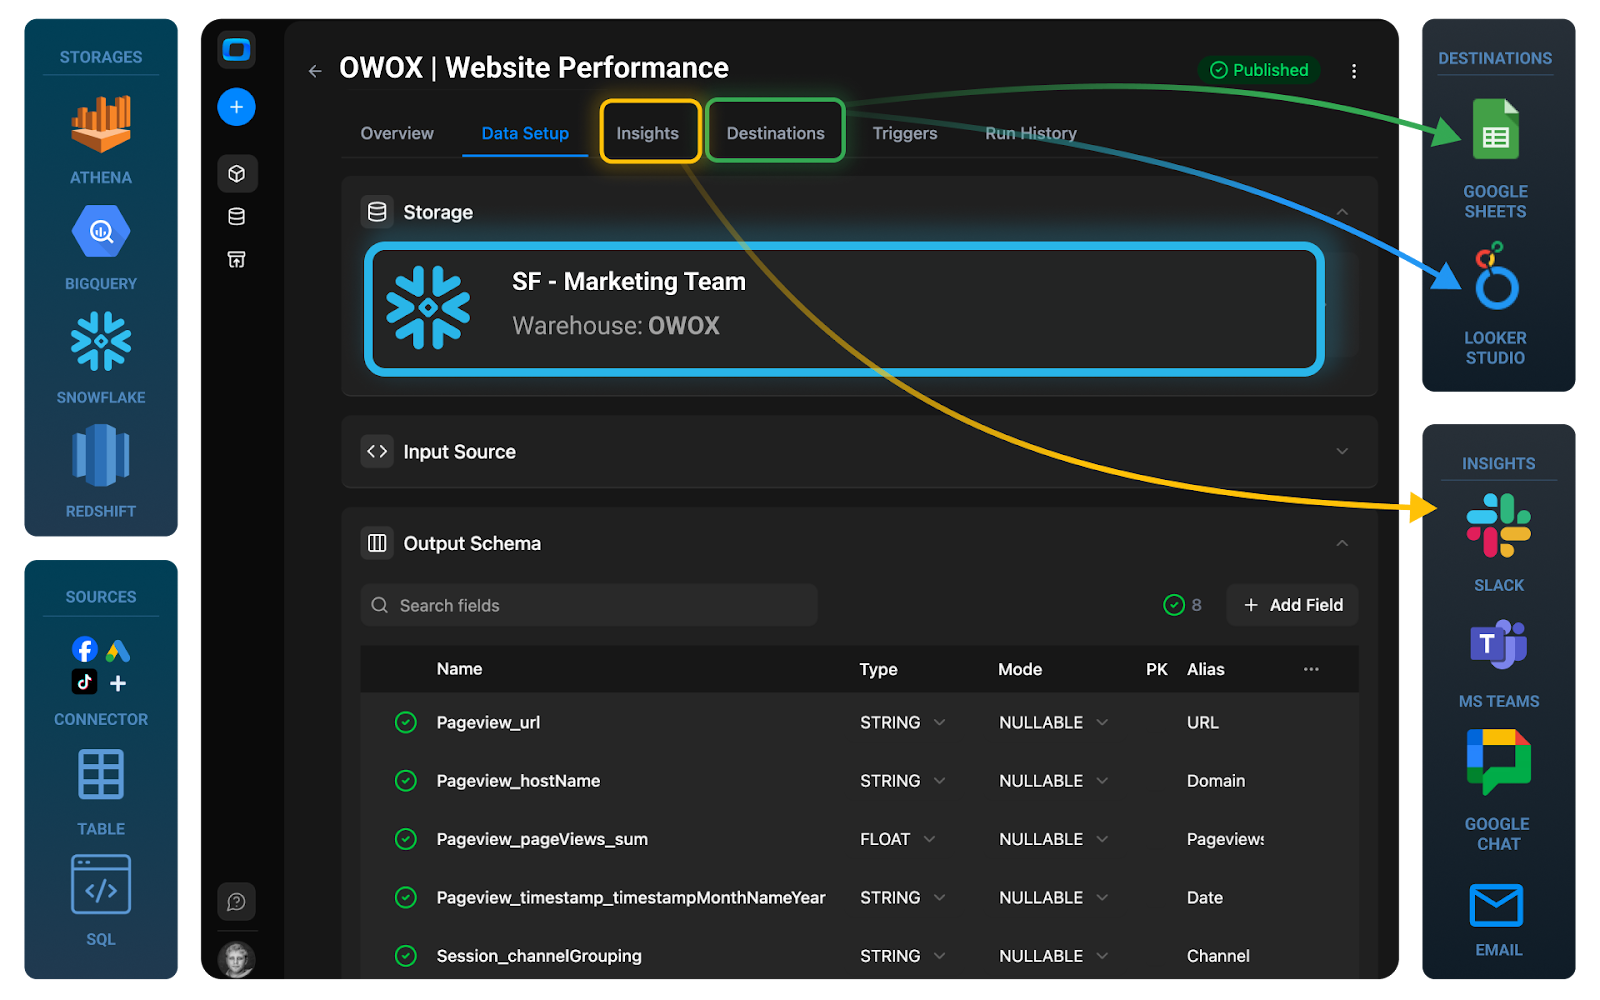
When Snowflake is paired with OWOX Data Marts, you can go from raw connectors to trusted Looker Studio or Google Sheets dashboards significantly faster, with less work automated.
Supporting AI And Advanced Analytics When You Are Ready
You don’t need AI or data science to justify Snowflake. But if you do want to move toward more advanced analytics, a strong Snowflake foundation makes that path much smoother.
Examples of “next-step” use cases:
- Propensity and churn models
Train models on centralized behavioral and revenue data to predict which customers are likely to convert or leave. - Budget allocation and optimization
Use historical performance data to simulate or optimize channel and campaign spend. - Personalization and recommendations
Feed product and marketing systems with Snowflake-derived insights about segments and behaviors.

For these scenarios, Snowflake serves as:
- The feature store, where modeling data is prepared and kept consistent,
- The source of truth for training and evaluation datasets,
- And the delivery hub that powers AI-driven decisions across tools.
The important point for beginners: by centralizing data and standardizing metrics in Snowflake today, you avoid painful rework later when your organization is ready to invest in data science, machine learning, or AI-assisted decision-making.
What You Still Need on Top of Snowflake
Snowflake solves a big part of the analytics puzzle, but not the entire thing. Misunderstanding this is one of the fastest ways to end up disappointed – or with a very expensive “data lake of chaos.”
This section sets expectations clearly so you know where Snowflake fits, and what else you need around it to deliver trusted, business-ready metrics.

Snowflake Is Not An ETL Tool Or Reporting Tool
It’s easy to assume Snowflake automatically “does everything with data” because so many tools integrate with it. In reality:
Myth: “If we put data in Snowflake, we’ll get reports automatically.”
Reality: Snowflake stores and processes data, but it doesn’t extract it from sources or visualize it for you.
Snowflake is not an ETL / ELT tool:
- It doesn’t connect directly to Google Ads, Meta, GA4, your CRM, or billing tools and pull data on its own.
- You still need pipelines (connectors, scripts, ETL/ELT platforms) to bring data into Snowflake and keep it updated.
Snowflake is also not a dashboard or BI tool
- It doesn’t allow you to build charts, dashboards, or slide-ready reports.
- Tools like Google Sheets Looker Studio, Power BI, Tableau sit on top of Snowflake to present data to users.
Snowflake is not a “push a button and get reports” solution
- Snowflake doesn’t inherently know what “LTV”, “qualified lead”, or “active user” means for your business.
- Those definitions must be implemented in data models and metrics logic.
What Snowflake does provide is a secure, scalable environment where all of this can happen – but you still need the right tools and modeling work around it.
But the good news is that you can use tools like OWOX Data Marts to build the whole data-mart and reporting layer on top of your Snowflake data - enable corporate data in Spreadsheets, BI Tools as well as AI Insights to deliver notifications and findings on a schedule.
Why You Need Data Marts On Top Of Snowflake
Loading raw data into Snowflake is only step one. Without structure, you just have a centralized dump of tables with different schemas, naming conventions, and grain – not something most business users can safely work with.
This is where data marts come in.
Data modeling means:
- Defining how different tables relate (customers, orders, sessions, campaigns, etc.).
- Standardizing keys, timestamps, and dimensions.
- Encoding business logic (which events count as a signup, what is a conversion, and how to calculate revenue).
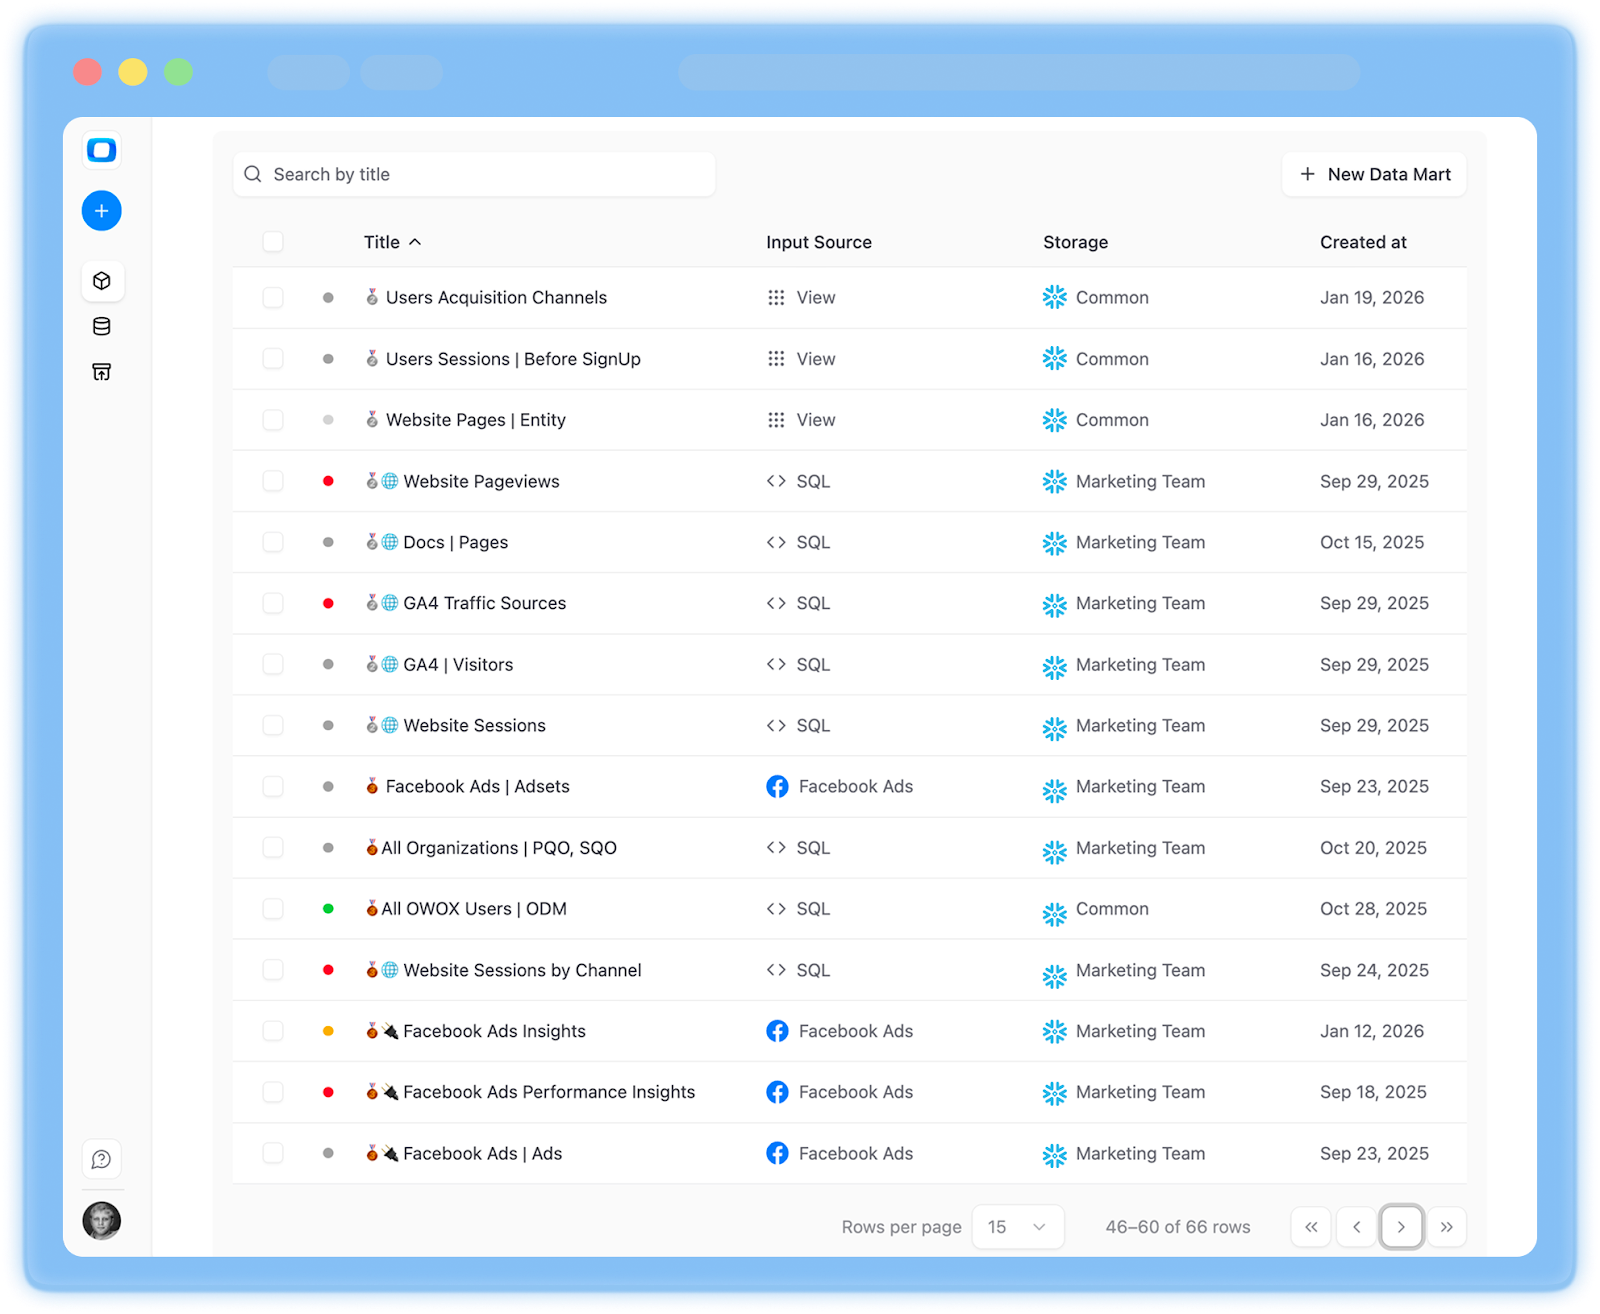
Data marts are:
- Curated, purpose-built tables or SQLs for specific use cases and teams answering specific area-focused business questions.
- Examples:
- A marketing performance mart with metrics by channel, campaign, and country.
- A product analytics mart with user cohorts, funnels, and feature usage.
- A revenue mart with MRR, churn, and expansion by segment.
Without these layers, analysts and business users are forced to:
- Write complex SQL against raw tables for every new question.
- Repeat logic in multiple dashboards, increasing the risk of inconsistencies.
- Spend time rebuilding the same metrics instead of analyzing them.
Solutions like OWOX Data Marts sit on top of Snowflake and handle a lot of this modeling work for you – turning raw marketing and product data into business-ready models that BI tools can use directly.
How Governed Self-Service Analytics Prevents Metric Chaos
Many teams want “self-service analytics” – the ability for marketers, product managers, and stakeholders to answer their own questions without always relying on analysts.
That’s only a good idea if it’s governed.
Without governance, self-service often turns into:
- Dozens of slightly different “LTV” or “ROI” definitions live in different dashboards.
- Filters and joins are applied inconsistently from one report to the next.
- Conflicting numbers in leadership meetings, with no clear source of truth.
Snowflake provides the technical capabilities to support this (roles, views, secure data sharing). But you still need:
- Thoughtful data modeling,
- Clear governance rules,
- And curated layers like OWOX Data Marts to deliver self-service that scales without sacrificing trust.
Done right, you get the best of both worlds: fast, flexible access to data and consistent, reliable metrics across your organization.
How OWOX Data Marts Turns Snowflake Into A Self-Service Analytics Hub
Snowflake gives you the right foundation: scalable storage, fast compute, and secure access. But on its own, it’s still a technical platform. Most marketers, product managers, and business leaders don’t want to write SQL or maintain complex data models – they just want reliable answers.
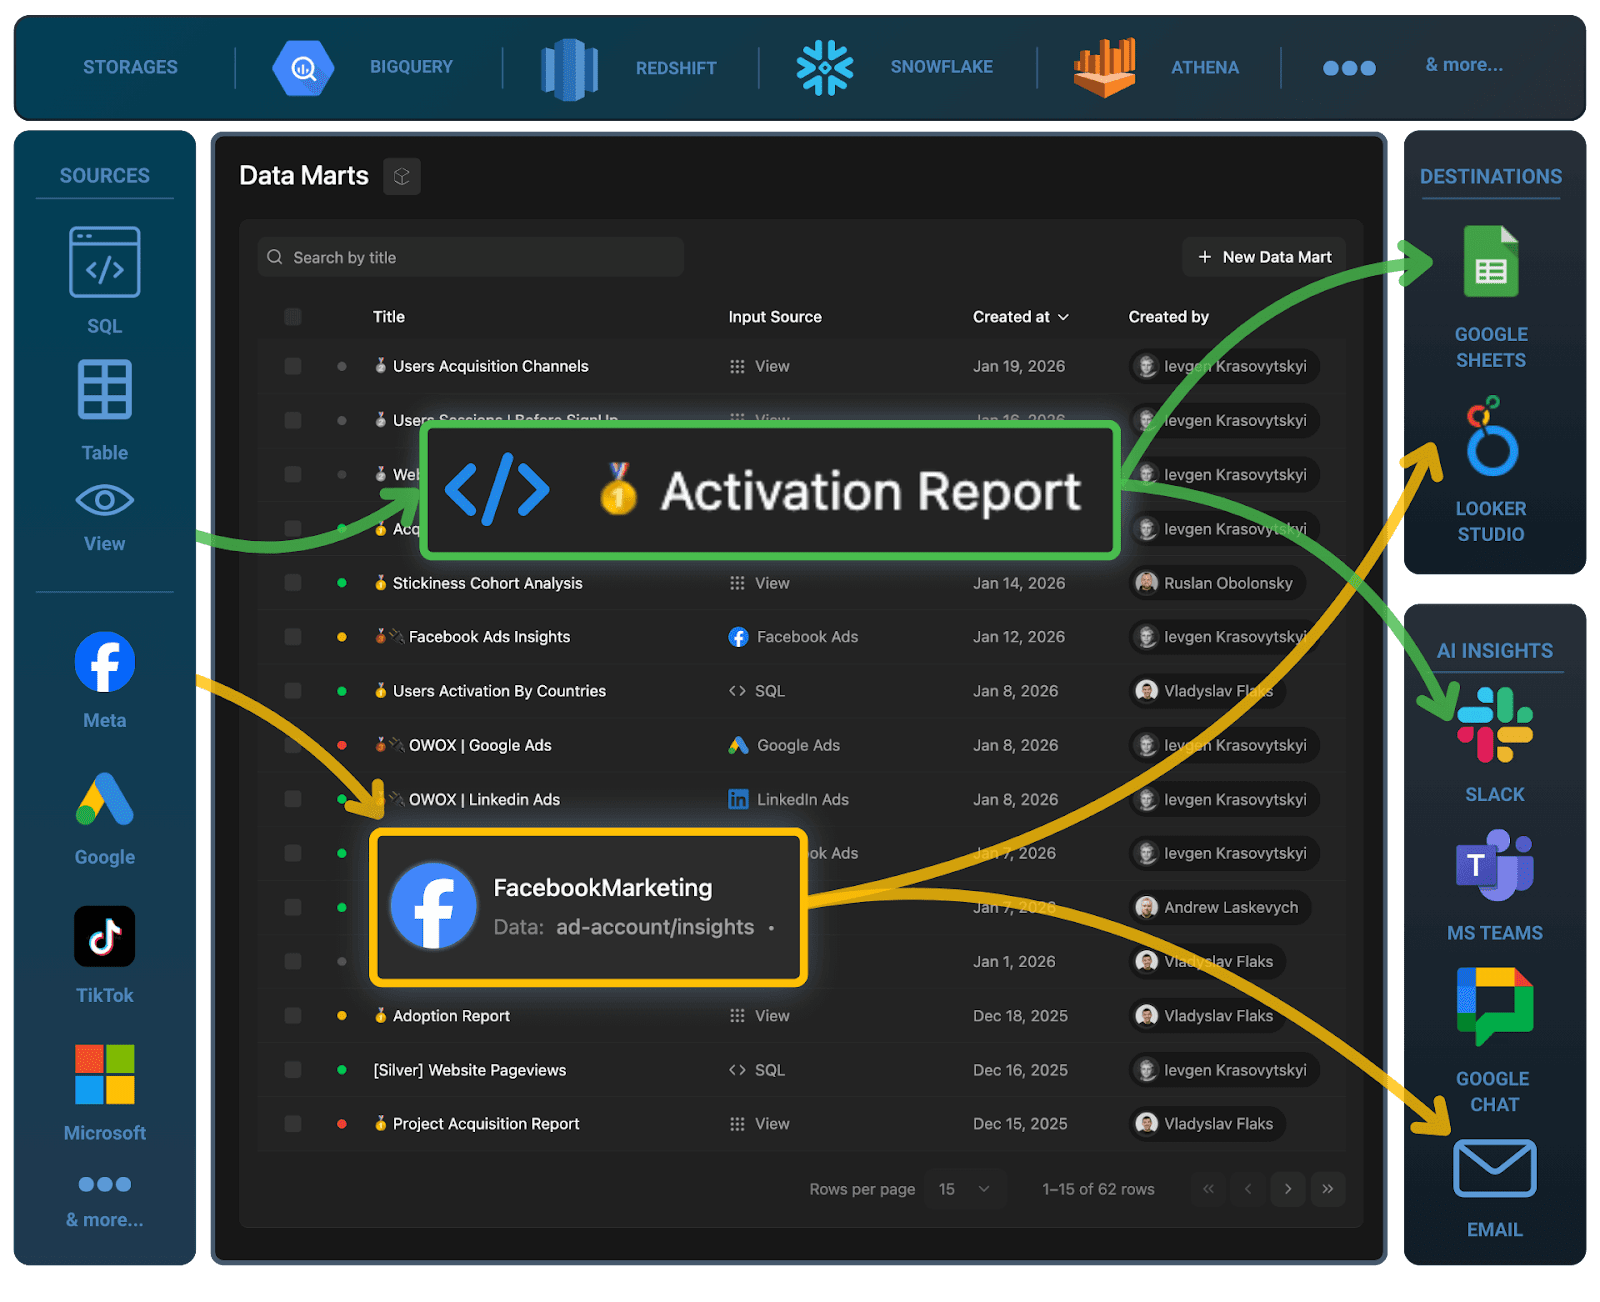
OWOX Data Marts is designed to bridge that gap. It turns your Snowflake environment into a self-service analytics hub where:
- Metrics are reusable and consistent across teams,
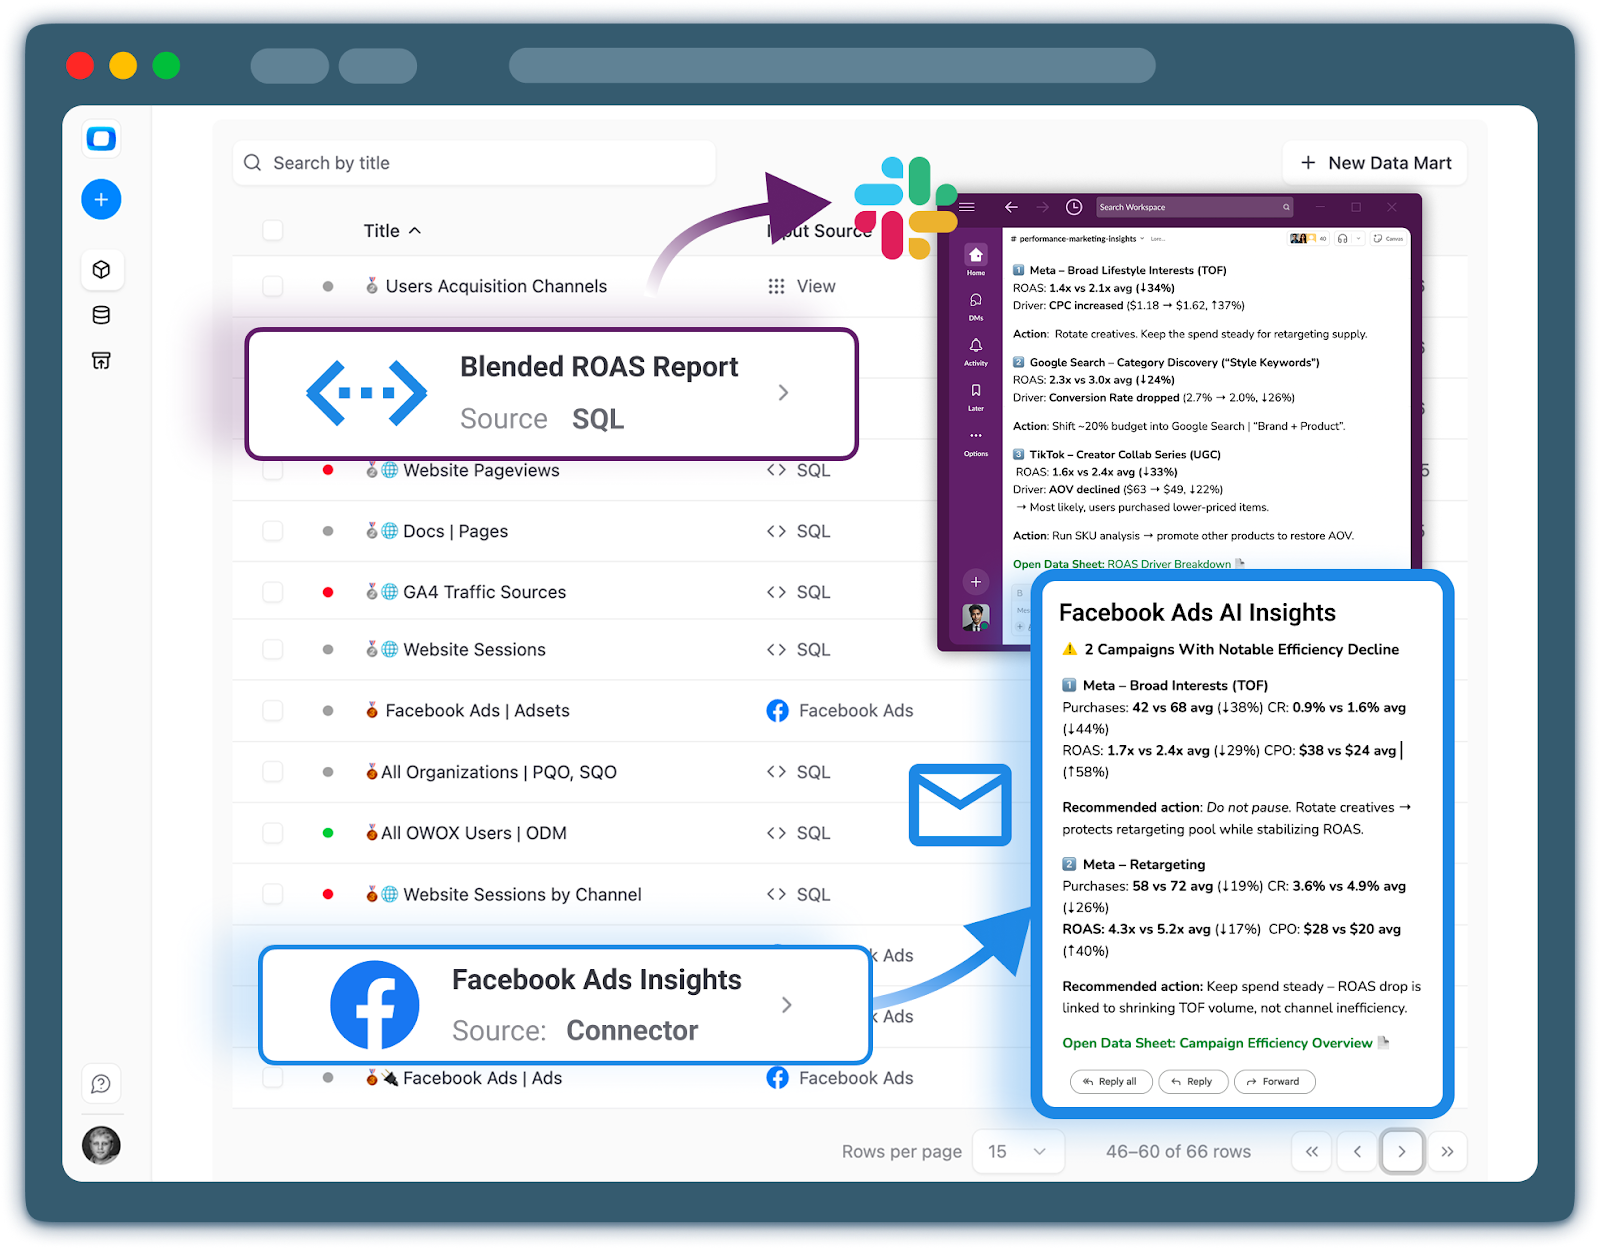
- Reports and AI-generated insights arrive where people already work (Slack, Teams, email, Sheets),
- And you can start small with one use case, then scale as your needs grow.
Defining Reusable Business-Ready Data Marts In Snowflake
Instead of every team reinventing its own logic in SQL or spreadsheets, OWOX helps you define standard, business-ready data marts directly in Snowflake.
In practice, that means:
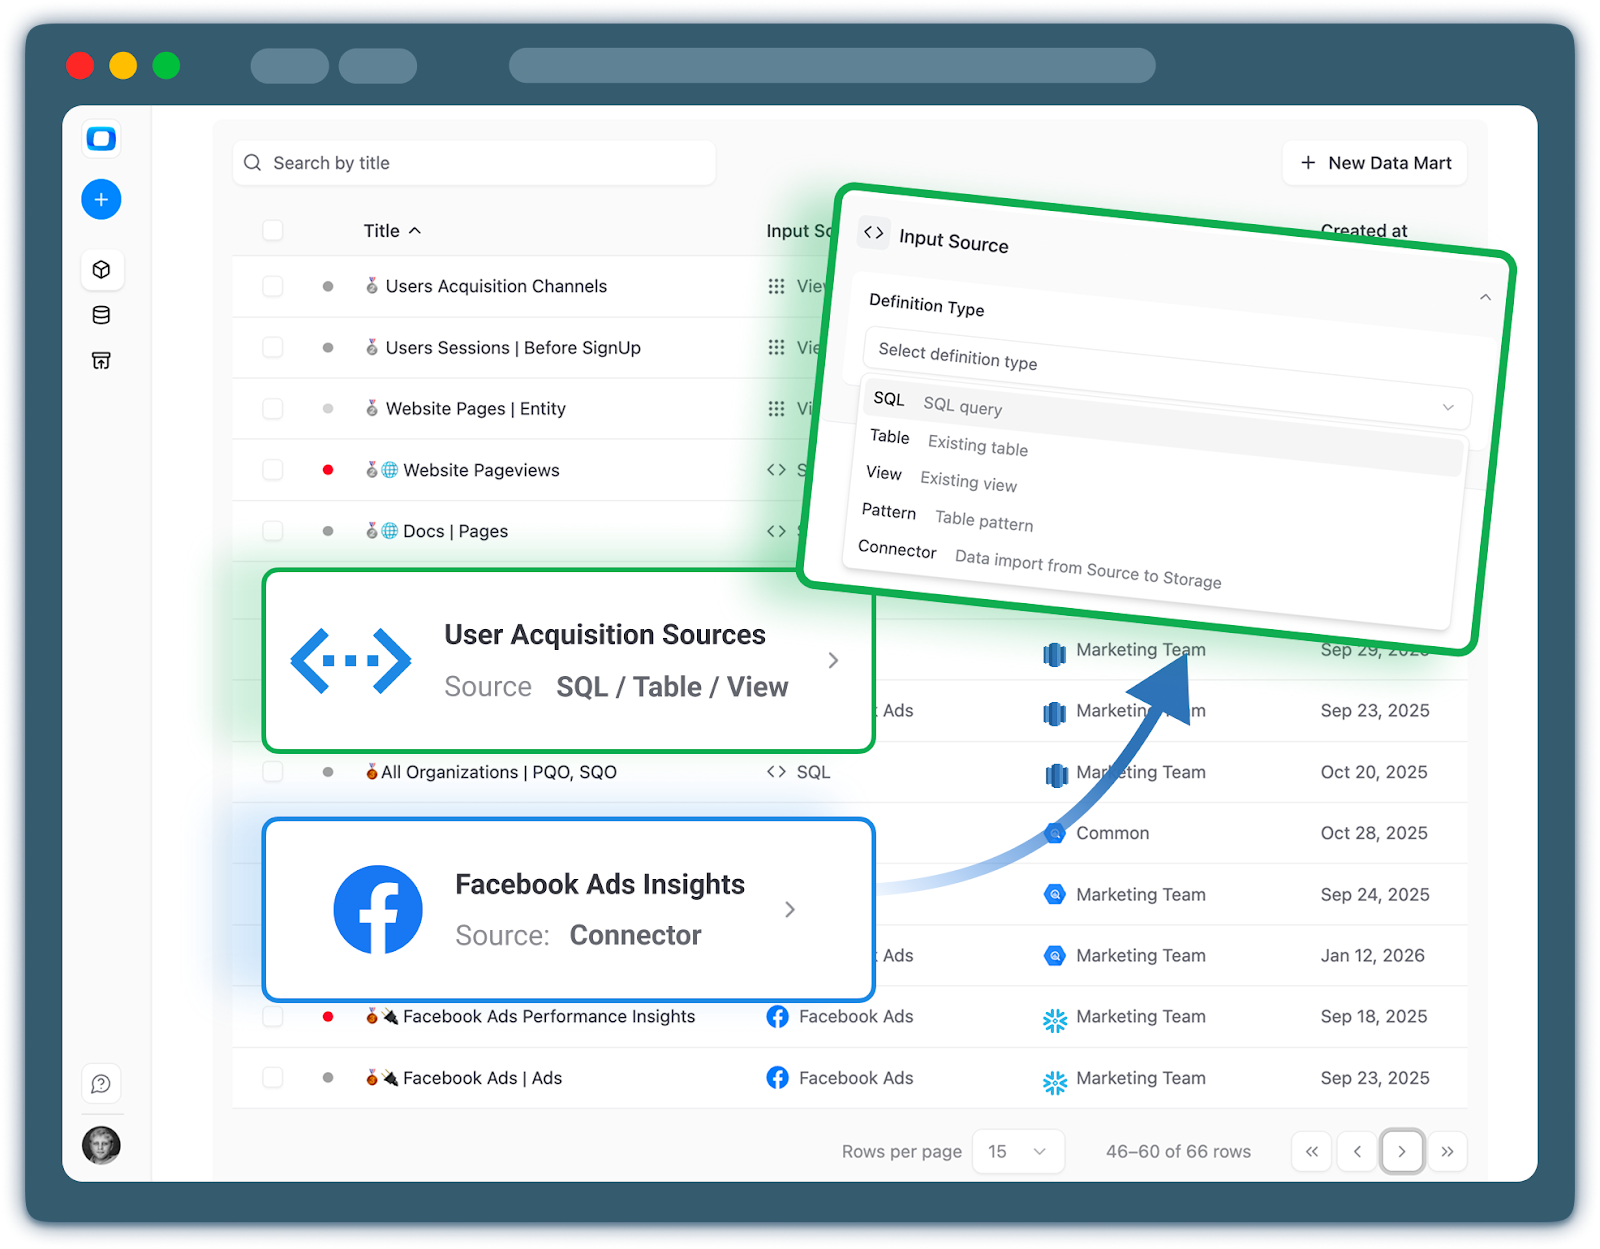
Pre-built SQLs for common analytics scenarios
- Marketing performance by channel, campaign, and audience.
- Funnels, cohorts, and product usage metrics.
- Revenue, LTV, and retention by segment.
Clear separation between raw and business-ready data
- Raw tables from GA4, ad platforms, CRM, and product events stay in their own schemas.
- OWOX creates curated data marts with:
- Cleaned, joined data,
- Standardized dimensions (date, channel, source, campaign, country, segment),
- Business logic already baked in.
Governed, reusable metrics
- Definitions like “session”, “conversion”, “active user”, “qualified lead”, or “marketing-influenced revenue” are implemented once in the mart.
- Dashboards, ad-hoc analyses, and AI insights all use the same trusted definitions.
For marketing, product, and business teams, this means:
- Less time fighting with raw tables or writing complex joins.
- Faster onboarding of new colleagues, who can work with well-named, well-documented tables.
- Consistent KPIs across all reports, regardless of who built them.
You still use Snowflake as the underlying platform – OWOX just makes it much easier to get from “data in Snowflake” to “decision-ready metrics.”
Delivering Reports And AI Insights To Slack, Teams, Email, And Sheets
Even the best data mart is useless if insights stay hidden in the warehouse. OWOX focuses heavily on delivering those insights to the tools and channels your teams use every day.
Some practical examples:
Slack or Microsoft Teams alerts
- Daily or weekly summaries in your team channels:
- “Yesterday’s revenue vs target, by channel.”
- “Top campaigns by ROAS this week.”
- “New user signups and key funnel conversion rates.”
- AI can highlight anomalies (e.g., “Meta CPM spiked 40% yesterday compared to the 7-day average”) and suggest where to look next.
Email reports for stakeholders
- Scheduled digests to leadership and non-technical teams:
- Executive overviews,
- Experiment readouts,
- Country or product performance snapshots.
- Links back to dashboards or Snowflake-powered reports for deeper exploration.
Google Sheets for flexible analysis
- Many teams still love Sheets for quick what-if scenarios or lightweight modeling.
- OWOX can sync curated metrics from Snowflake into Sheets:
- Keeping numbers live and consistent,
- Avoiding manual CSV exports,
- While still leveraging all the governance in Snowflake.
On-demand AI summaries and explanations
- Ask questions like:
- “Which channel had the largest impact on trial signups last week?”
- “Where did we see unusual churn in the last month?”
- Get responses grounded in Snowflake data and OWOX marts, not in guesswork.
The result: instead of hunting for dashboards or loading heavy BI tools, your teams receive insights where they already collaborate, in a format that’s easy to act on.
Next Steps: Start With A Simple Snowflake Use Case And Grow From There
You don’t need a massive data program to start. The most successful Snowflake + OWOX rollouts usually follow a simple pattern:
Pick one high-impact, narrow use case
Examples:
- Cross-channel marketing performance and ROAS,
- Product activation and early retention funnels,
- Revenue and subscription metrics by cohort.
Use OWOX Data Marts on top of Snowflake
- Use SQL-based data marts tailored to your chosen use case.
- Validate metrics with stakeholders and align on definitions.
Connect additional data sources to Snowflake using OWOX Data Marts
- Web/app analytics, Ad platforms, CRM, billing, or product events.
- Keep the initial scope tight to move quickly.
Distribute insights where your teams live
- Set up Slack/Teams alerts, email digests
- Enable record-level data in Google Sheets on a schedule.
- Replace manual spreadsheets and scattered exports with one governed pipeline.
Iterate and expand
- Once one team sees value (e.g., marketing or product), extend to new use cases and departments.
- Reuse the same Snowflake foundation and governance, adding new marts as needed.
If you already have Snowflake – or are planning to adopt it – you can pilot OWOX Data Marts with a small, well-defined analytics problem and see results in weeks, not months.
Start your trial and see how OWOX Data Marts can turn Snowflake into a truly self-service analytics hub for your organization.
Frequently asked questions


Finally, a tool that doesn't ask business users to learn a new dashboarding UI. Our marketing team already knows Sheets. OWOX just delivers the right data.
Joinable data marts concept was the thing that sold us. We can now use the semantic layer without building one.
Self-hosted the OSS version on Digital Ocean. Zero vendor lock-in. Contributed a Shopify connector back in week two.