Looker Studio dashboards powered by data you can trust

Stop rebuilding logic inside every dashboard. OWOX Data Marts feed Looker Studio with governed, fresh data — so dashboards load fast, numbers stay consistent, and analysts stop firefighting.

Trusted, proven, recognized

The analytics system teams actually use

170K+
Users trust OWOX[1]
Analysts, marketers, and data teams across 20+ industries
4.9★
Rating on G2[2]
“A trusted data analytics partner” — verified review
370K+
Data marts delivered
Created and served by OWOX to business users
132K+
npm installs[3]
Self-managed OWOX Edition from GitHub
BI tool

Looker Studio dashboards powered by data you can trust

Collect raw data into your data warehouse with OWOX connectors, then visualize trusted data marts in Looker Studio.

Connect

What does Looker Studio mean in OWOX Data Marts?

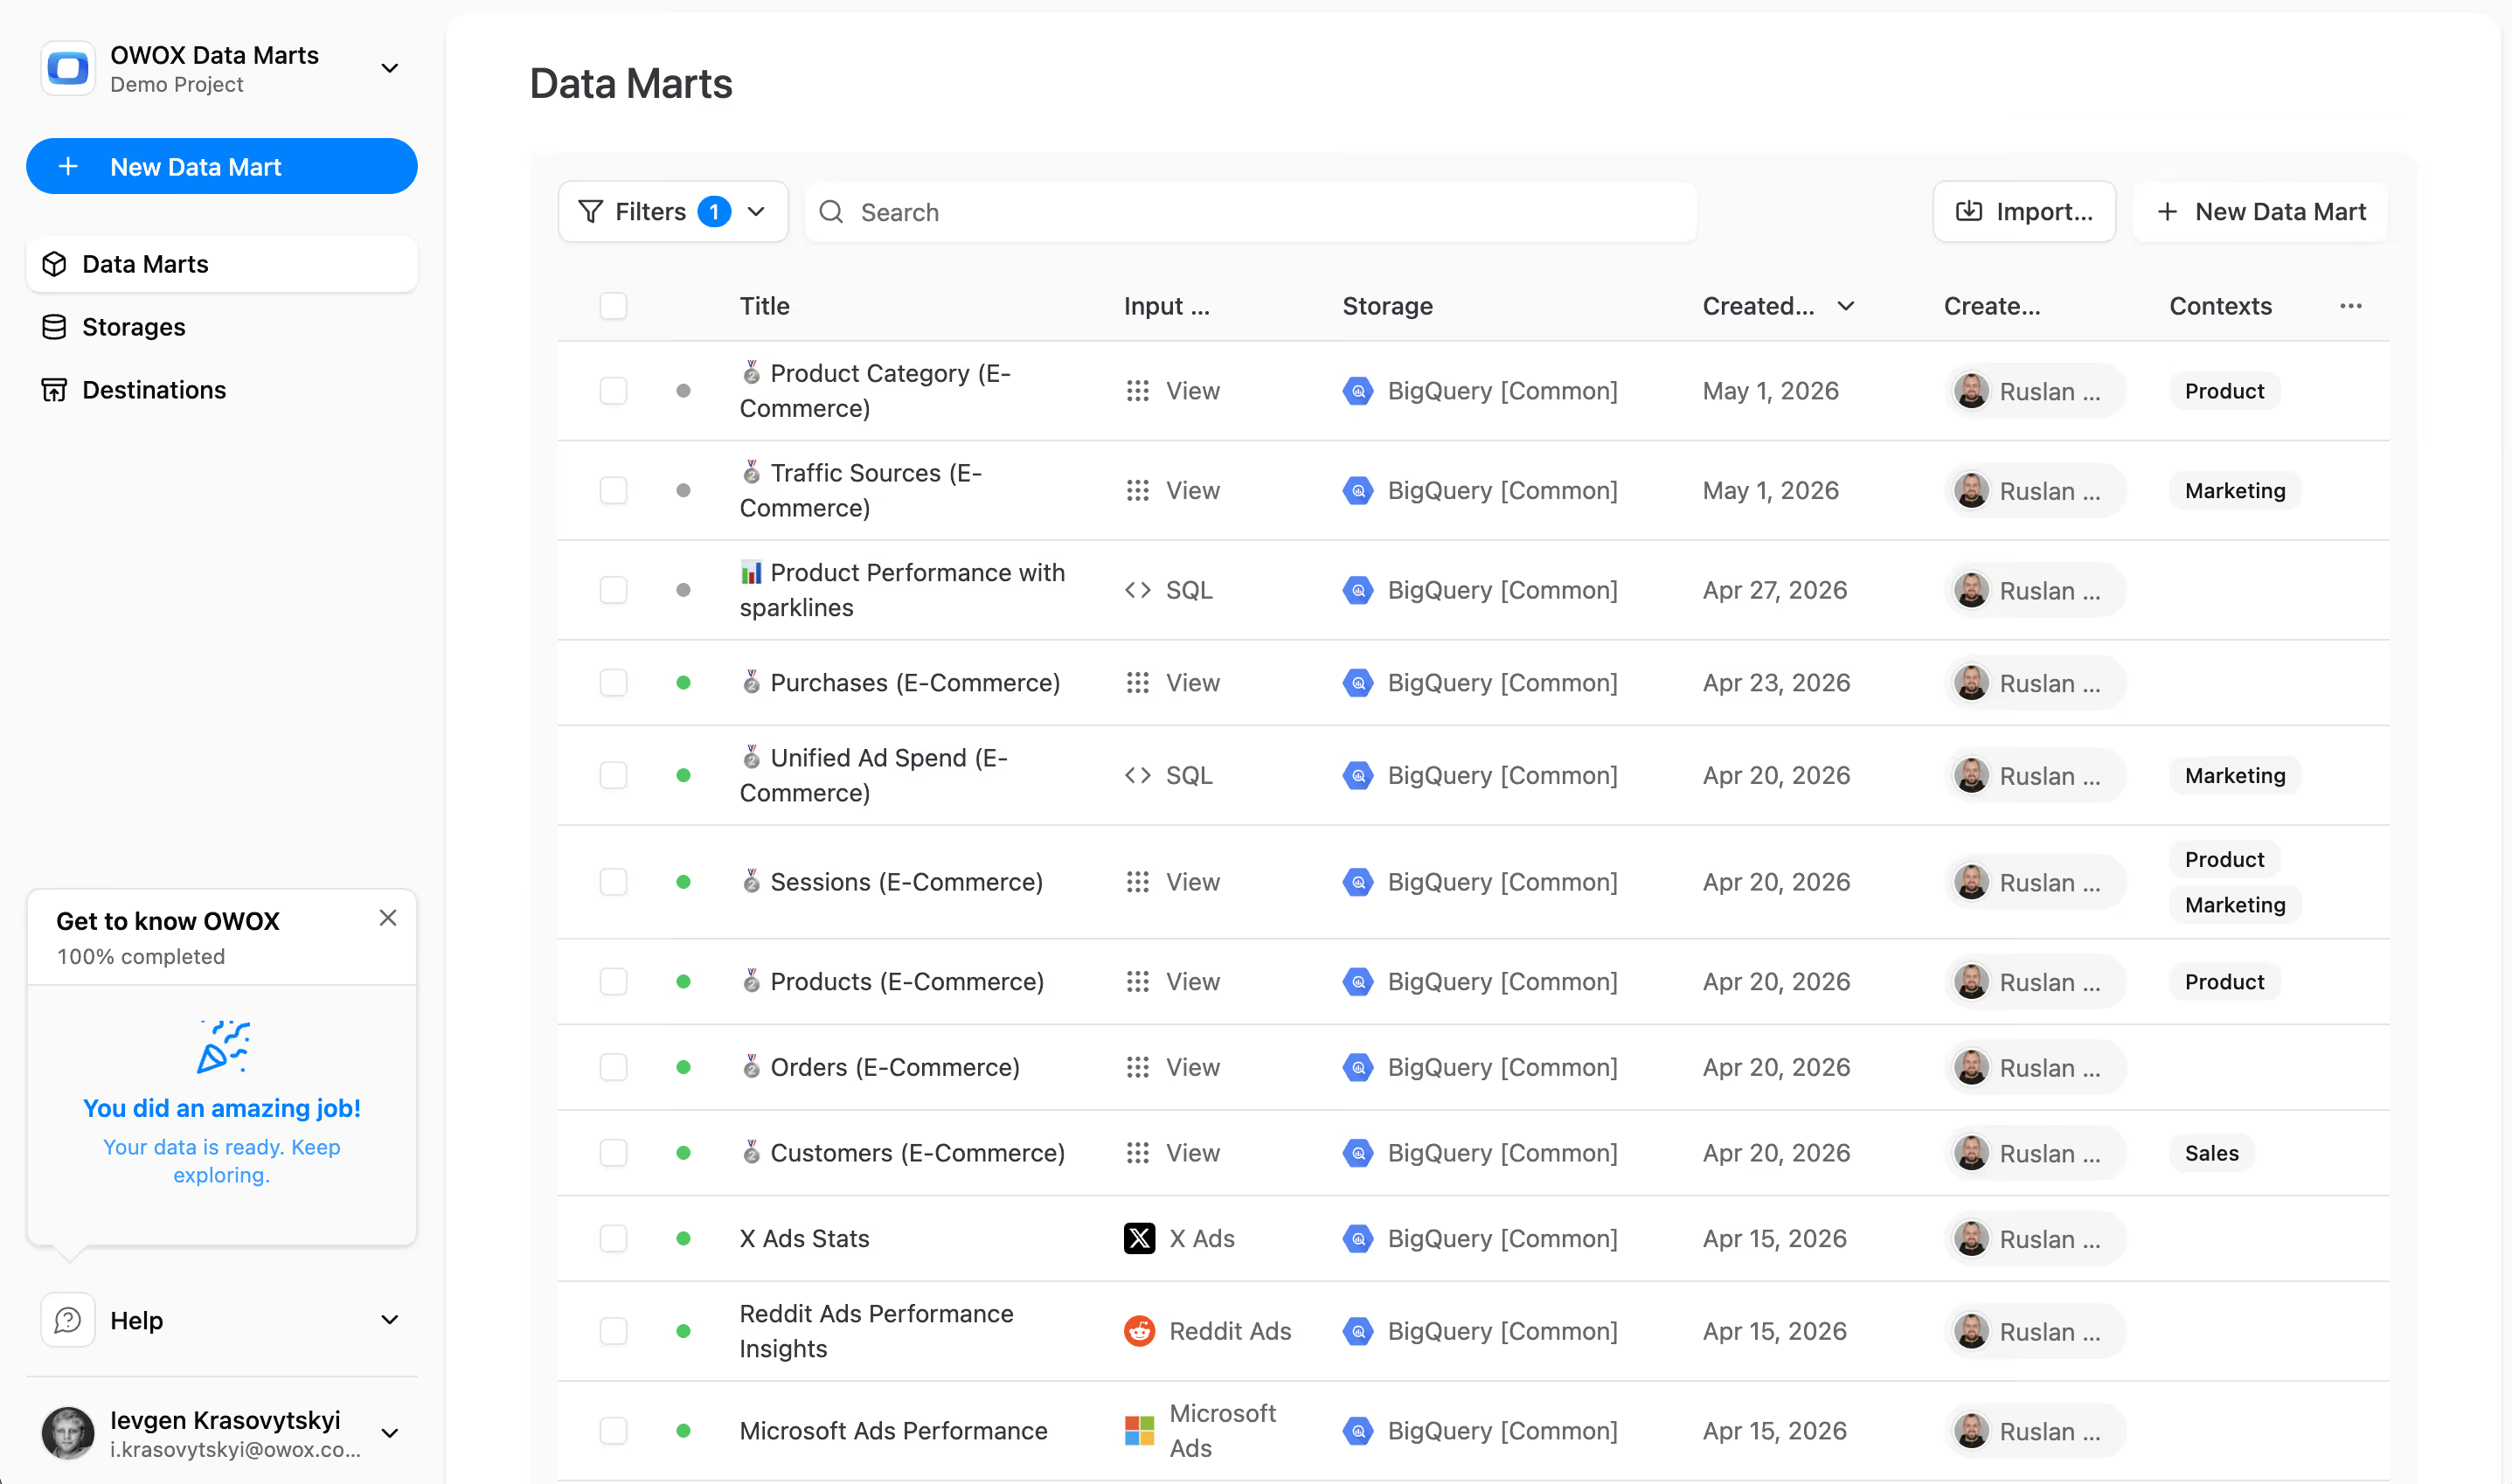
Looker Studio is a visualization layer, not a data layer. When business logic lives inside dashboards — custom fields, blended data, calculated metrics — it breaks at scale. OWOX moves the logic upstream to your data warehouse and feeds Looker Studio with clean, governed data marts.
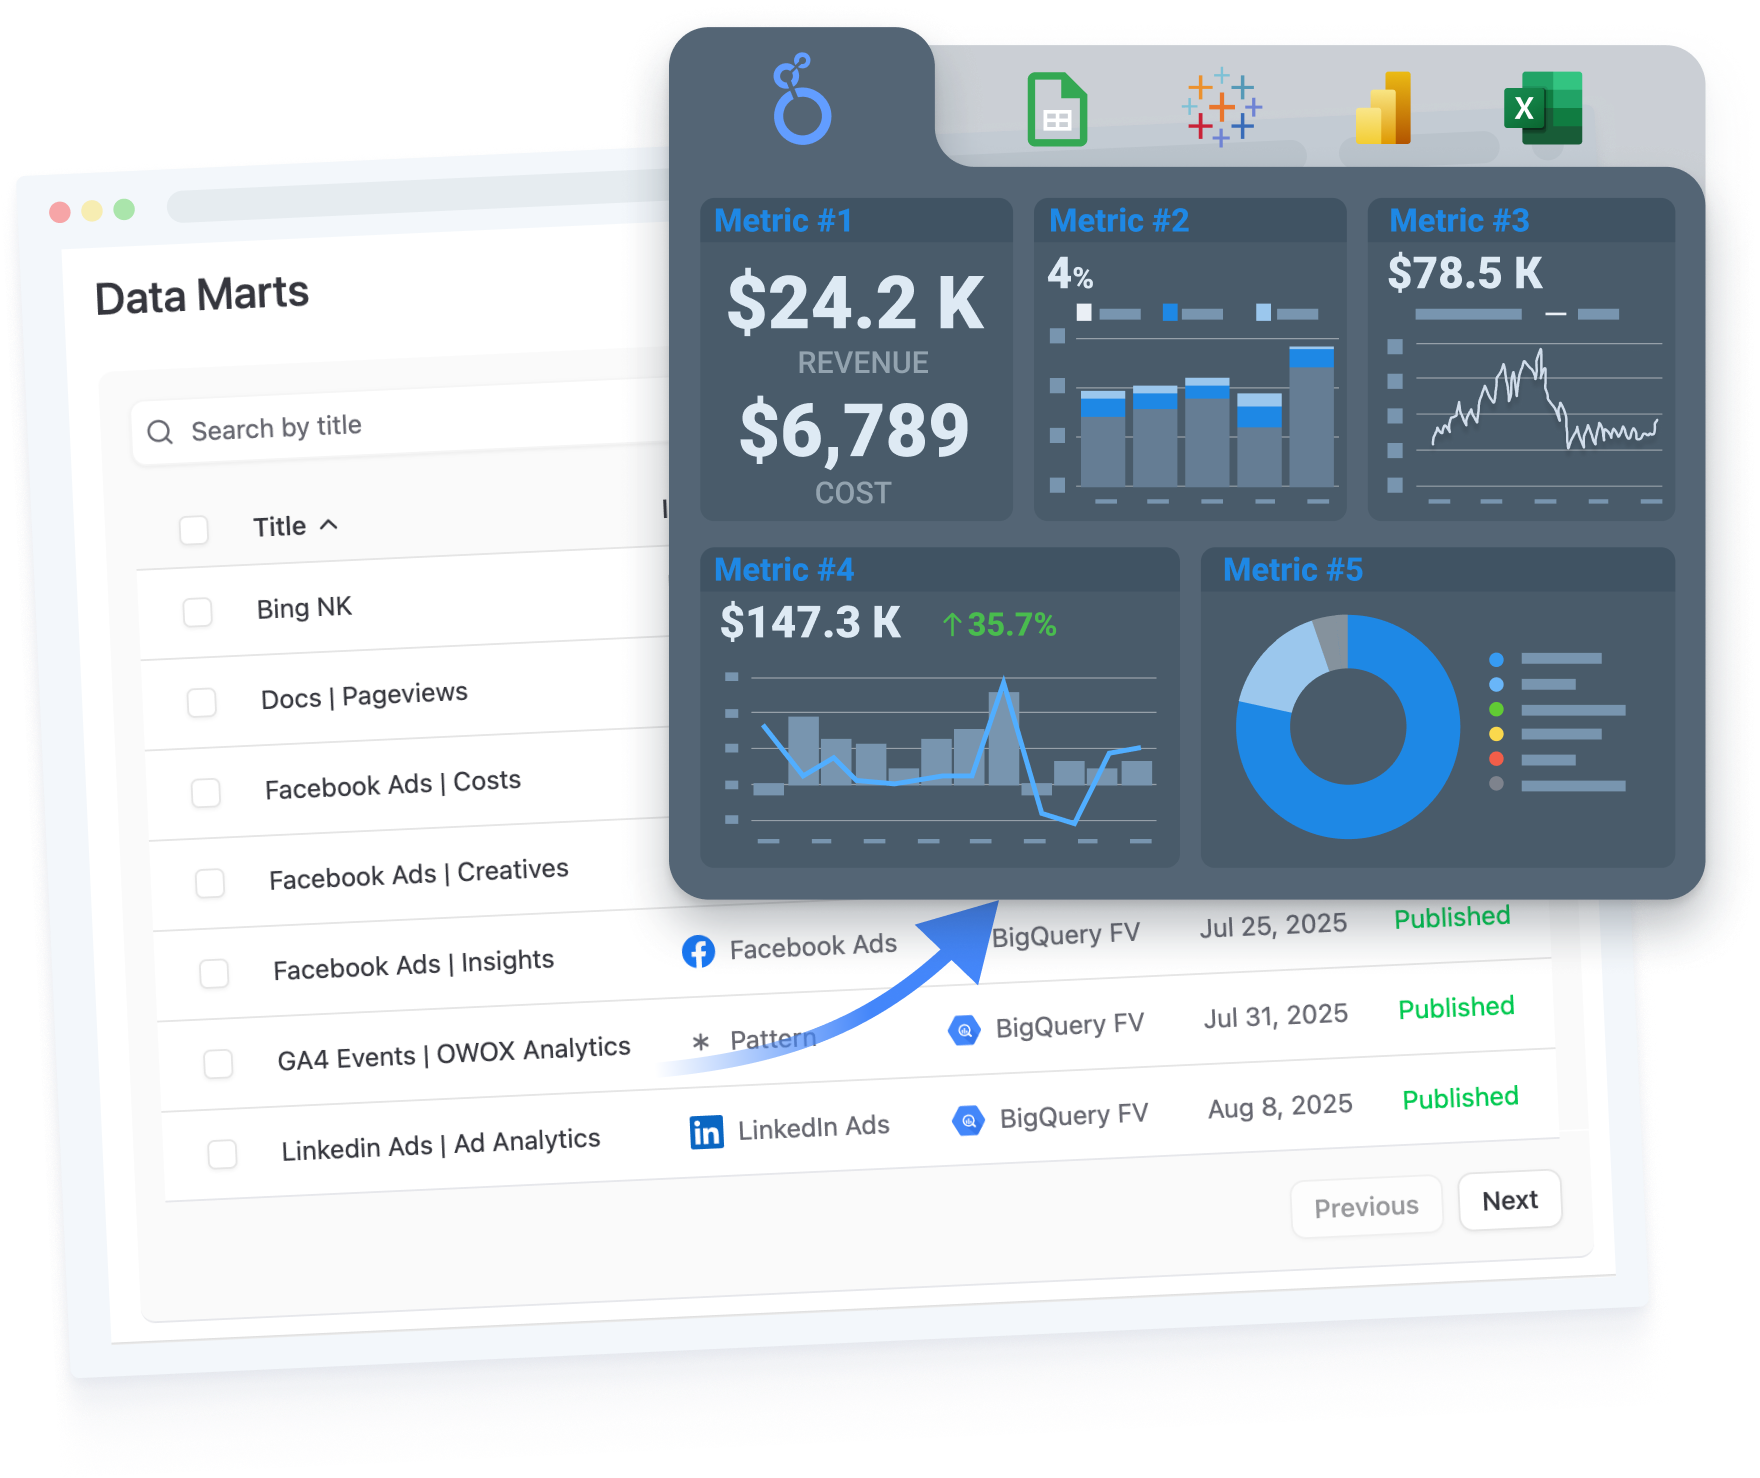
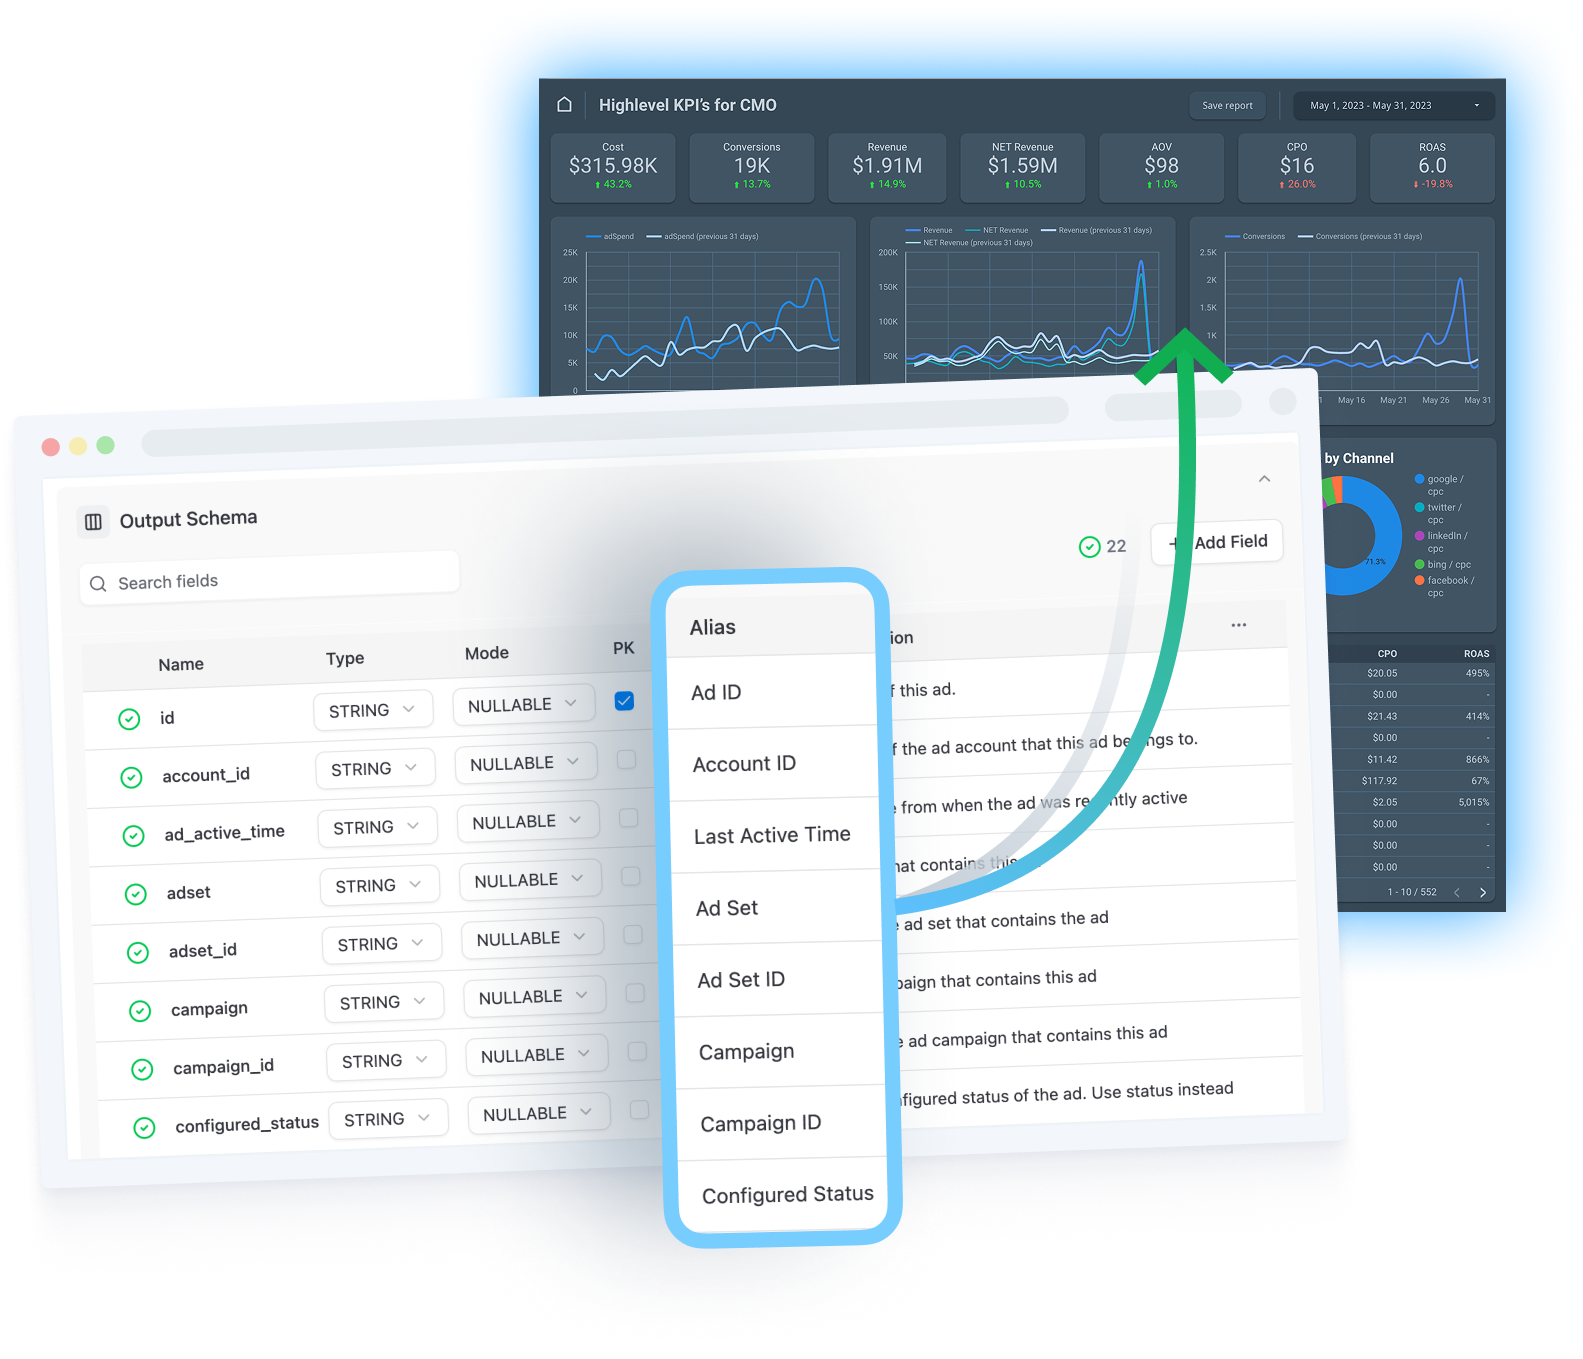
Dashboards consume governed data marts — no custom fields or blended data hacks
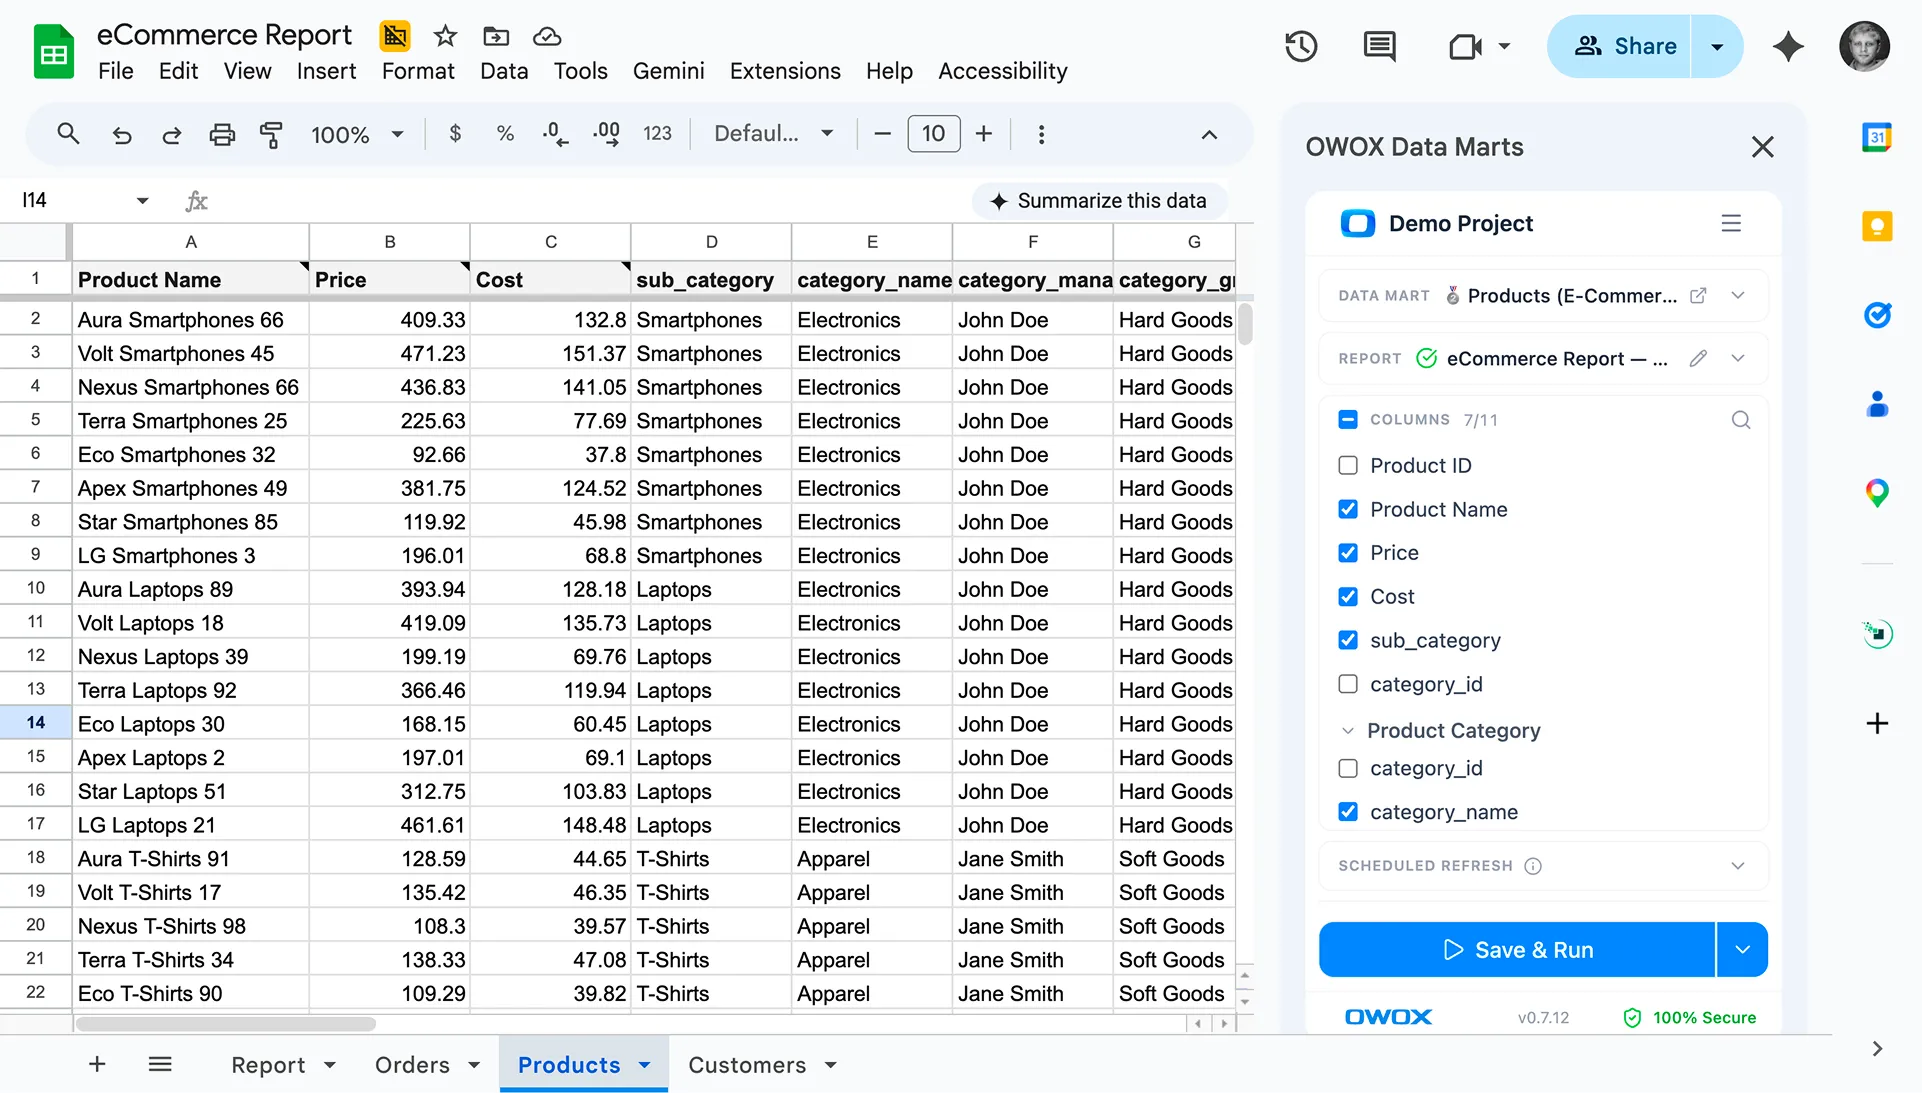
Same data mart powers Looker Studio, Google Sheets, and AI Insights
Update a metric once in your data warehouse — every dashboard reflects it instantly
What does Looker Studio mean in OWOX Data Marts?
Who is Looker Studio with OWOX for?
Scale

Who is Looker Studio with OWOX for?

Teams running multiple Looker Studio dashboards that keep breaking, drifting, or contradicting each other — because the logic lives inside the dashboard instead of the data warehouse.

Data and BI teams managing dozens of dashboards across stakeholders
Marketing and finance teams who need consistent numbers across reports
Organizations standardizing metrics across Looker Studio and Google Sheets
Who is Looker Studio with OWOX for?

Why use OWOX Data Marts with Looker Studio?

Looker Studio is great for exploration, but it was never meant to hold business logic. When every dashboard defines its own metrics, you get drift, debates, and broken reports. OWOX Data Marts move definitions into your data warehouse — so Looker Studio becomes fast, reliable, and easy to maintain.
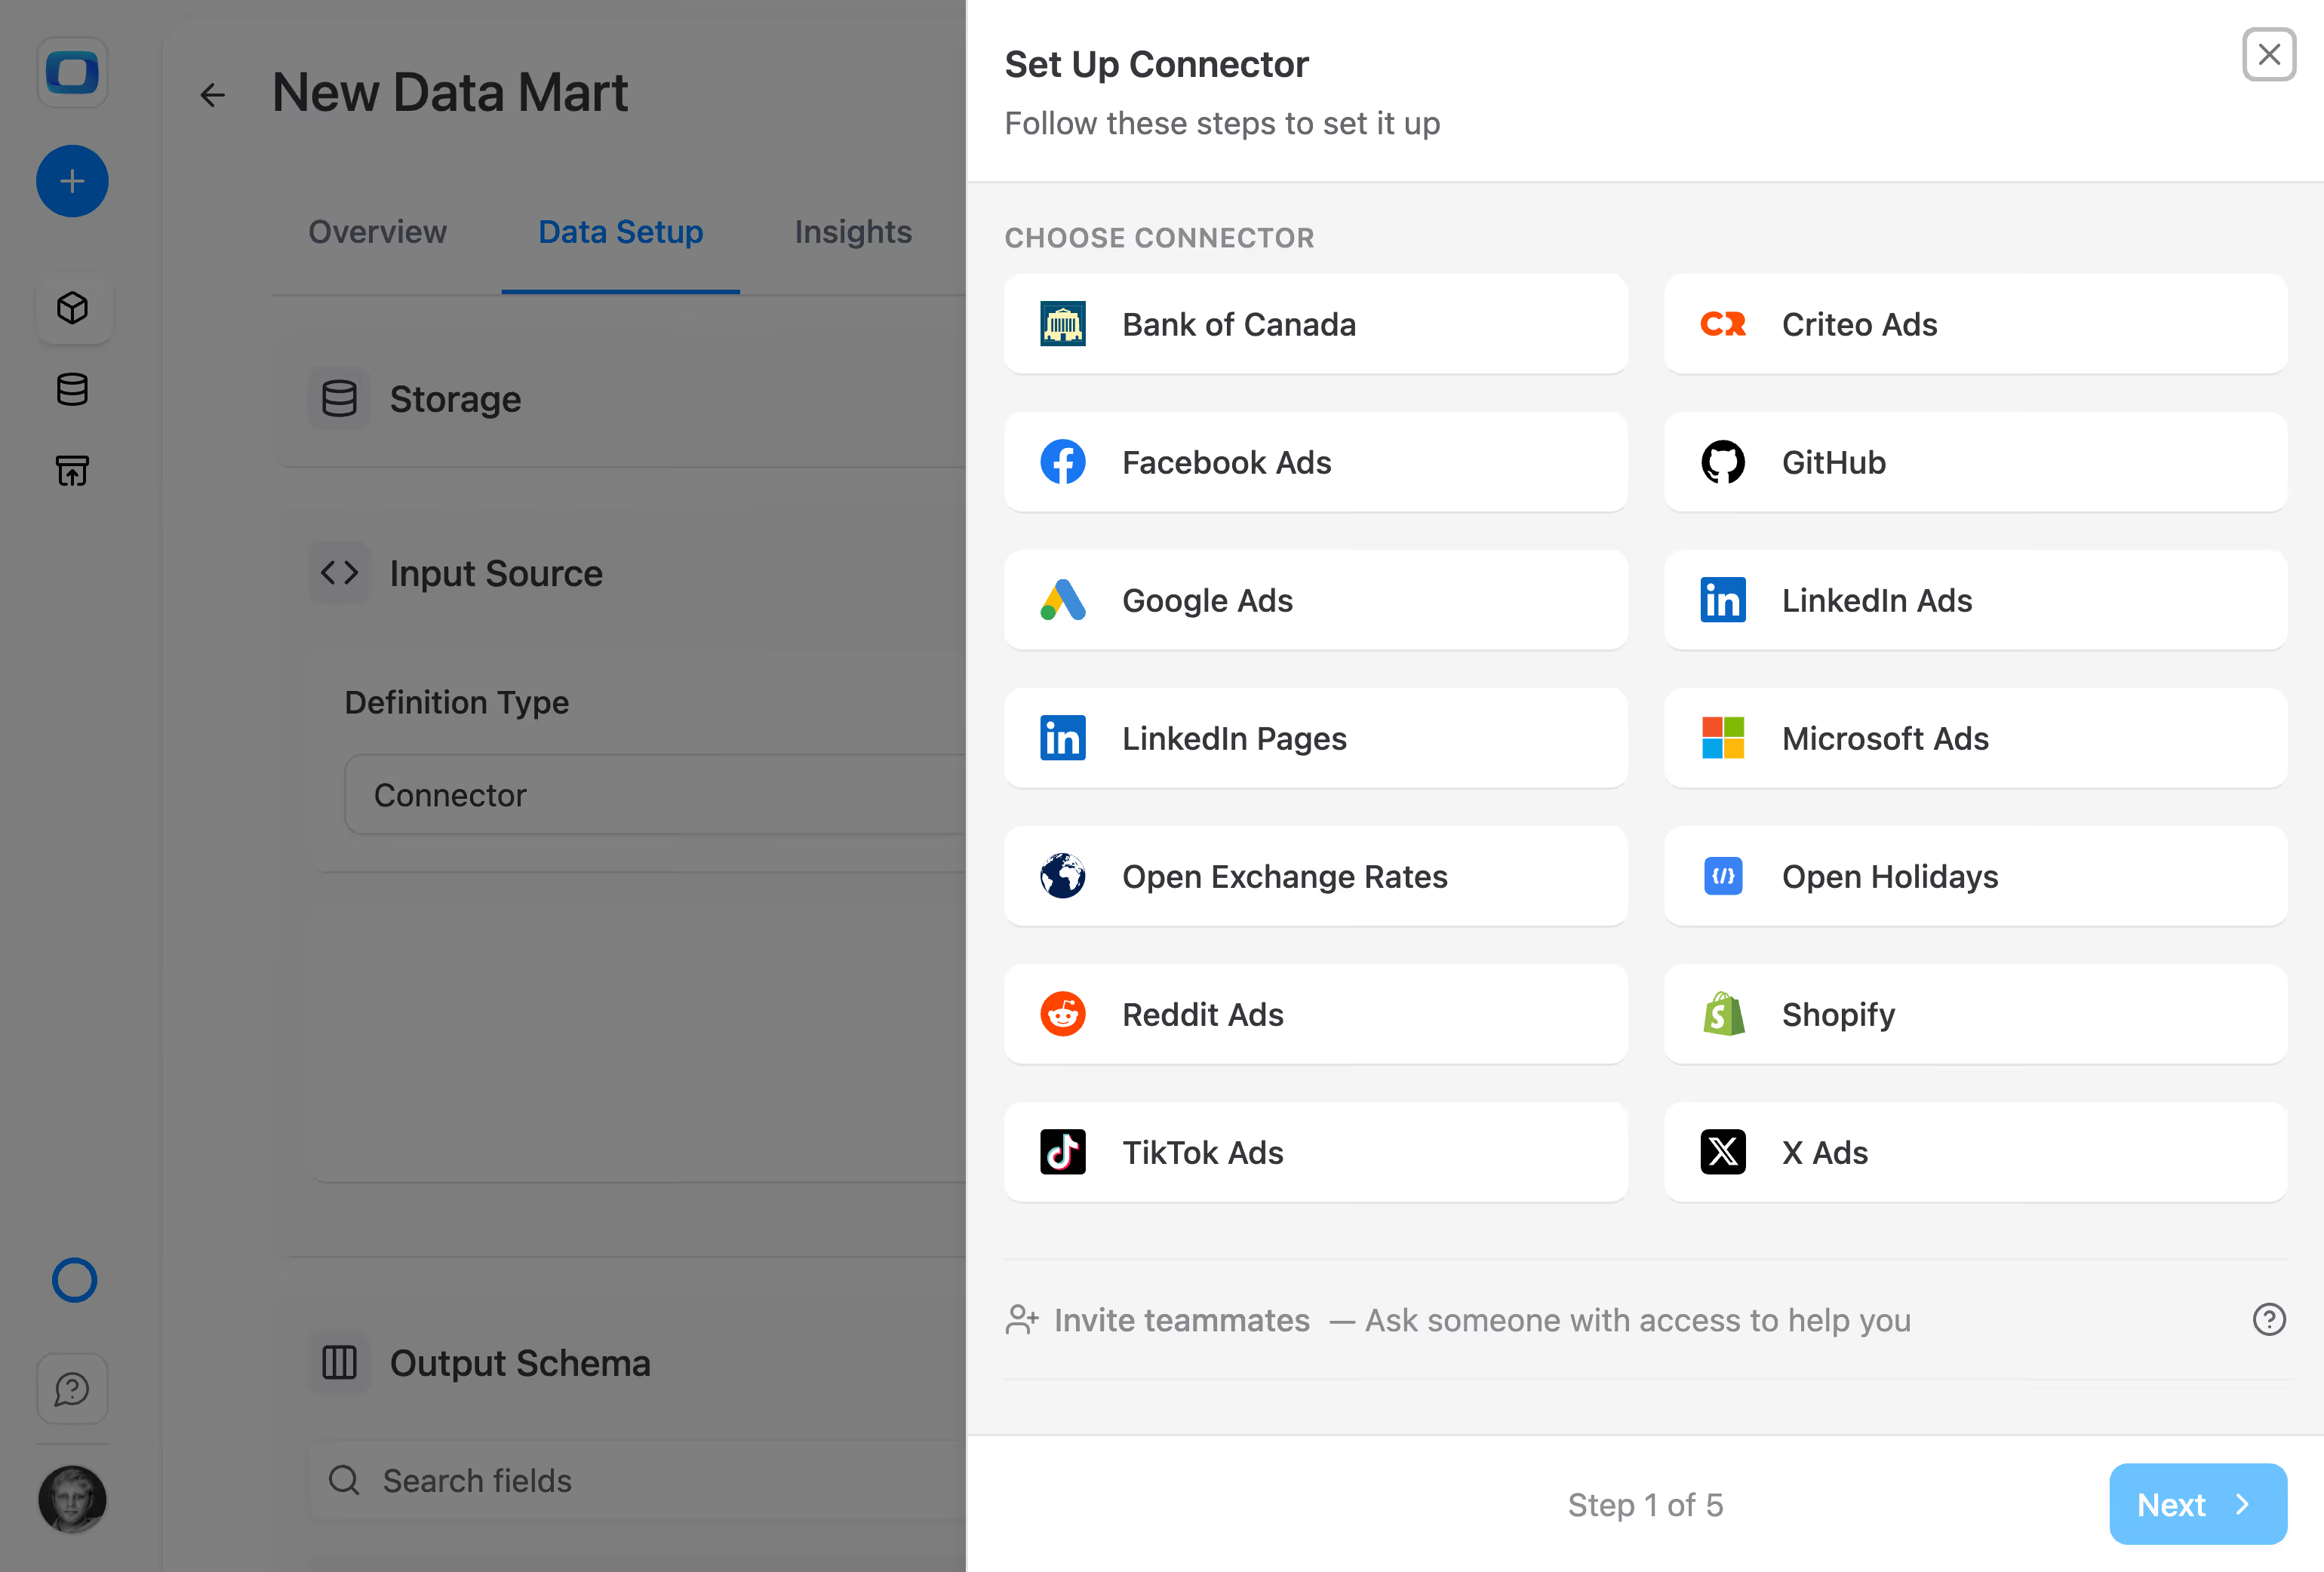
Connect as many sources as you need, all included
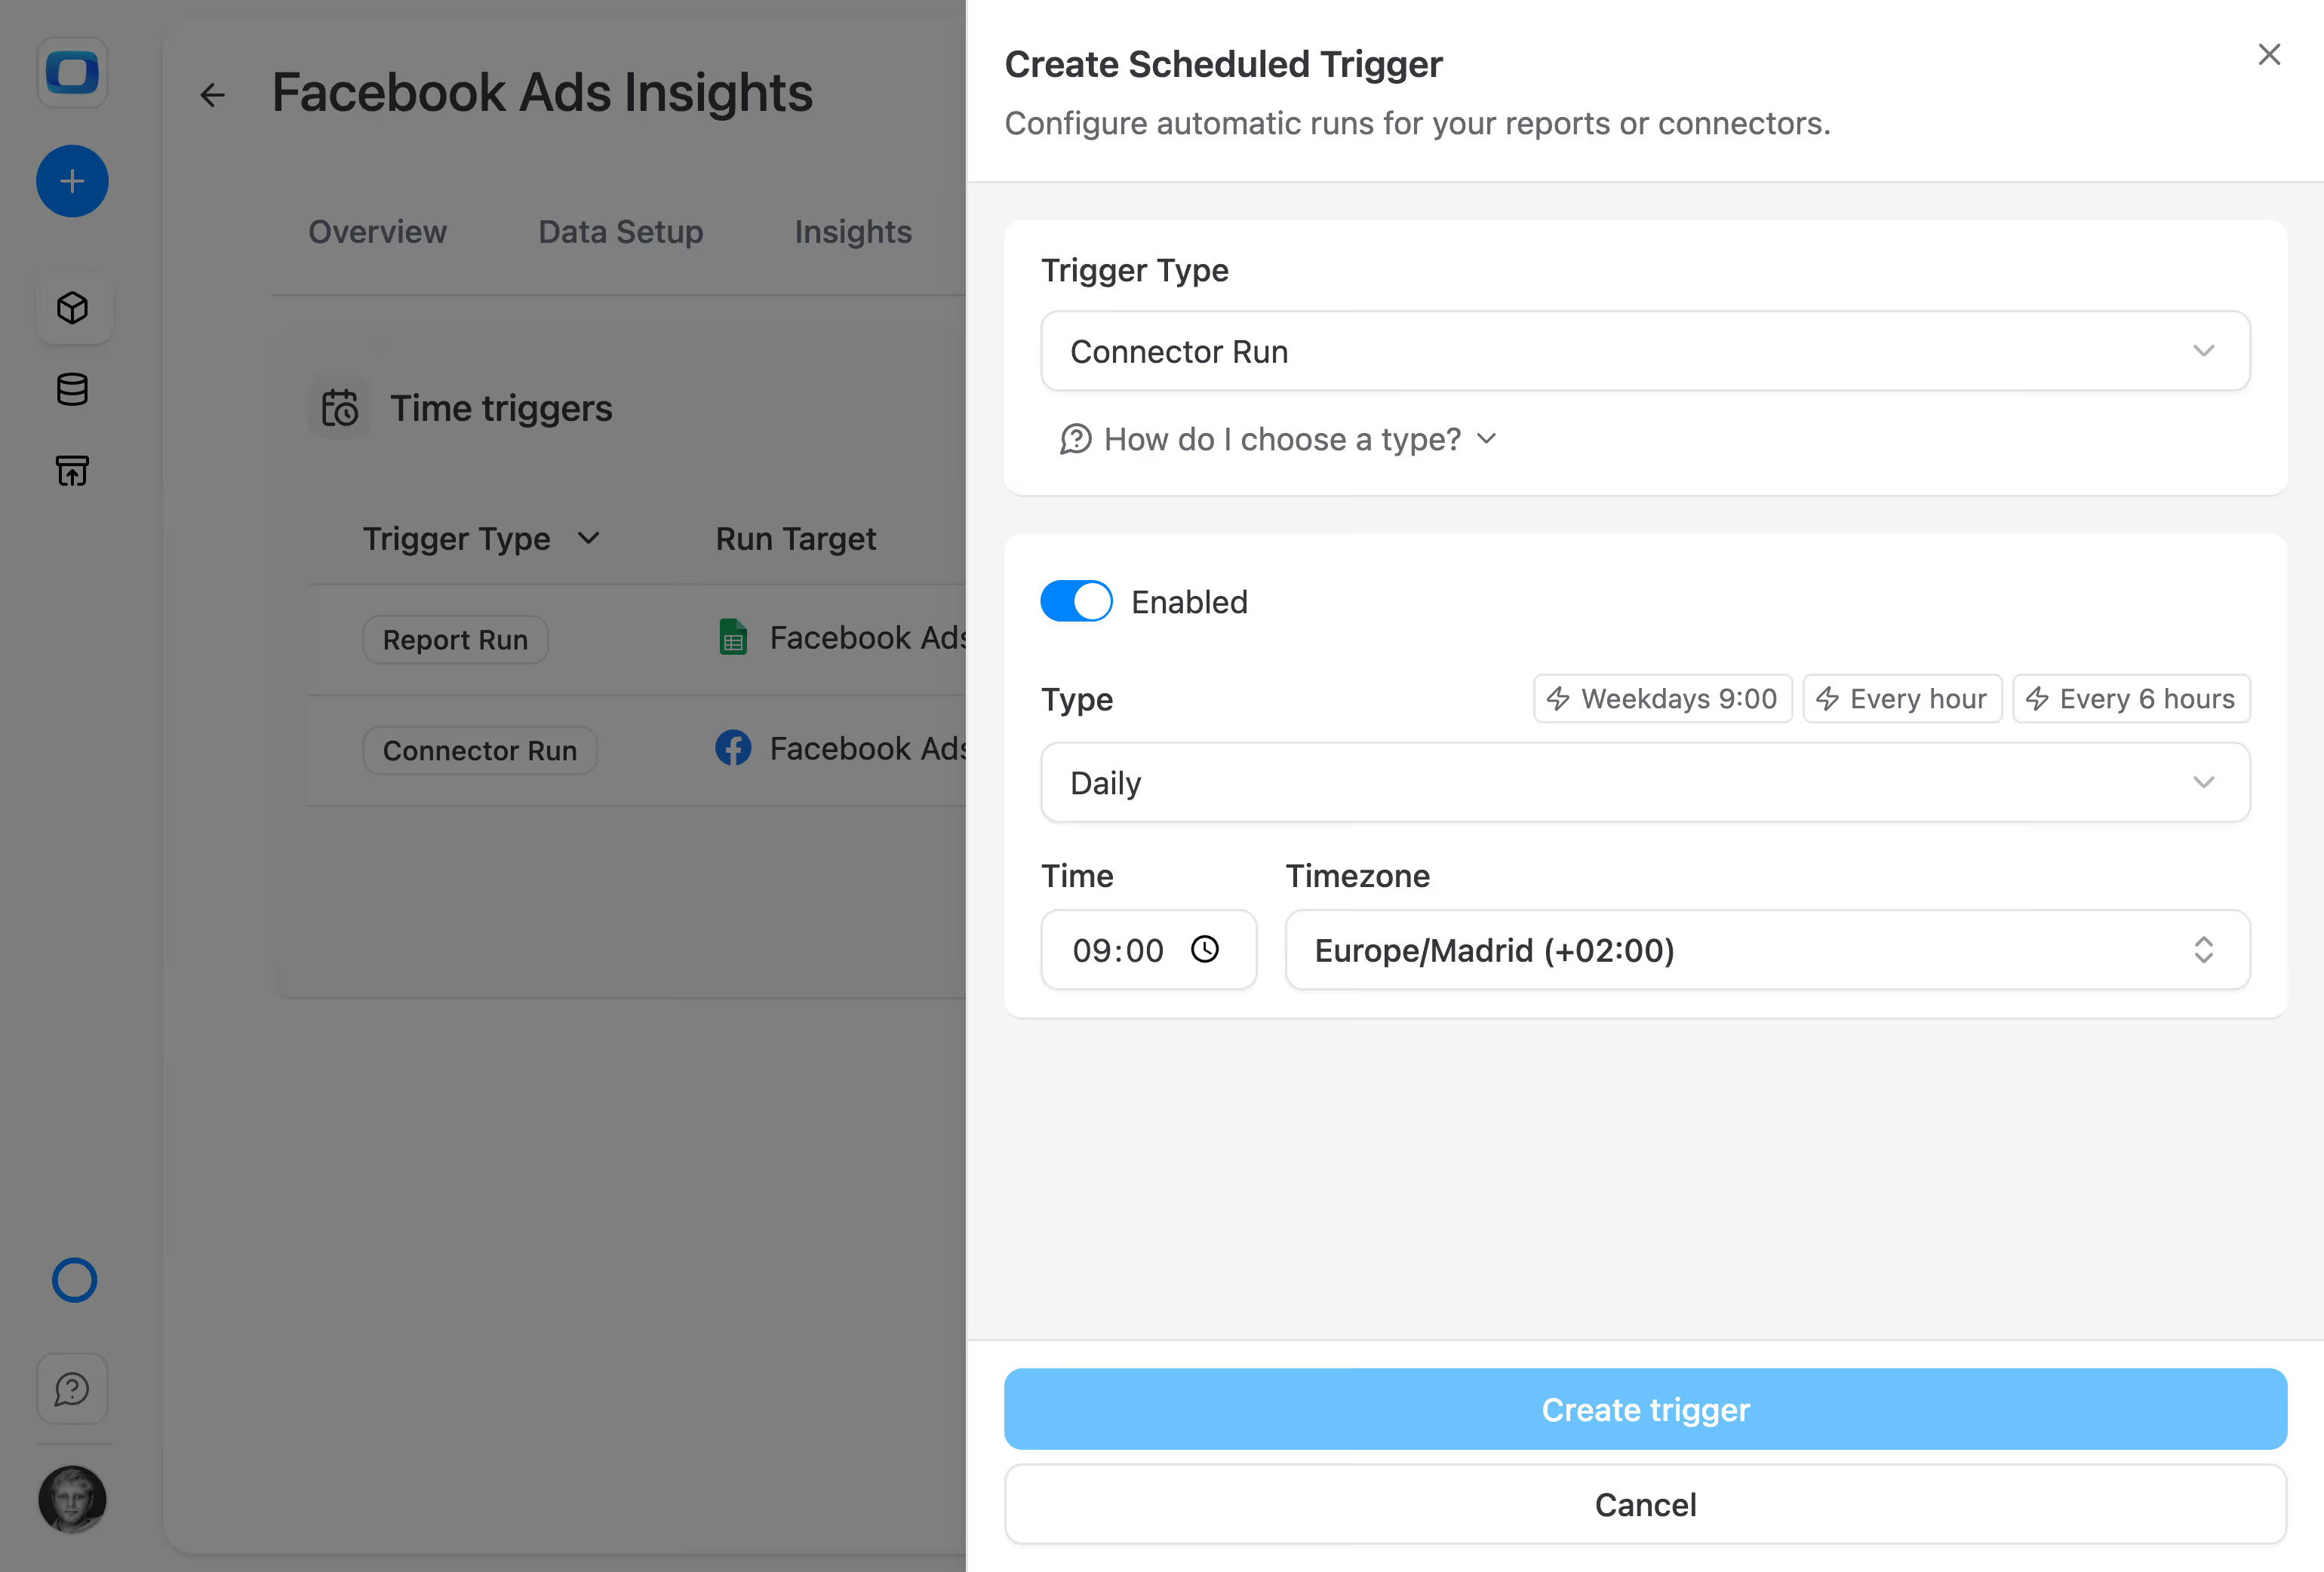
No per-connector pricing

Connect as many sources as you need, all included

Fully available on GitHub — self-host anytime, your data stays yours
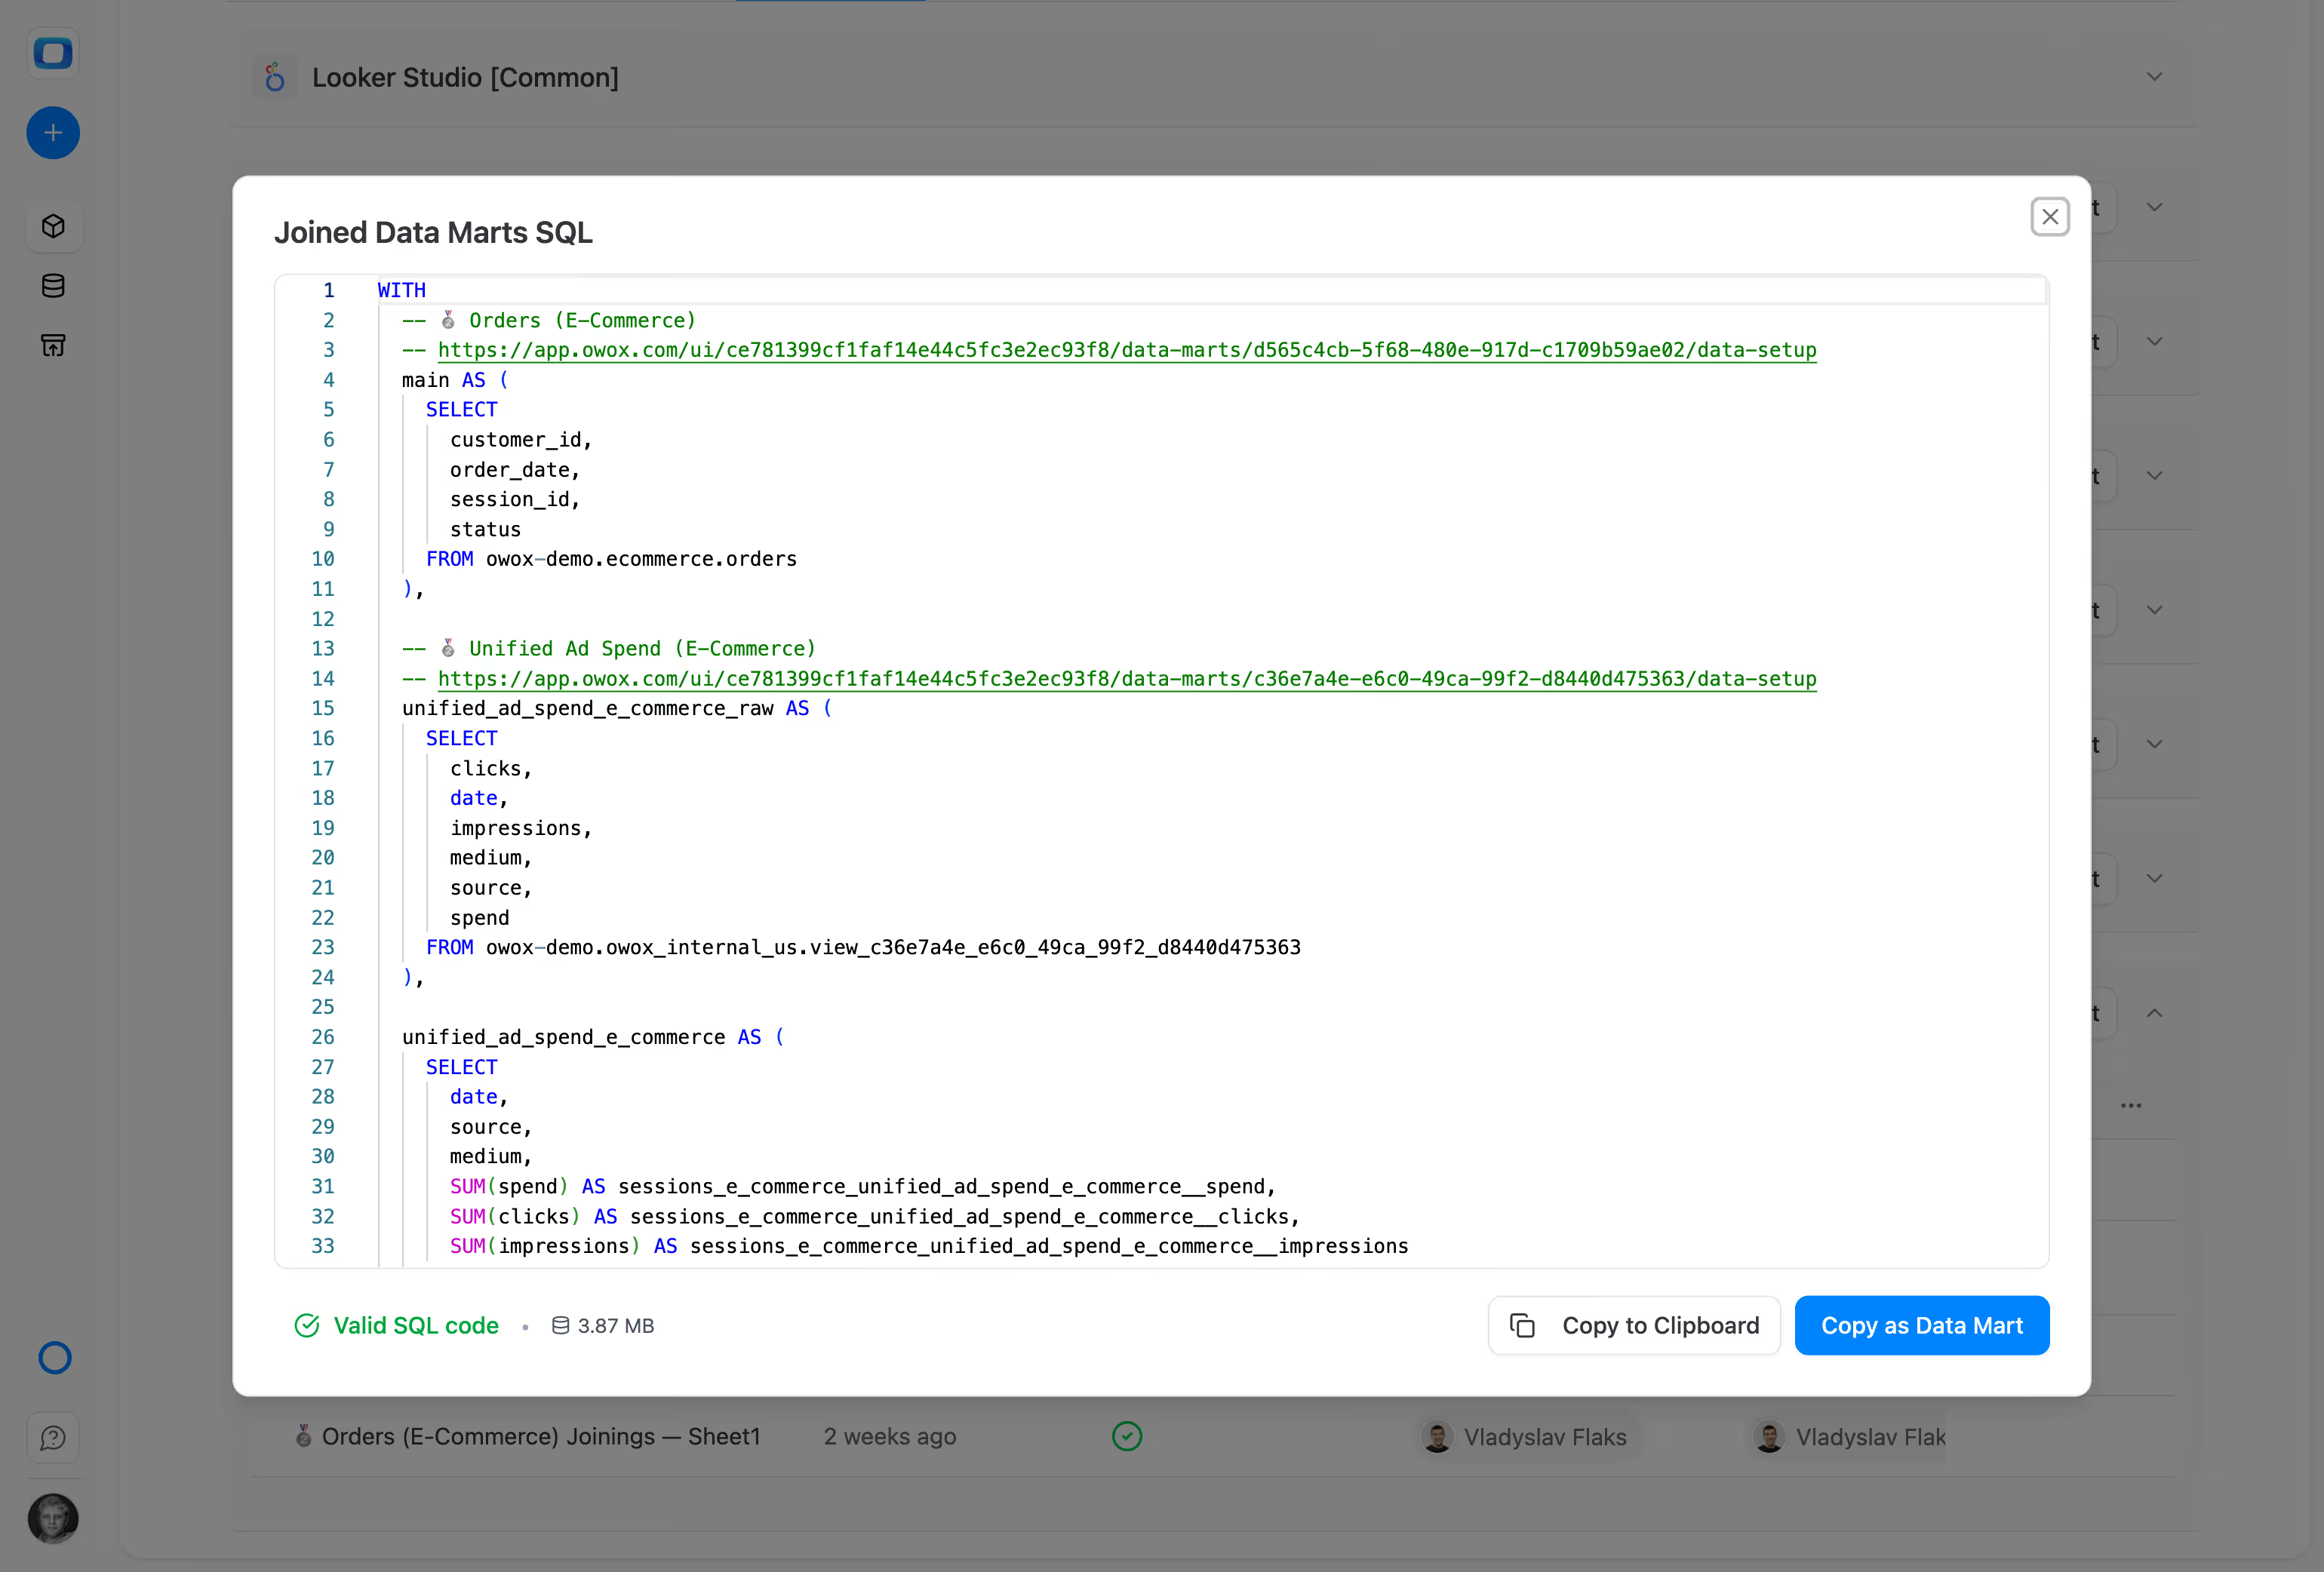
Open-source, no lock-in

Fully available on GitHub — self-host anytime, your data stays yours

Every query, every schema, every schedule is visible and auditable
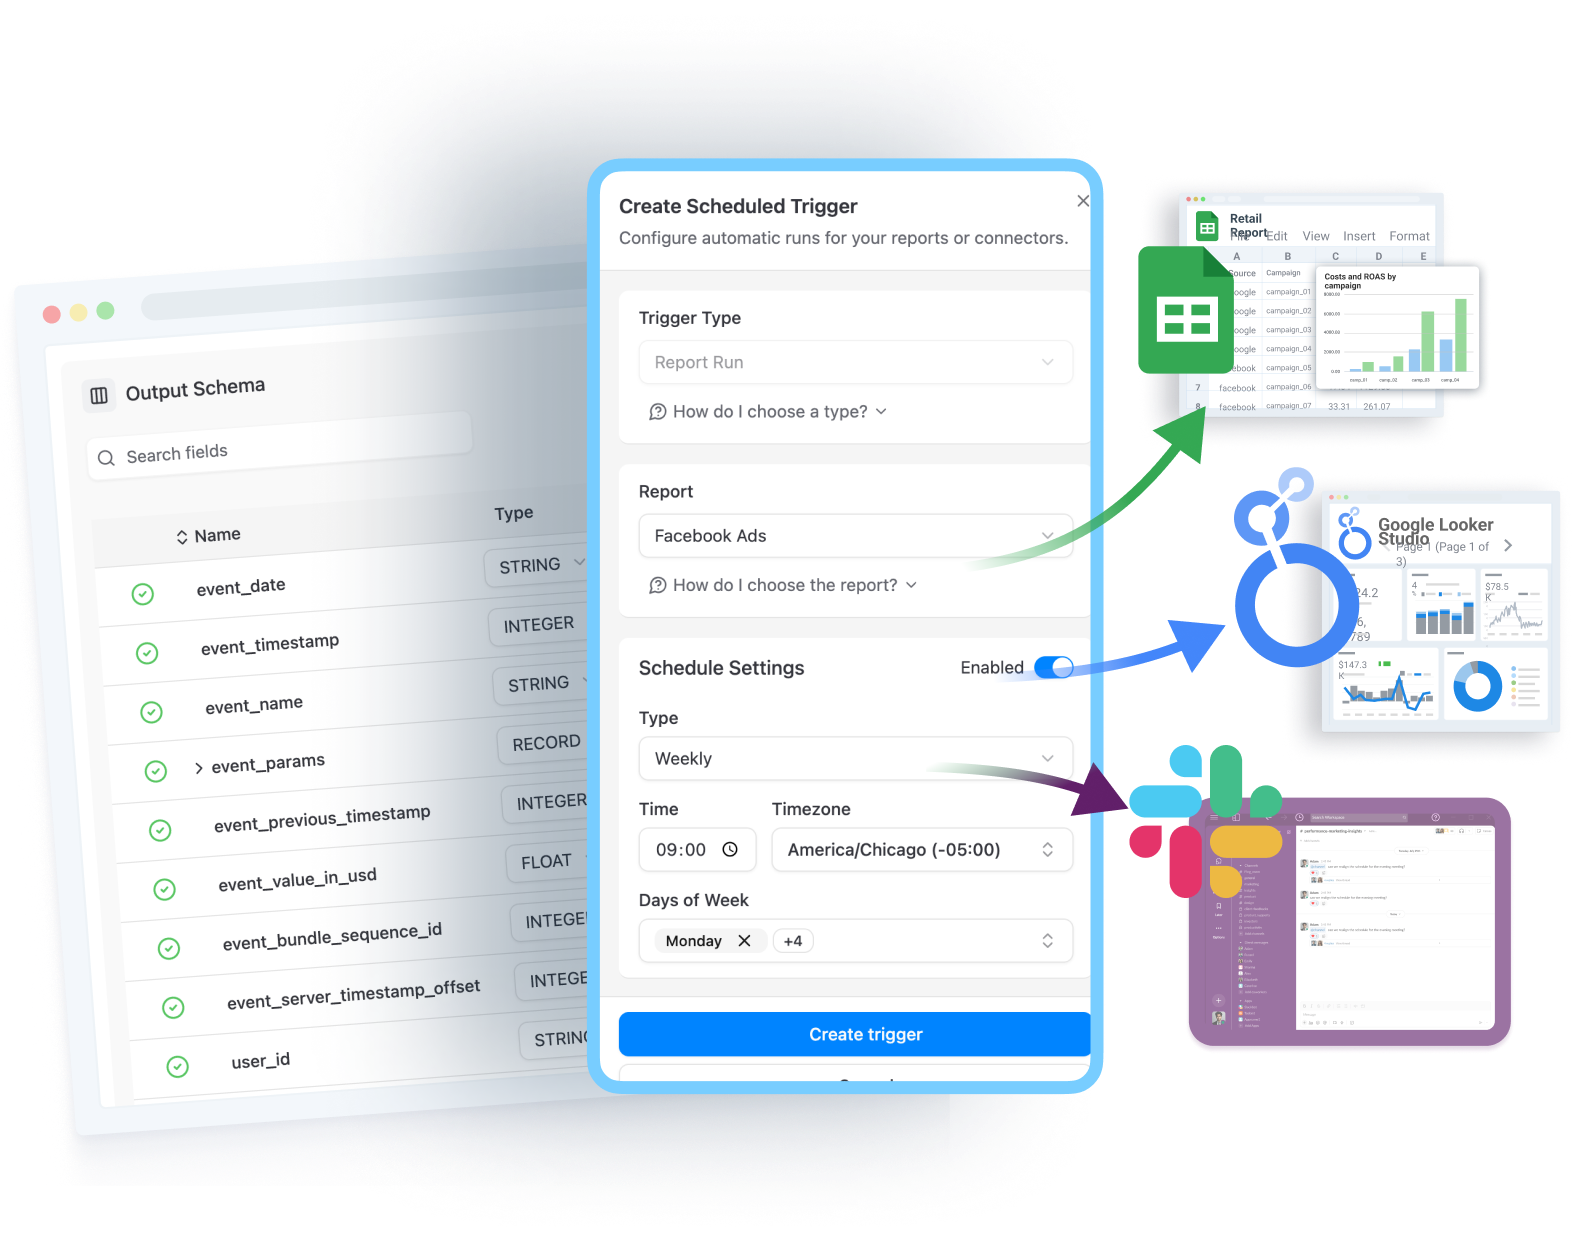
Full transparency and control

Every query, every schema, every schedule is visible and auditable

Automate

How teams use OWOX Data Marts with Looker Studio

Define business-ready data marts in your data warehouse (BigQuery, Snowflake, Athena, etc.)
Centralize metric definitions, joins, filters, and business logic in one place
Reuse the same data marts across multiple Looker Studio dashboards
Fewer broken models, fewer rewrites, fewer “can you fix this measure?” requests for data teams.
Combine Looker Studio flexibility with governed, analyst-owned data
How teams use OWOX Data Marts with Looker Studio
Why teams pick OWOX

Why OWOX as a companion to Looker Studio

Governed dashboards

Governed dashboards

Every dashboard runs on the same governed data marts — no duplicated custom fields or conflicting metrics.

Always fresh

Always fresh

Data marts refresh on schedule. Dashboards always show fresh, trusted numbers without manual intervention.

Define once, use everywhere

Define once, use everywhere

Analysts define metrics once in SQL. Looker Studio consumers explore freely without breaking anything.

One source of truth

Less maintenance

Same data mart feeds Looker Studio, Google Sheets, and AI Insights — one source of truth across every tool.

Less maintenance

Less maintenance

Fewer broken dashboards, fewer "can you fix this chart?" requests, fewer hours wasted on reporting maintenance.

Less debate, more action

Less debate, more action

When every visualization runs on governed data, teams stop debating numbers and start acting on insights.

What users are saying

Not testimonials. Comment threads.

From the founder and CMO who actually run on it. Each quote is a real thing they said – attached to a specific claim.

C3
re: trusting AI
Nodari Rizun
Founder & CEO, Pürblack®

"AI by its nature will hallucinate. You need guardrails so you can trust your data."

A1
re: one source of truth
Mark Simmons
CMO, Pürblack®

"We had six or seven different channels and no single source of truth. It was almost impossible"

E7
re: getting time back
Nodari Rizun
Founder & CEO, Pürblack®

"We regained time. And time is the one resource that never comes back."

Bi Tool

Run every Looker Studio dashboard on trusted data

BI tool

Business teams keep the flexibility they love
Data teams retain control over logic and definitions
No more fragile joins duplicated across spreadsheets
See how it works