Collect TikTok Ads Data into Snowflake for Trusted Paid Media Reporting
Discover a step-by-step guide to integrate TikTok Ads with Snowflake, build reusable data marts, and blend cross-channel paid media data.

Paid social is one of the most volatile parts of the media mix – and TikTok often sits at the center of that volatility. Budgets shift fast, creative fatigue hits quickly, and performance can change overnight. If your TikTok Ads data lives in CSV exports, fragile connectors, or disconnected spreadsheets, you cannot react fast enough or trust what you see.
.png)
This guide shows how to centralize TikTok Ads data in Snowflake in a way that is repeatable, governed, and analysis-ready. You will learn how to connect TikTok to Snowflake, land raw data safely, build reusable data marts instead of one-off SQL queries, blend TikTok with other paid channels, and deliver trusted reporting into the tools your teams already use.
If you prefer a controlled data mart layer instead of maintaining everything manually, you can start using OWOX Data Marts today.
What You’ll Build in This Guide
By the end of this article, you will know how to build:
- Automated TikTok Ads → Snowflake ingestion – scheduled pipeline that continuously syncs TikTok Ads performance data into your Snowflake environment.
- A standardized TikTok Ads data mart(s) – controlled and governed reporting layer with consistent metrics, dimensions, and business logic, reusable across dashboards and teams.
- Unified paid media reporting across channels – Blended views that align TikTok Ads with Google Ads, Meta, and other platforms inside Snowflake for cross-channel performance analysis.
- Attribution-ready and ROAS analysis-ready datasets – Clean, transformation-ready tables that support segmented ROAS, CPA, funnel analysis, and region-level performance reporting.
- Revenue and LTV-linked performance views – Data models that connect TikTok Ads spend to CRM, billing, or product data for profitability and long-term value analysis.
- A governed reporting layer ready for BI and AI tools – data marts that Google Sheets, Looker Studio, dashboards, and AI workflows can query safely and consistently.

Why Move TikTok Ads Data into Snowflake?
TikTok Ads reporting works well for in-platform campaign optimization, but it becomes restrictive when you need unified paid media reporting or deeper business analysis.
Platform dashboards and manual exports make it difficult to:
- Compare TikTok performance with Google Ads, Meta, and other paid channels
- Align campaign and audience taxonomy across platforms
- Join ad data with web analytics, CRM, or product revenue tables
- Standardize metrics and attribution logic in one governed place
By landing TikTok Ads data in Snowflake, you can:
- Build a clean, reusable TikTok data mart as part of your broader paid media model
- Harmonize dimensions such as channel, campaign, region, and device
- Blend TikTok spend with other channels into unified fact tables
- Tie TikTok performance directly to revenue, LTV, and profitability
This transforms TikTok Ads from a standalone advertising platform into a fully integrated component of your warehouse-driven paid media analytics strategy.
Why a Data Mart–First Approach Beats DIY ETL
Landing raw API tables is only the beginning. The real challenge is transforming that raw data into business-ready datasets that teams can trust.
A data mart–first approach ensures:
- One standardized definition of spend, conversions, and ROAS
- Consistent naming conventions across campaigns and markets
- Clear separation between raw ingestion and business logic
- Reusable tables that power reporting, experimentation, and AI
You can build this modeling layer manually using SQL patterns. Or you can use OWOX Data Marts to generate and manage governed TikTok data marts directly inside Snowflake while retaining full warehouse control.
Architecture Overview: TikTok Ads to Snowflake
A well-structured TikTok → Snowflake pipeline follows three clear phases.
Extraction
TikTok Ads data is retrieved through the Marketing API or a managed connector. Campaign, ad group, creative, and performance data are pulled on a defined schedule.
Loading
Raw API-shaped tables land inside a controlled Snowflake schema such as TIKTOK_RAW. This layer preserves full granularity and protects against API schema changes.
Re-Using
On top of raw tables, staging views, and data marts:
- Normalize currencies and time zones
- Standardize core KPIs such as spend, CPA, and ROAS
- Harmonize naming conventions
- Prepare cross-channel joins
This layered design separates ingestion from analytics logic and makes the system easier to maintain over time.
What Data Lands in Snowflake
Once connected, two distinct layers of TikTok data exist in your warehouse.
Raw Tables
Raw tables mirror the TikTok API structure and typically include:
- Campaign metadata
- Ad group configuration
- Creative details
- Daily or hourly performance metrics
- Spend and conversion data
These tables preserve full granularity and are primarily used for validation and transformations.
Data Marts (Analytics Layer)
On top of raw tables that are loaded with OWOX Connectors, you can create more data marts to expose:
- Daily performance grain
- Standardized KPIs such as spend, impressions, clicks, conversions, CPA, ROAS with other ads platforms
- Normalized campaign and account naming (again, across tools & platforms)
This analytics layer becomes the foundation for dashboards, cross-channel comparisons, experimentation analysis, and AI insights.
Step 1: Connect Snowflake as Your Storage in OWOX Data Marts
The first step in your TikTok Ads → Snowflake pipeline is to configure Snowflake as your primary storage inside OWOX Data Marts. This connection is created once and reused across all data marts, including the one that will ingest TikTok Ads data.
Creating a Snowflake connection in OWOX Data Marts
First, you’ll tell OWOX how to reach your Snowflake account and which credentials to use.
1. Log in to OWOX Data Marts
- Sign-up to https://www.owox.com/app-signup
- Create a Project if you don’t already have one.
2. Go to the data storages
- In the OWOX Data Marts interface, open the Storages section
- Then click “+ new storage”.

3. Select Snowflake as the storage type
- From the list of available destinations, choose Snowflake.
- This opens the Snowflake configuration form, where you’ll enter connection parameters.
4. Enter Snowflake connection details
Provide the required connection parameters:
- Account Locator and Account Identifier (for example, mycompany-xy12345.eu-central-1)
- Warehouse Name (for example, WH_MARKETING_ANALYTICS)
These define where TikTok Ads raw data and data marts will be created.

5. Choose an authentication method
OWOX supports two authentication approaches:
- Password-based (username + password)
- Key-based (requires admin permissions)
Enter:
- A Snowflake username (a dedicated technical user is recommended)
- The corresponding password or private key credentials
- Click ‘Save’
Using a dedicated technical user ensures controlled permissions and easier auditing.

Step 2: Create TikTok Ads Insights Data Mart
With Snowflake connected, the next step is to connect TikTok Ads so OWOX can start pulling data into your warehouse. This is where you define what gets ingested – accounts, objects, metrics, and update behavior.
OWOX uses TikTok’s authorization flow to securely connect to your ad accounts. You’ll need access to the relevant TikTok Business Center or ad accounts.
- Click ‘Create a New Data Mart’
- In the OWOX interface, go to ‘+ New Data Mart’.
- Give the data mart a clear title, such as “TikTok Ads Insights”.
- Select ‘Snowflake’ as the Data Storage.
- Click ‘Create Data Mart’.

Configure Data Mart
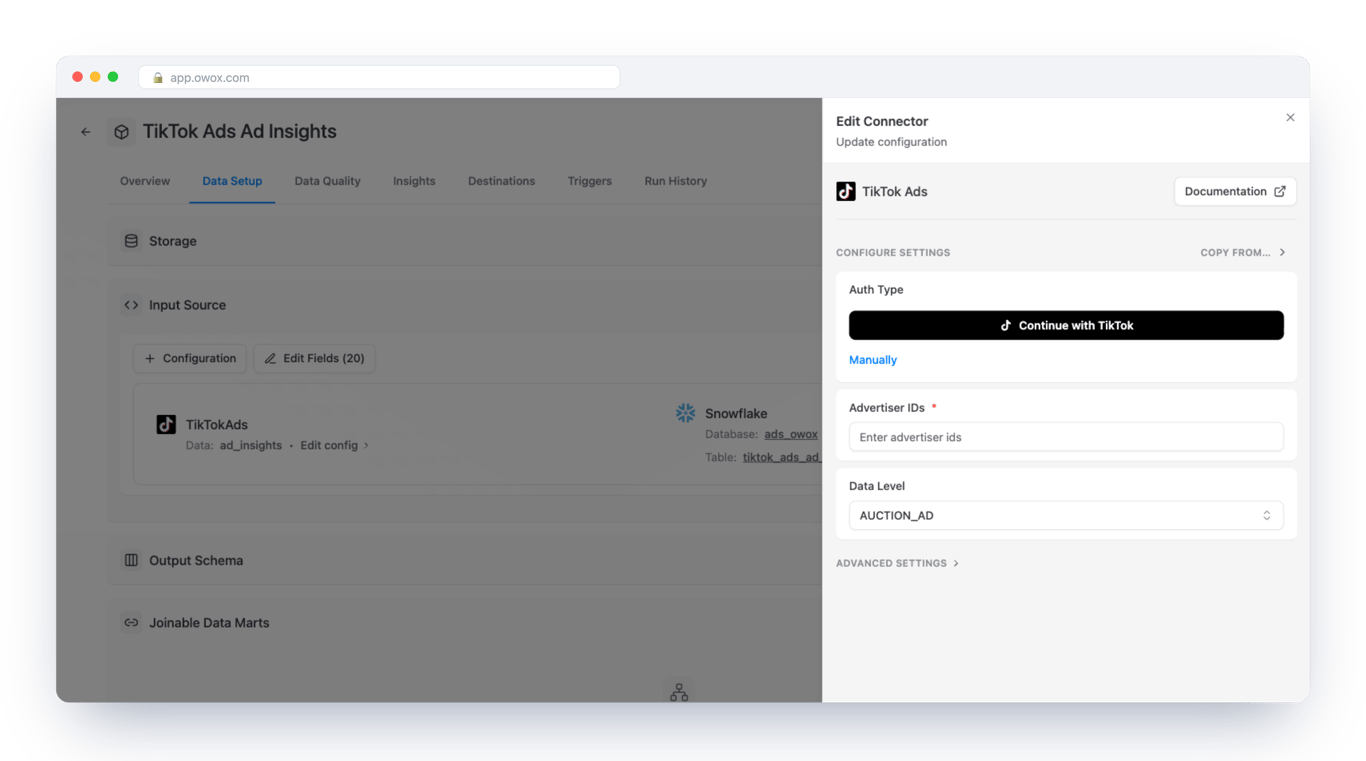
- Select ‘Connector’ as the Input Source.
- Choose ‘TikTok Ads’ as the Connector.

- Authorize using TikTok’s OAuth flow.
- Log in with a user who has access to the required ad accounts.
- Add your TikTok Account ID(s).
- Click ‘Next’.

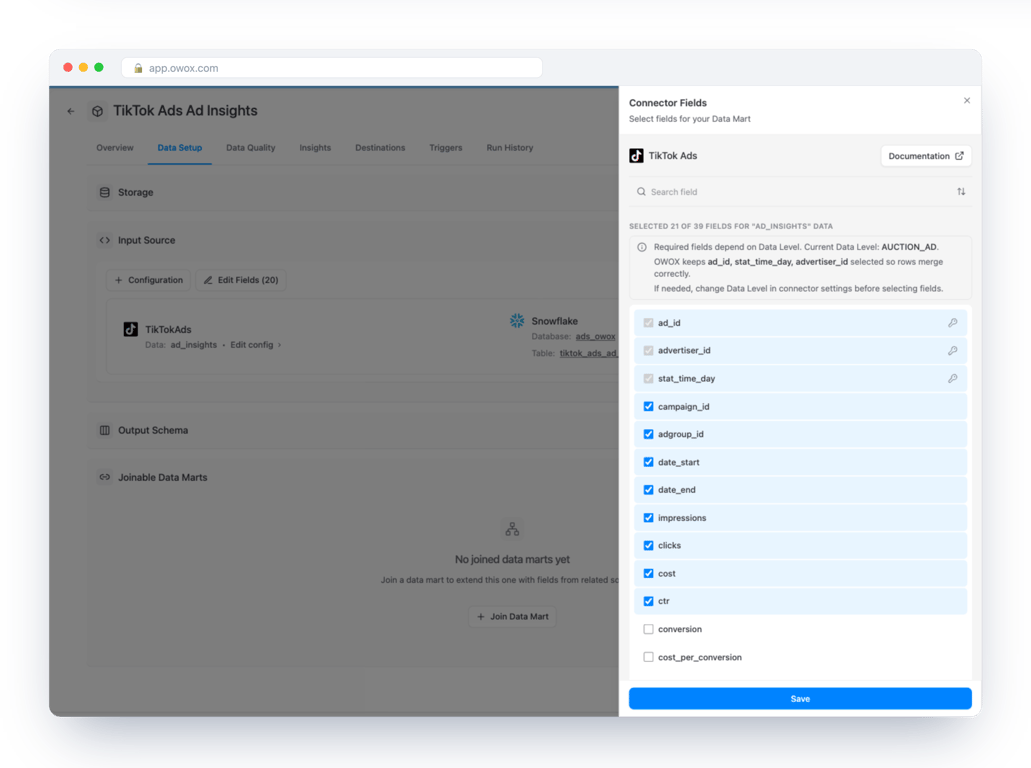
- Select the appropriate reporting endpoint.
- Choose the metrics and dimensions you want to collect, such as impressions, clicks, spend, conversions, and creative attributes.
- Click ‘Next’.

- Choose the metrics and dimensions you want to collect, such as impressions, clicks, spend, conversions, and creative attributes.
- Click ‘Next’

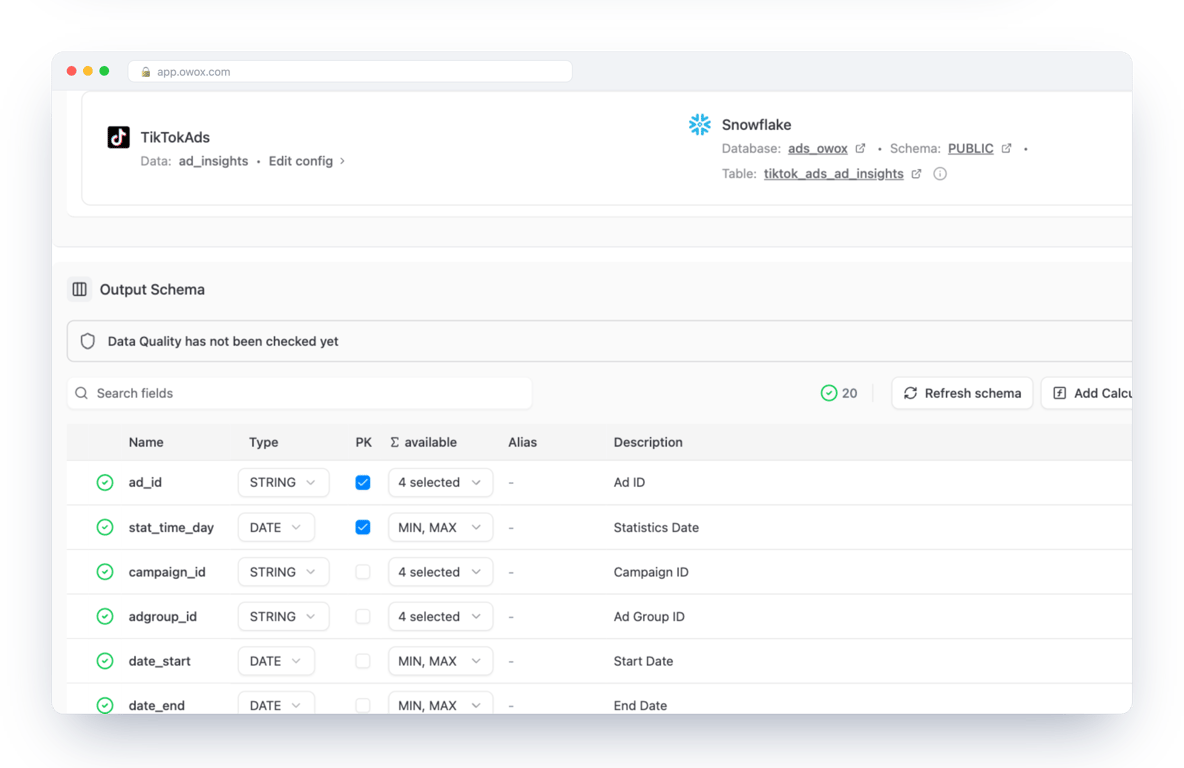
- Select the destination Database, Schema, and Table in Snowflake.

- Click ‘Save’.
- Click ‘Publish the data mart’.

Run Your Connector
Run the first data pull to validate the setup and confirm data is flowing correctly.
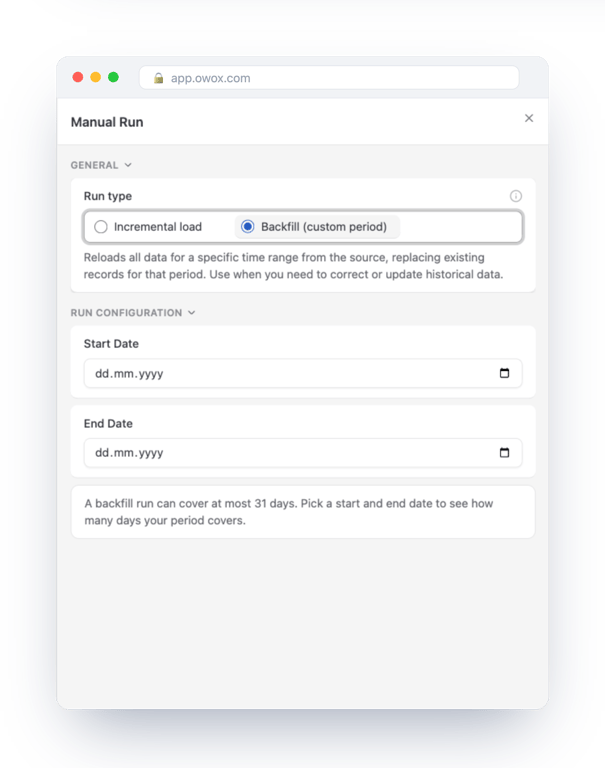
- Click ‘Manual Run’.
- Choose between ‘Incremental’ (Last 2 Days) or ‘Backfill’.

Historical backfill
Use Backfill for the initial load and select the date range you need.
- You can pull 7 days, 30 days, 90 days, or longer, depending on reporting needs.
- For initial validation, 90 days is often a practical balance.
Note: It will work even for 5 years of history, but be aware that it might take some time.

Incremental load
Incremental runs keep data fresh without reprocessing the full history. For every run:
- Pulls data for today + last 2 days.
- Overwrite those days in Snowflake.
This ensures:
- Recent performance stays accurate.
- Historical tables remain stable.

Scheduling
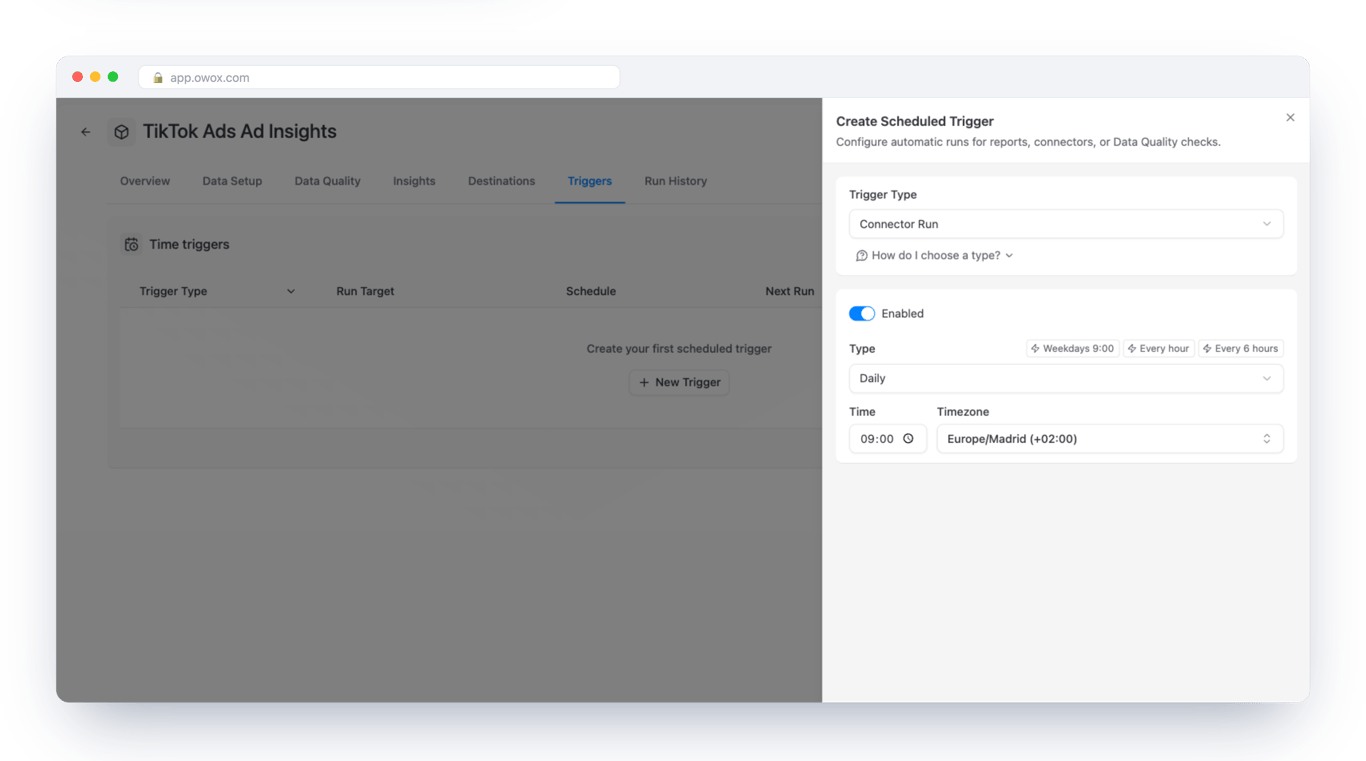
TikTok Ads data updates continuously, and conversions may be attributed retroactively. Schedule regular runs to keep data fresh.
- Go to the Triggers tab.
- Select ‘Connector Run’ as the Trigger Type.
- Then configure Frequency:
- Daily (e.g., every morning between 02:00 and 07:00) for most reporting needs.
- Intra-day (e.g., every 4 hours or every 15 minutes) if you need near-real-time visibility.
- Set the appropriate timezone.
- Click ‘Create Trigger’.

Add Data Mart Overview (Meta Data)
With OWOX Data Marts, you can document your TikTok Ads data mart to keep your Snowflake environment organized and transparent over time.
Go to the Overview tab and add a clear Description that explains:
- What the TikTok data mart includes (e.g., campaign, ad group, ad, performance metrics)
- The reporting grain (daily, campaign-level, ad group-level, etc.)
- Which team or owner is responsible for maintaining it
- Any modeling notes, such as dimension harmonization rules, naming standards, or attribution logic
While optional, documenting your TikTok data mart improves collaboration and makes future updates, blending, and cross-channel reporting significantly easier.

Control
Go to the Run History tab to monitor every execution of your TikTok Ads data mart, covering both connectivity and data enablement.
You can review:
- Run status (success, running, failed)
- Start and end time
- Duration
- Number of rows processed
- Error details (e.g., expired tokens, permission issues, API limits)
If a run fails, open the logs to identify the issue and re-run the connector after resolving it.
Data Marts Best Practices
When setting up a new TikTok Ads data mart, follow these simple rules:
- Start with a smaller subset (e.g., one ad account or campaign) and a limited set of fields to validate the structure and completeness.
- Add all active TikTok Ads accounts only after you confirm the configuration works as expected.
- Expand fields gradually using “+Fields” – your Snowflake schema will update automatically.
- Add a clear description once setup is complete to document ownership, reporting grain, and modeling logic.
Step 3: Re-Use TikTok Ads Data Mart for Reporting
With a governed TikTok Ads data mart in Snowflake, you can move beyond isolated platform dashboards and CSV exports. The data mart becomes a stable, queryable layer that powers spreadsheets, BI tools, and cross-channel analysis from a single source of truth.
Now you can:
- Connect Google Sheets and Looker Studio directly to your TikTok Ads data mart
- Blend TikTok performance with other paid channels inside Snowflake
- Build unified ROAS, CAC, and funnel views across campaigns, regions, and objectives
The goal is to make your TikTok Ads data mart the default foundation for reporting and decision-making across marketing and leadership teams.
Connect Google Sheets and Looker Studio directly to this standardized TikTok Ads data mart
You don’t need to replace your reporting tools to benefit from Snowflake. As long as they can connect to Snowflake, they can query the TikTok Ads data mart in real time. This allows business users to explore trusted data without direct access to raw tables.
TikTok Ads Report in Google Sheets
Go to the Destinations tab and connect Google Sheets for reporting.
Then:
- Create a new report
- Provide the target Sheet URL
- Choose the refresh schedule
- Save and publish

This gives marketers spreadsheet-level access to up-to-date TikTok Ads data without manual exports.
Best practices:
- Use read-only tabs for synced data
- Keep user formulas in separate tabs
- Document which data mart or query powers each sheet
Connecting Looker Studio
To connect Looker Studio:
- Navigate to Destinations in OWOX Data Marts
- Click + New Destination
- Select Looker Studio as the destination type
- Provide a unique title (e.g., “Looker Studio – Marketing Team”)
- Save and follow the connection instructions

By pointing Looker Studio to your curated TikTok Ads data mart rather than raw tables, you ensure dashboards always reflect consistent definitions and controlled business logic.
Example Analytics Use Cases for TikTok Ads Data
Once your TikTok Ads data mart is live in Snowflake, the real value comes from blending it with other paid channels and analyzing performance in context.
Because everything is modeled inside Snowflake, you can:
- Compare TikTok against Meta, Google Ads, and other platforms
- Align naming conventions and dimensions across channels
- Build cross-channel KPIs using consistent definitions
Below are three practical analysis patterns based on the TikTok Ads draft architecture.
1. Cross-Channel Funnel and Performance Reporting for TikTok Ads
Most teams want to understand how TikTok performs relative to other paid channels at each stage of the funnel.
To support this:
- Ingest TikTok Ads and other platform data into Snowflake
- Align common dimensions such as date, channel, campaign_id, country, device_type, and placement
- Normalize naming conventions across campaign and ad structures
Example of creating a unified campaign dimension table in Snowflake:
1CREATE OR REPLACE TABLE dim_campaign_unified AS
2SELECT
3MD5(CONCAT(channel, ':', platform_campaign_id)) AS campaign_key,
4channel,
5platform_campaign_id,
6canonical_campaign_name,
7brand,
8product_line,
9region
10FROM campaign_mapping_source;Each platform-specific data mart then joins this table to expose a canonical campaign key across channels.
Then create a unified paid media view that:
- Aggregates spend, impressions, clicks, conversions, and revenue
- Uses consistent field names across platforms
- Enables channel-level and campaign-level comparisons
Example of stacking TikTok Ads with other paid channels into a unified daily view:
1CREATE OR REPLACE VIEW mart_paid_media_daily AS
2SELECT
3date,
4'tiktok' AS channel,
5campaign_key,
6spend,
7impressions,
8clicks,
9conversions,
10revenue
11FROM mart_tiktok_daily_campaign
12JOIN dim_campaign_unified USING (campaign_id, channel)
13
14UNION ALL
15SELECT
16date,
17'google_ads' AS channel,
18campaign_key,
19spend,
20impressions,
21clicks,
22conversions,
23revenue
24FROM mart_google_ads_daily_campaign
25JOIN dim_campaign_unified USING (campaign_id, channel)
26
27UNION ALL
28SELECT
29date,
30'meta' AS channel,
31campaign_key,
32spend,
33impressions,
34clicks,
35conversions,
36revenue
37FROM mart_meta_daily_campaign
38JOIN dim_campaign_unified USING (campaign_id, channel);
This structure standardizes metrics across channels while keeping platform-level granularity.
This allows you to answer questions such as:
- How does TikTok perform versus Meta or Google Ads by market?
- Which channel drives stronger upper-funnel engagement?
- Where does TikTok contribute most in the funnel relative to other platforms?
2. Attribution-Ready ROAS and CAC Views Across TikTok and Other Channels
With harmonized dimensions in place, you can build KPI-ready views that standardize how performance is evaluated across channels.
Typical derived metrics include:
- ROAS = revenue/spend
- CAC = spend/conversions
- CTR = clicks/impressions
Then expose derived metrics for ROAS, CAC, and funnel KPIs:
Example of calculating standardized KPIs in Snowflake:
1CREATE OR REPLACE VIEW mart_paid_media_daily_kpis AS
2SELECT
3date,
4channel,
5campaign_key,
6SUM(spend) AS spend,
7SUM(impressions) AS impressions,
8SUM(clicks) AS clicks,
9SUM(conversions) AS conversions,
10SUM(revenue) AS revenue,
11SAFE_DIVIDE(SUM(revenue), NULLIF(SUM(spend), 0)) AS roas,
12SAFE_DIVIDE(SUM(spend), NULLIF(SUM(conversions), 0)) AS cac,
13SAFE_DIVIDE(SUM(clicks), NULLIF(SUM(impressions), 0)) AS ctr
14FROM mart_paid_media_daily
15GROUP BY 1,2,3;This view becomes the foundation for consistent ROAS and CAC analysis across TikTok and other paid channels.
By calculating these metrics consistently across TikTok and other platforms, you can:
- Compare blended TikTok ROAS to total media ROAS
- Break down performance by campaign family or product line
- Evaluate performance by region, device, or placement
This approach ensures TikTok Ads performance is analyzed using the same KPI logic as the rest of your paid media ecosystem.

3. Executive Dashboards and Budget Reallocation Insights Powered by Blended Data
Once cross-channel views are available, BI tools can surface strategic insights for leadership and planning.
Typical dashboards and queries include:
- Channel vs. ROAS leaderboards
- Daily or weekly ROAS by channel and region
- Drill-down views comparing TikTok campaigns to Meta and Google Ads
- Funnel progression views (impressions → clicks → conversions)
- Marginal ROAS analysis by channel and market
You can also:
- Identify where TikTok plays a stronger assist role in upper-funnel campaigns
- Detect underperforming campaign families
- Model budget reallocation scenarios based on consistent cross-channel KPIs
These dashboards move TikTok reporting from isolated campaign monitoring to unified paid media optimization.
Step 4: Turn TikTok Ads Data in Snowflake into Proactive AI Insights
Once your TikTok Ads data mart is live in Snowflake and powering reports, the next step is to activate it. Instead of manually checking dashboards, you can configure AI-driven insights that continuously monitor performance, detect anomalies, and generate actionable summaries for your team. With a structured TikTok Ads data mart in place, key KPIs are tracked automatically, and business rules or thresholds can be embedded directly into prompts.
Recurring analyses can run on a defined schedule, with insights delivered straight to Slack, Microsoft Teams, or email. This ensures stakeholders receive timely updates without querying the warehouse themselves and turns Snowflake from a passive storage layer into a proactive decision-support system.
Configuring AI Insights on Top of Your TikTok Ads Data Mart
AI Insights in OWOX operate on top of curated, modeled tables. That’s why the TikTok Ads data mart is critical – it provides clean schemas, standardized metrics, and stable definitions AI can reliably query.
To configure insights:
- Navigate to the Insights tab.
- Click on ‘Create insight’, it’ll start using an OWOX-generated prompt or define your own.
- Click ‘Run’ and see to preview the output.
- Add a destination (Google Chat, Slack, Teams, or Email).
- Schedule delivery.
Because your TikTok Ads metrics are already standardized in the data mart (spend, impressions, clicks, conversions, revenue, ROAS, CPA), the AI doesn’t need embedded SQL logic in each prompt. The modeling work has already been done.

Designing Prompts and Business Context for Marketing Teams
The quality of AI-generated insights depends on the clarity of your instructions. Prompts should reflect how your paid media team thinks about TikTok performance.
1. Frame the AI’s Role
Define what the assistant is analyzing. For example:
“You are a paid media analyst reviewing TikTok Ads performance for the last 7 days versus the previous 7 days.”
This sets the scope and tone.
2. Specify Focus Metrics and Thresholds
Tell the AI what matters for TikTok performance.
Common focus areas:
- ROAS
- CPA
- Spend pacing
- Click-through rate
- Conversion rate
- Spend spikes by campaign or audience
You can define triggers such as:
- Flag campaigns where ROAS drops more than 20% week-over-week.
- Highlight ad groups where CPA exceeds the target by 30%.
- Identify sudden spend increases without a proportional lift in conversions.
These rules should reference standardized fields in the TikTok Ads data mart.
3. Provide Business Context
AI performs better when given operational boundaries.
Include details like:
- Target ROAS or CPA ranges by region.
- Strategic markets (e.g., US, UK, DACH).
- Campaign naming logic (e.g., campaigns starting with “PROSPECTING_” vs. “RETARGETING_”).
- Budget priorities by product line or business unit.
This ensures insights are aligned with your marketing strategy, not just raw metrics.
4. Make Outputs Marketing-Friendly
Insights should be readable and actionable.
Ask the AI to:
- Use plain language.
- Highlight key changes.
- Separate:
- Key performance shifts
- Risks or anomalies
- Recommended actions
Instead of raw tables, the output becomes a concise summary that your paid media team can act on immediately.
Delivering Scheduled Insights into Slack, Teams, and Email
Once prompts are configured and validated, the final step is controlled delivery.
1. Configure Delivery Destinations
Choose where insights should appear:
- Slack channel
- Microsoft Teams channel
- Email distribution list
Keep destinations aligned with how your performance team collaborates.
2. Tailor Frequency and Stakeholders
Avoid alert fatigue by defining clear cadences.
Typical patterns:
- Daily: High-level performance summary and anomaly detection.
- Weekly: Trend analysis and creative insights.
- Monthly: Strategic recap across campaigns and regions.
You can also tailor insights by audience:
- Channel owners: Detailed campaign-level breakdowns.
- CMO or marketing leadership: High-level KPIs and budget efficiency.
- Analytics team: Data quality and anomaly checks.
3. Continuous Improvement and Scaling
AI insights should evolve with your business.
Best practices:
- Review generated summaries with stakeholders.
- Adjust thresholds and language.
- Add or remove monitored metrics.
- Expand coverage to cross-channel data marts when ready.
Because the TikTok Ads data mart is governed and version-controlled in Snowflake, any logic updates propagate consistently across reports and AI workflows.

Start Centralizing Your TikTok Ads Data in Snowflake
You now have a complete blueprint: connect Snowflake, integrate TikTok Ads, build a reusable data mart, and blend it with other paid channels for unified, governed reporting.
Instead of maintaining fragile exports or one-off SQL, you can implement this architecture directly on top of your existing Snowflake environment using OWOX Data Marts.
With OWOX, you can:
- Set up a TikTok → Snowflake pipeline in hours, not weeks
- Deploy prebuilt, configurable marketing data marts
- Maintain full control over governance, security, and warehouse cost
- Deliver consistent TikTok and cross-channel metrics to BI tools, Google Sheets, and Slack or Teams
Start by connecting Snowflake and TikTok Ads, publishing your first TikTok data mart, and activating AI-powered insights across your reporting stack.
If you’re ready to centralize TikTok Ads data and unlock trusted paid media analytics, you can start using OWOX Data Marts today.
Let your team focus on scaling performance and reallocating budgets strategically – not reconciling spreadsheets and inconsistent metrics.
Frequently asked questions
You can automate TikTok Ads data ingestion into Snowflake by setting up a pipeline using tools like OWOX Data Marts. This involves connecting TikTok Ads as a data source, authorizing via OAuth, selecting relevant metrics and entities, and scheduling automated syncs to load data daily or more frequently directly into your Snowflake warehouse.
Centralizing TikTok Ads data in Snowflake provides a single, governed source of truth that supports scalable, repeatable analysis. Benefits include standardized metrics and dimensions, improved data quality and governance, scalable storage of granular data without pre-aggregation, harmonization with other paid channels for cross-channel reporting, and reliable data for BI and experimentation.
You need proper Snowflake roles and permissions, including a dedicated warehouse, database, and schema with appropriate access (USAGE, CREATE, SELECT, INSERT, UPDATE, DELETE) for a technical user. On TikTok's side, you need a Business Center account with admin access, a developer app or the use of OWOX's built-in connector, and API scopes with read access to ad accounts, campaigns, ads, and insights.
OWOX Data Marts provide a low-code/no-code modeling layer on top of Snowflake that automates the transformation of raw TikTok Ads API data into governed, reusable business-ready data marts. Users can configure which entities and metrics to include, normalize naming and currencies, align TikTok with unified channel taxonomies, and reduce the engineering overhead of maintaining custom SQL or dbt models.
A common recommended structure is a three-layer schema: RAW (raw API-shaped tables landed into Snowflake), STG (staging layer with cleaned, conformed data and normalized metrics), and data mart (business-ready tables or views with aggregated and standardized metrics for easy consumption). This layering enables governable, incremental, and reusable TikTok data marts.
To blend TikTok data with other channels like Google Ads and Meta, create channel-specific data marts with aligned dimensions and metrics. Then build unified tables or views by harmonizing common dimensions (e.g., date, campaign_id, channel) and union all channel data into a single paid media fact table. This enables cross-channel ROAS, CAC, and funnel analyses within Snowflake.
TikTok insights modeled in Snowflake can be delivered using OWOX Data Marts by exporting data to Google Sheets, connecting to BI tools like Looker Studio or Tableau, and sending anomaly and performance alerts via Slack or Microsoft Teams. This allows stakeholders to access governed, up-to-date reports without querying Snowflake directly.
Common problems include fragmented data across exports and platforms, inconsistent metric definitions, manual data preparation, unreliable third-party connectors, and siloed reports that lack attribution and historical depth. Centralizing TikTok Ads data into Snowflake with governed pipelines addresses these by unifying and standardizing data, improving reliability, visibility, and scalability.


Finally, a tool that doesn't ask business users to learn a new dashboarding UI. Our marketing team already knows Sheets. OWOX just delivers the right data.
Joinable data marts concept was the thing that sold us. We can now use the semantic layer without building one.
Self-hosted the OSS version on Digital Ocean. Zero vendor lock-in. Contributed a Shopify connector back in week two.