Trusted, proven, recognized

The analytics system teams actually use

170K+
Users trust OWOX[1]
Analysts, marketers, and data teams across 20+ industries
4.9★
Rating on G2[2]
“A trusted data analytics partner” — verified review
365K+
Data marts delivered
Created and served by OWOX to business users
92K+
npm installs[3]
Self-hosted OWOX Community Edition on GitHub
Connect

Step 1: Create an AWS Redshift Data Storage

Start by connecting your AWS Redshift environment as a data storage.

Choose your AWS region and Redshift database
Connect either a Redshift Serverless workgroup or a provisioned cluster
Authenticate securely using AWS IAM credentials
Step 1: Create an AWS Redshift Data Storage
Step 2: Create an Open Exchange Rates Data Mart
Create

Step 2: Create an Open Exchange Rates Data Mart

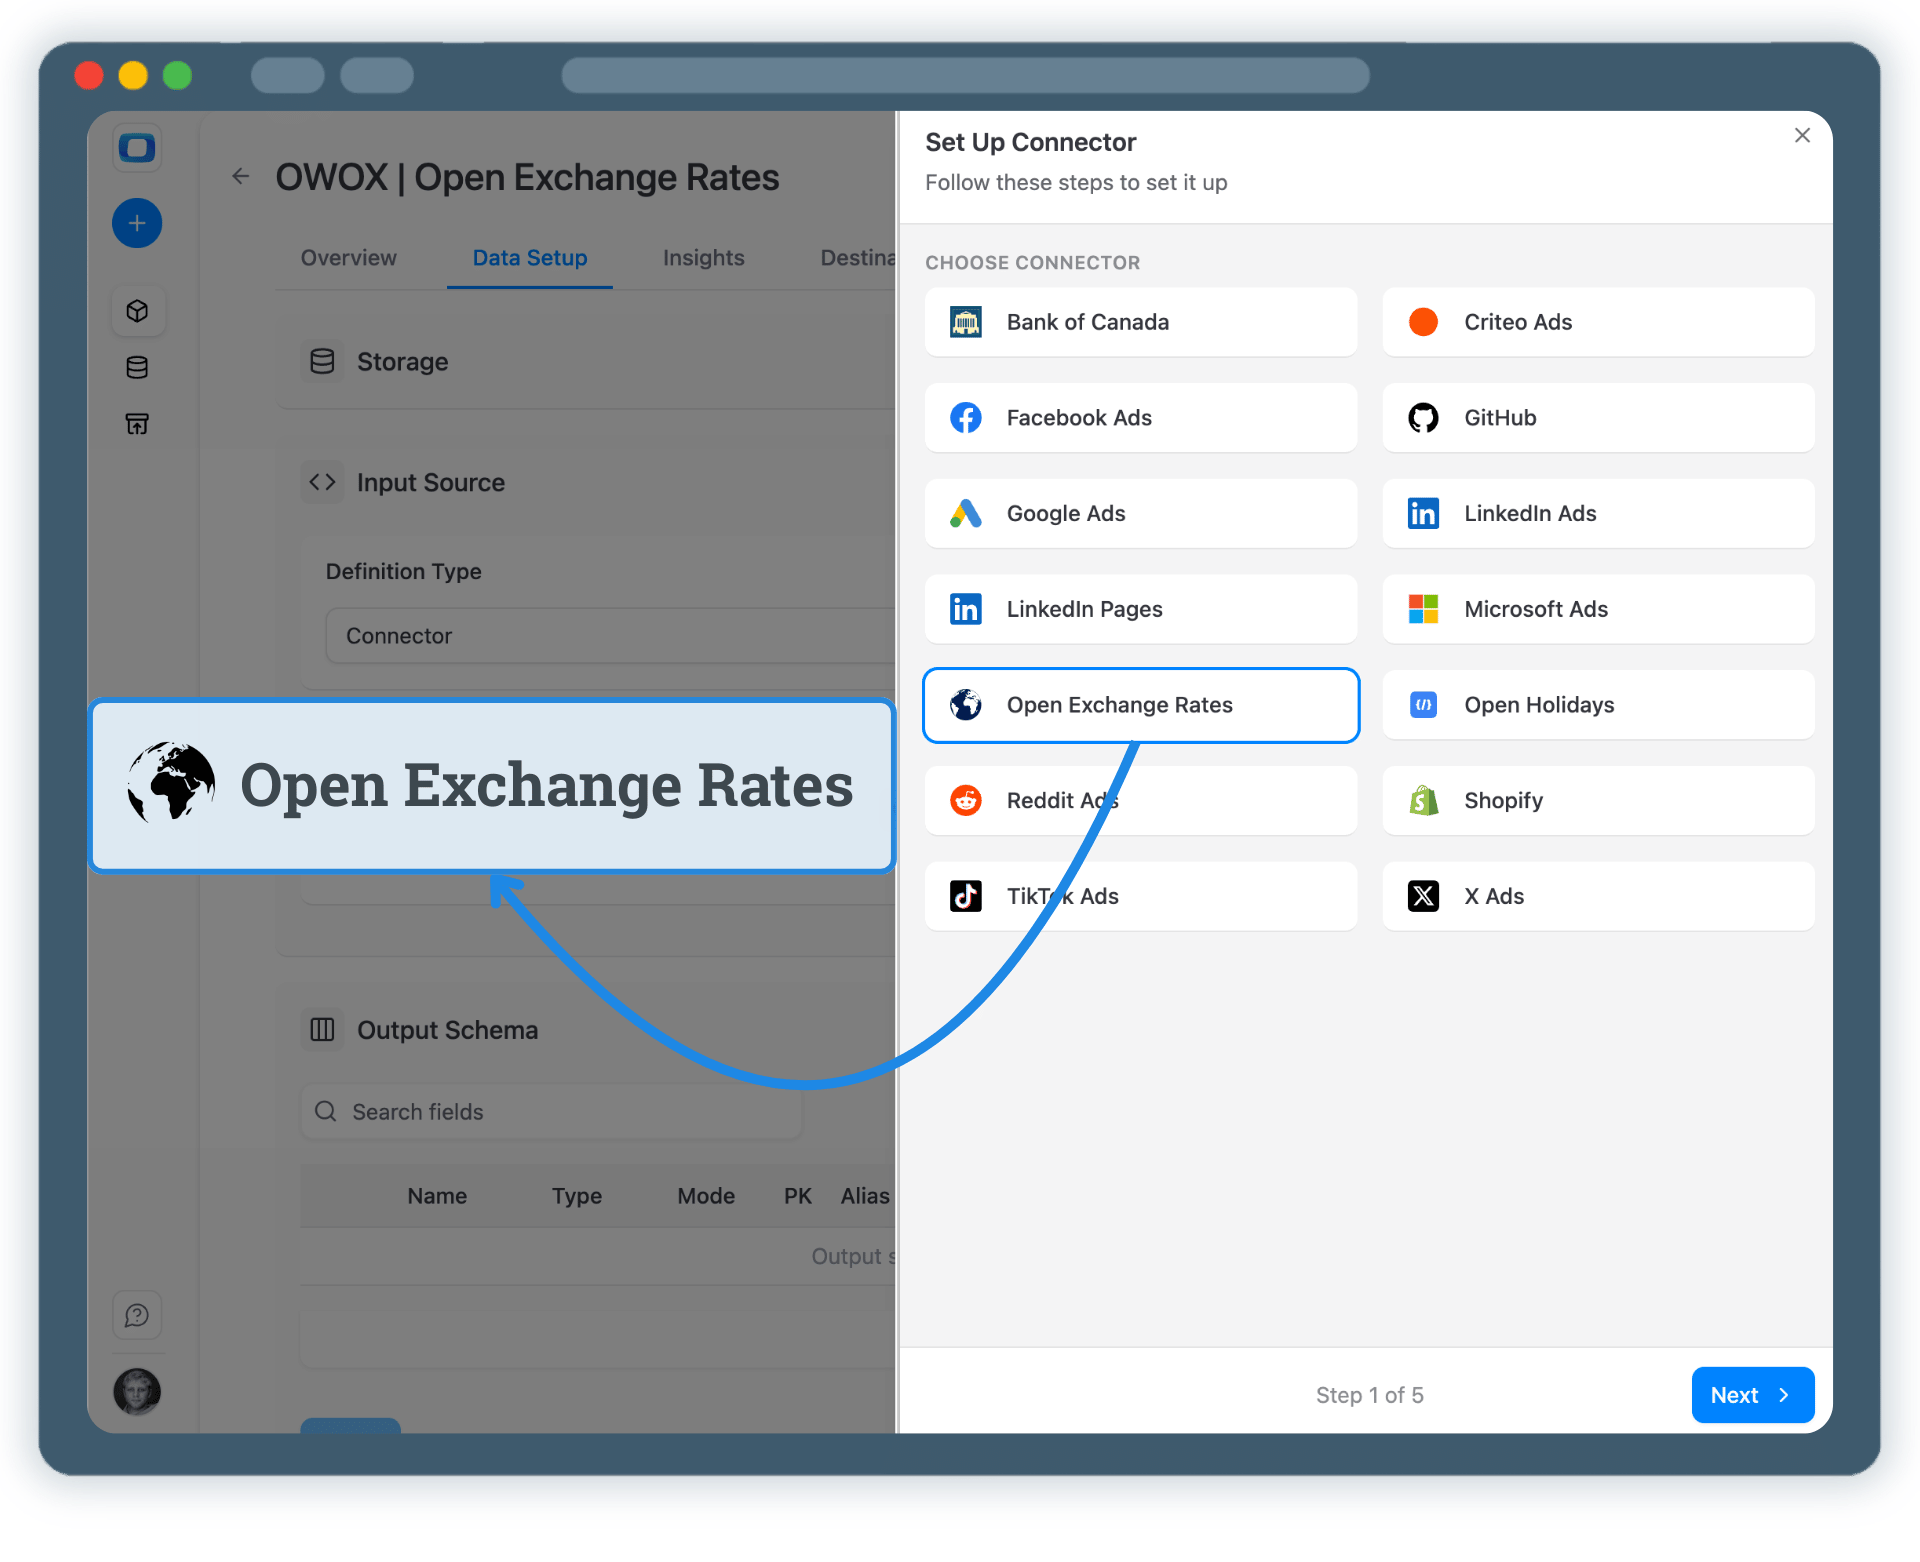
Create a new Data Mart and choose Connector as the definition type.

Select Open Exchange Rates as the data source
Provide your Open Exchange Rates API credentials
No API coding or engineering required
Step 2: Create an Open Exchange Rates Data Mart
Configure

Step 3: Select Fields & Configure Data Import

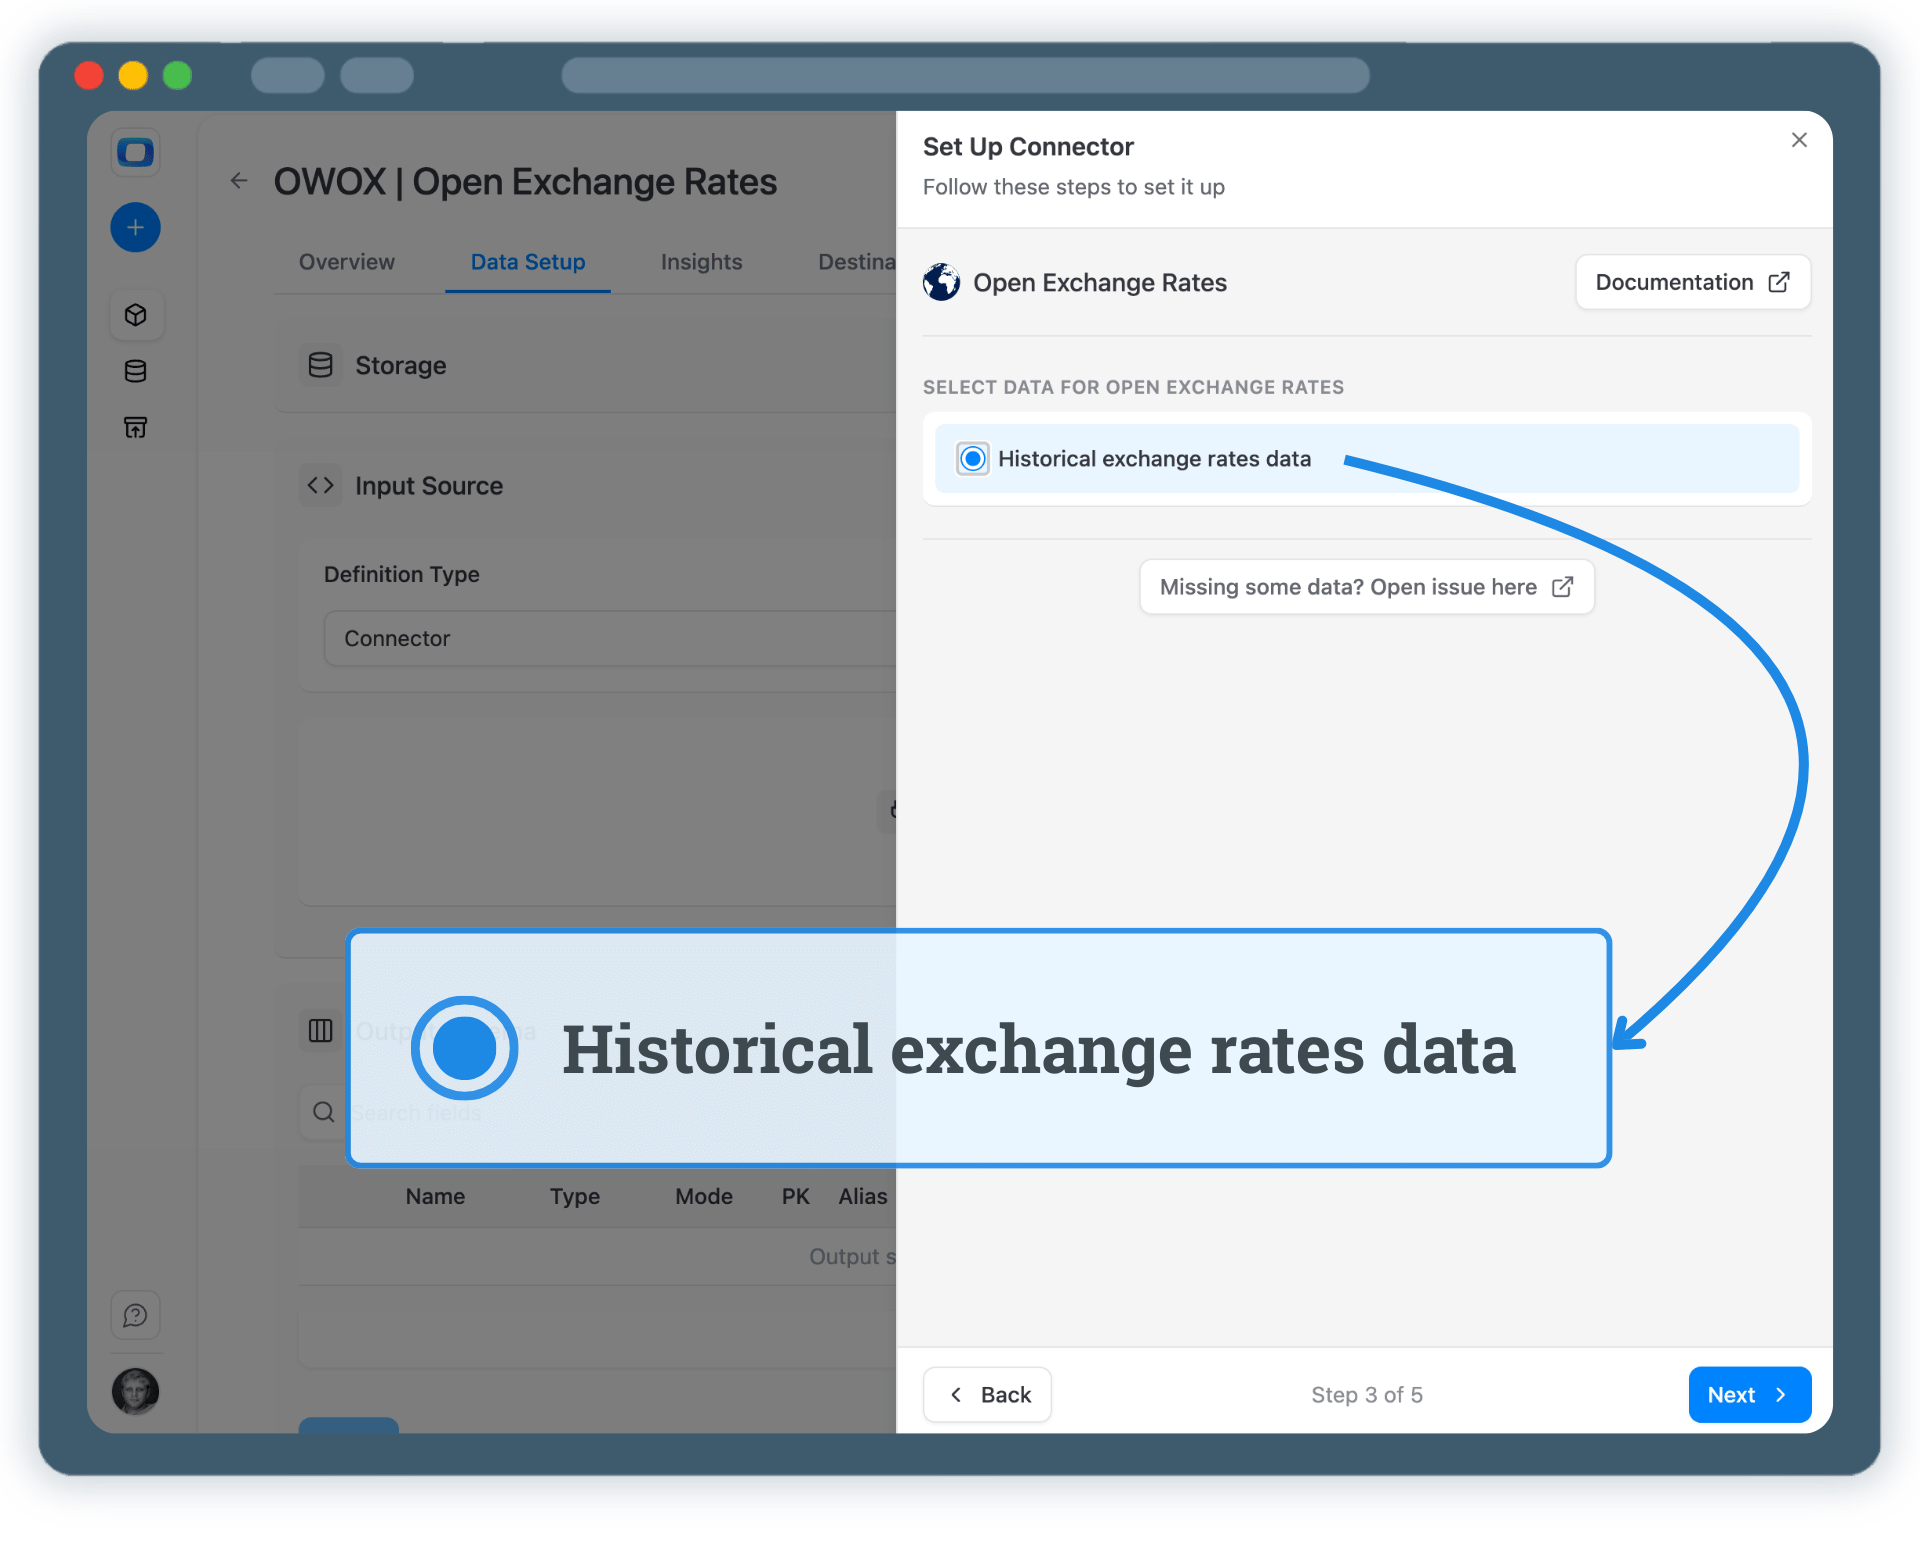
Choose exactly which currency exchange data you want to store in AWS Redshift.

Select the appropriate Open Exchange Rates API endpoint
Choose fields such as base currency, target currency, exchange rate, and timestamp
Authenticate securely using AWS IAM credentials
Step 3: Select Fields & Configure Data Import
Step 4: Run & Schedule Exchange Rates Data Collection
Run

Step 4: Run & Schedule Exchange Rates Data Collection

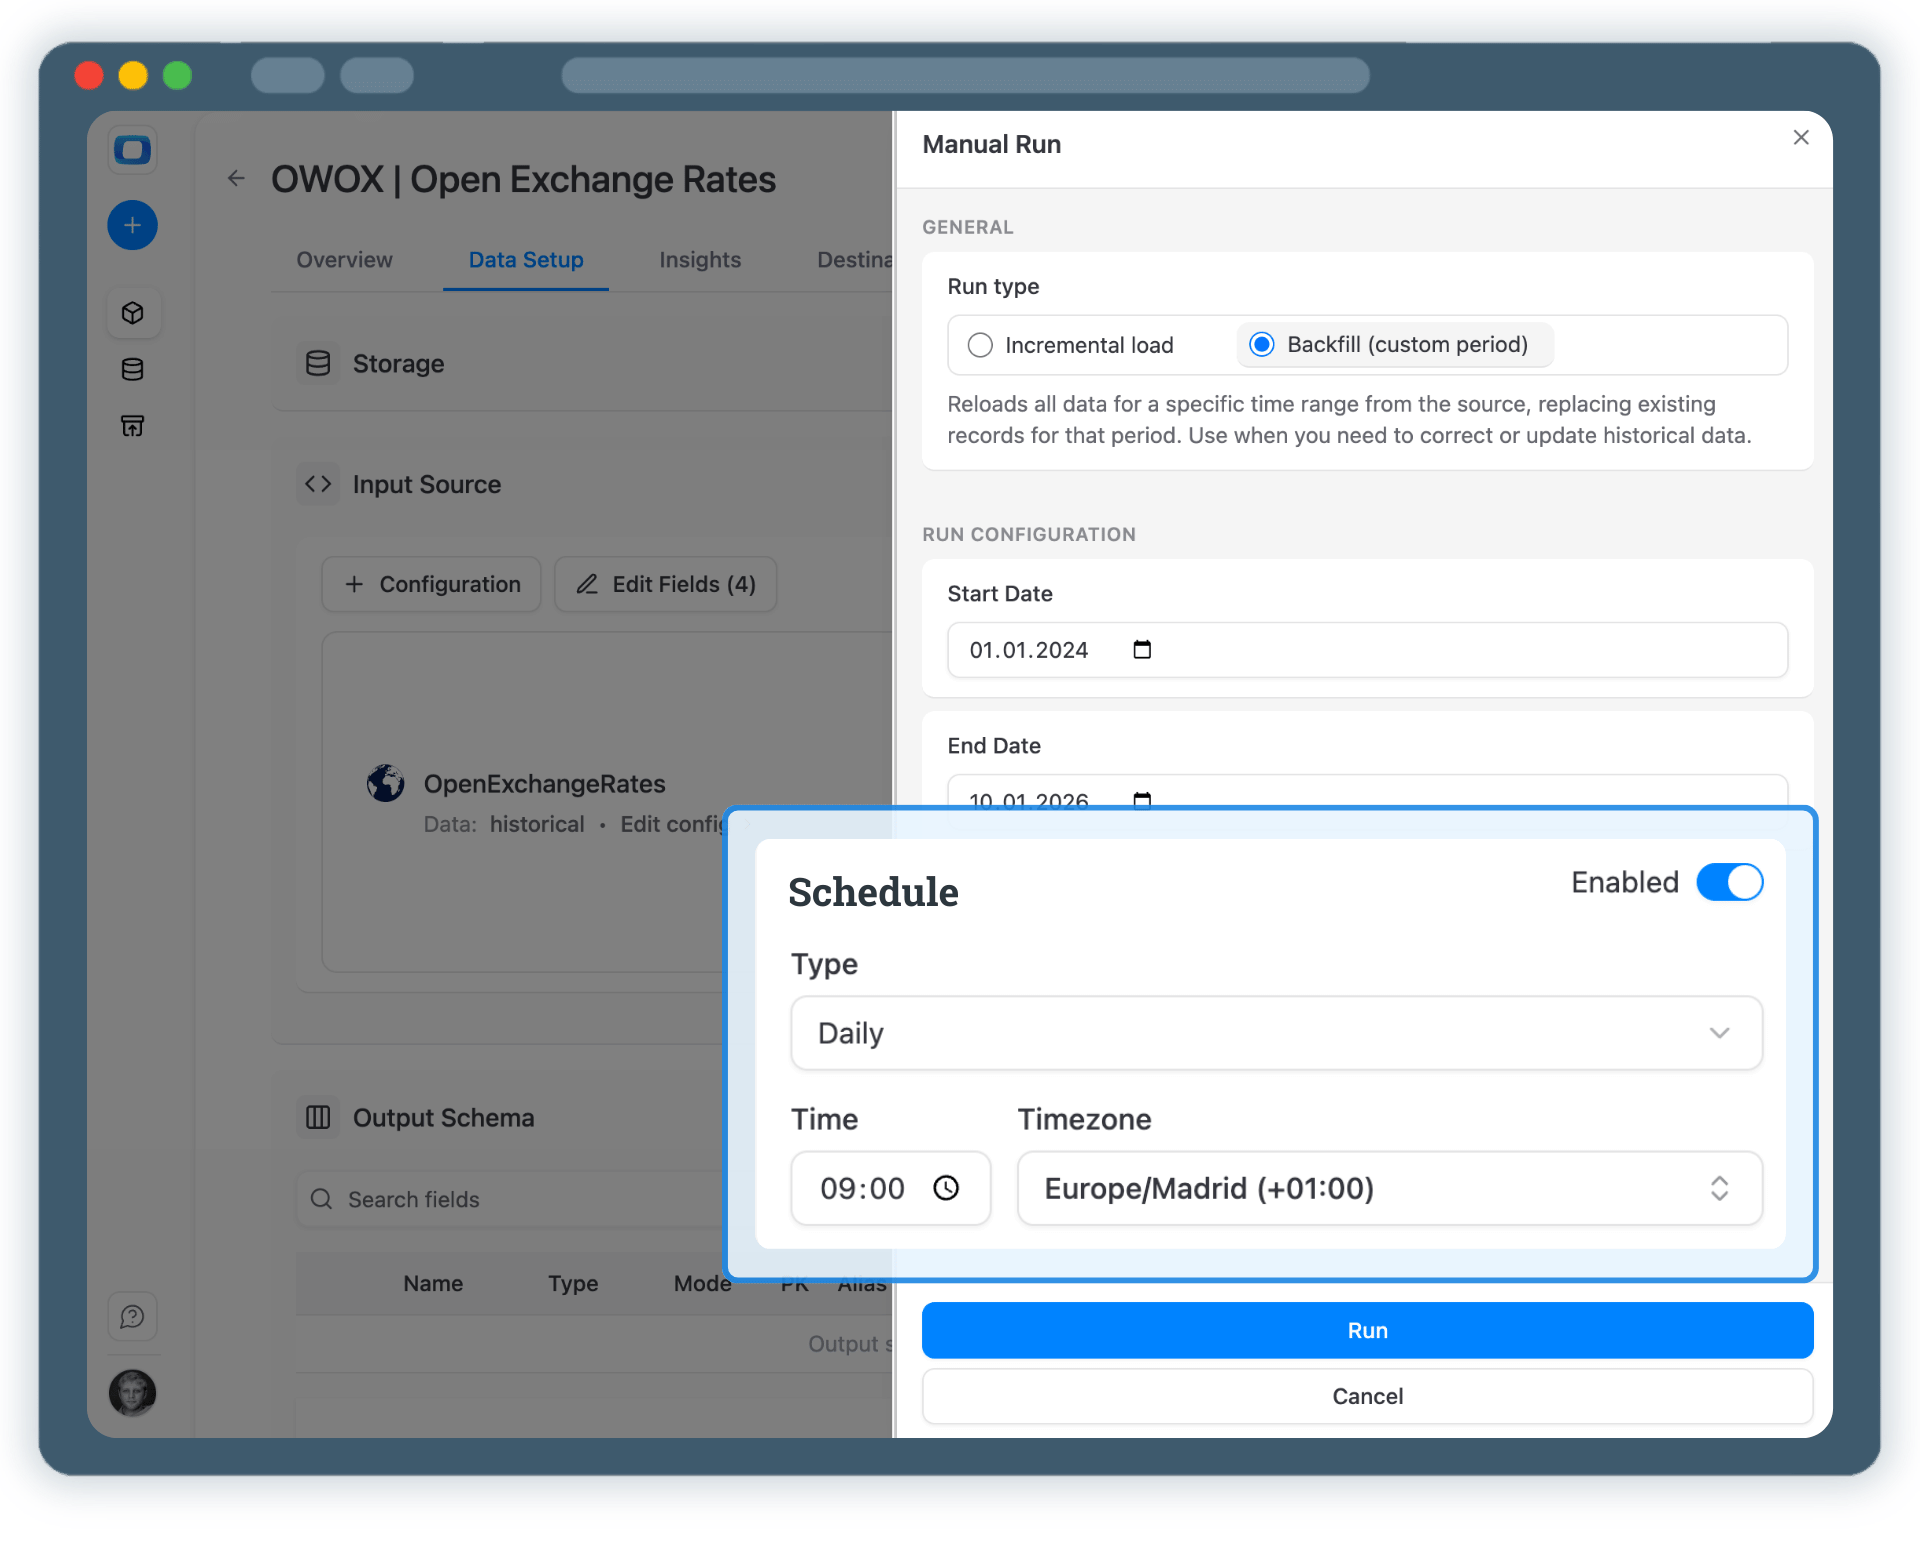
Once published, control how and when exchange rate data is imported.

Incremental load to import the latest available rates
Backfill (custom period) to load historical exchange rates
All runs are logged and visible in Run History
Step 4: Run & Schedule Exchange Rates Data Collection
Activate

Step 5: Use Exchange Rates Data Across BI Tools & AI Insights

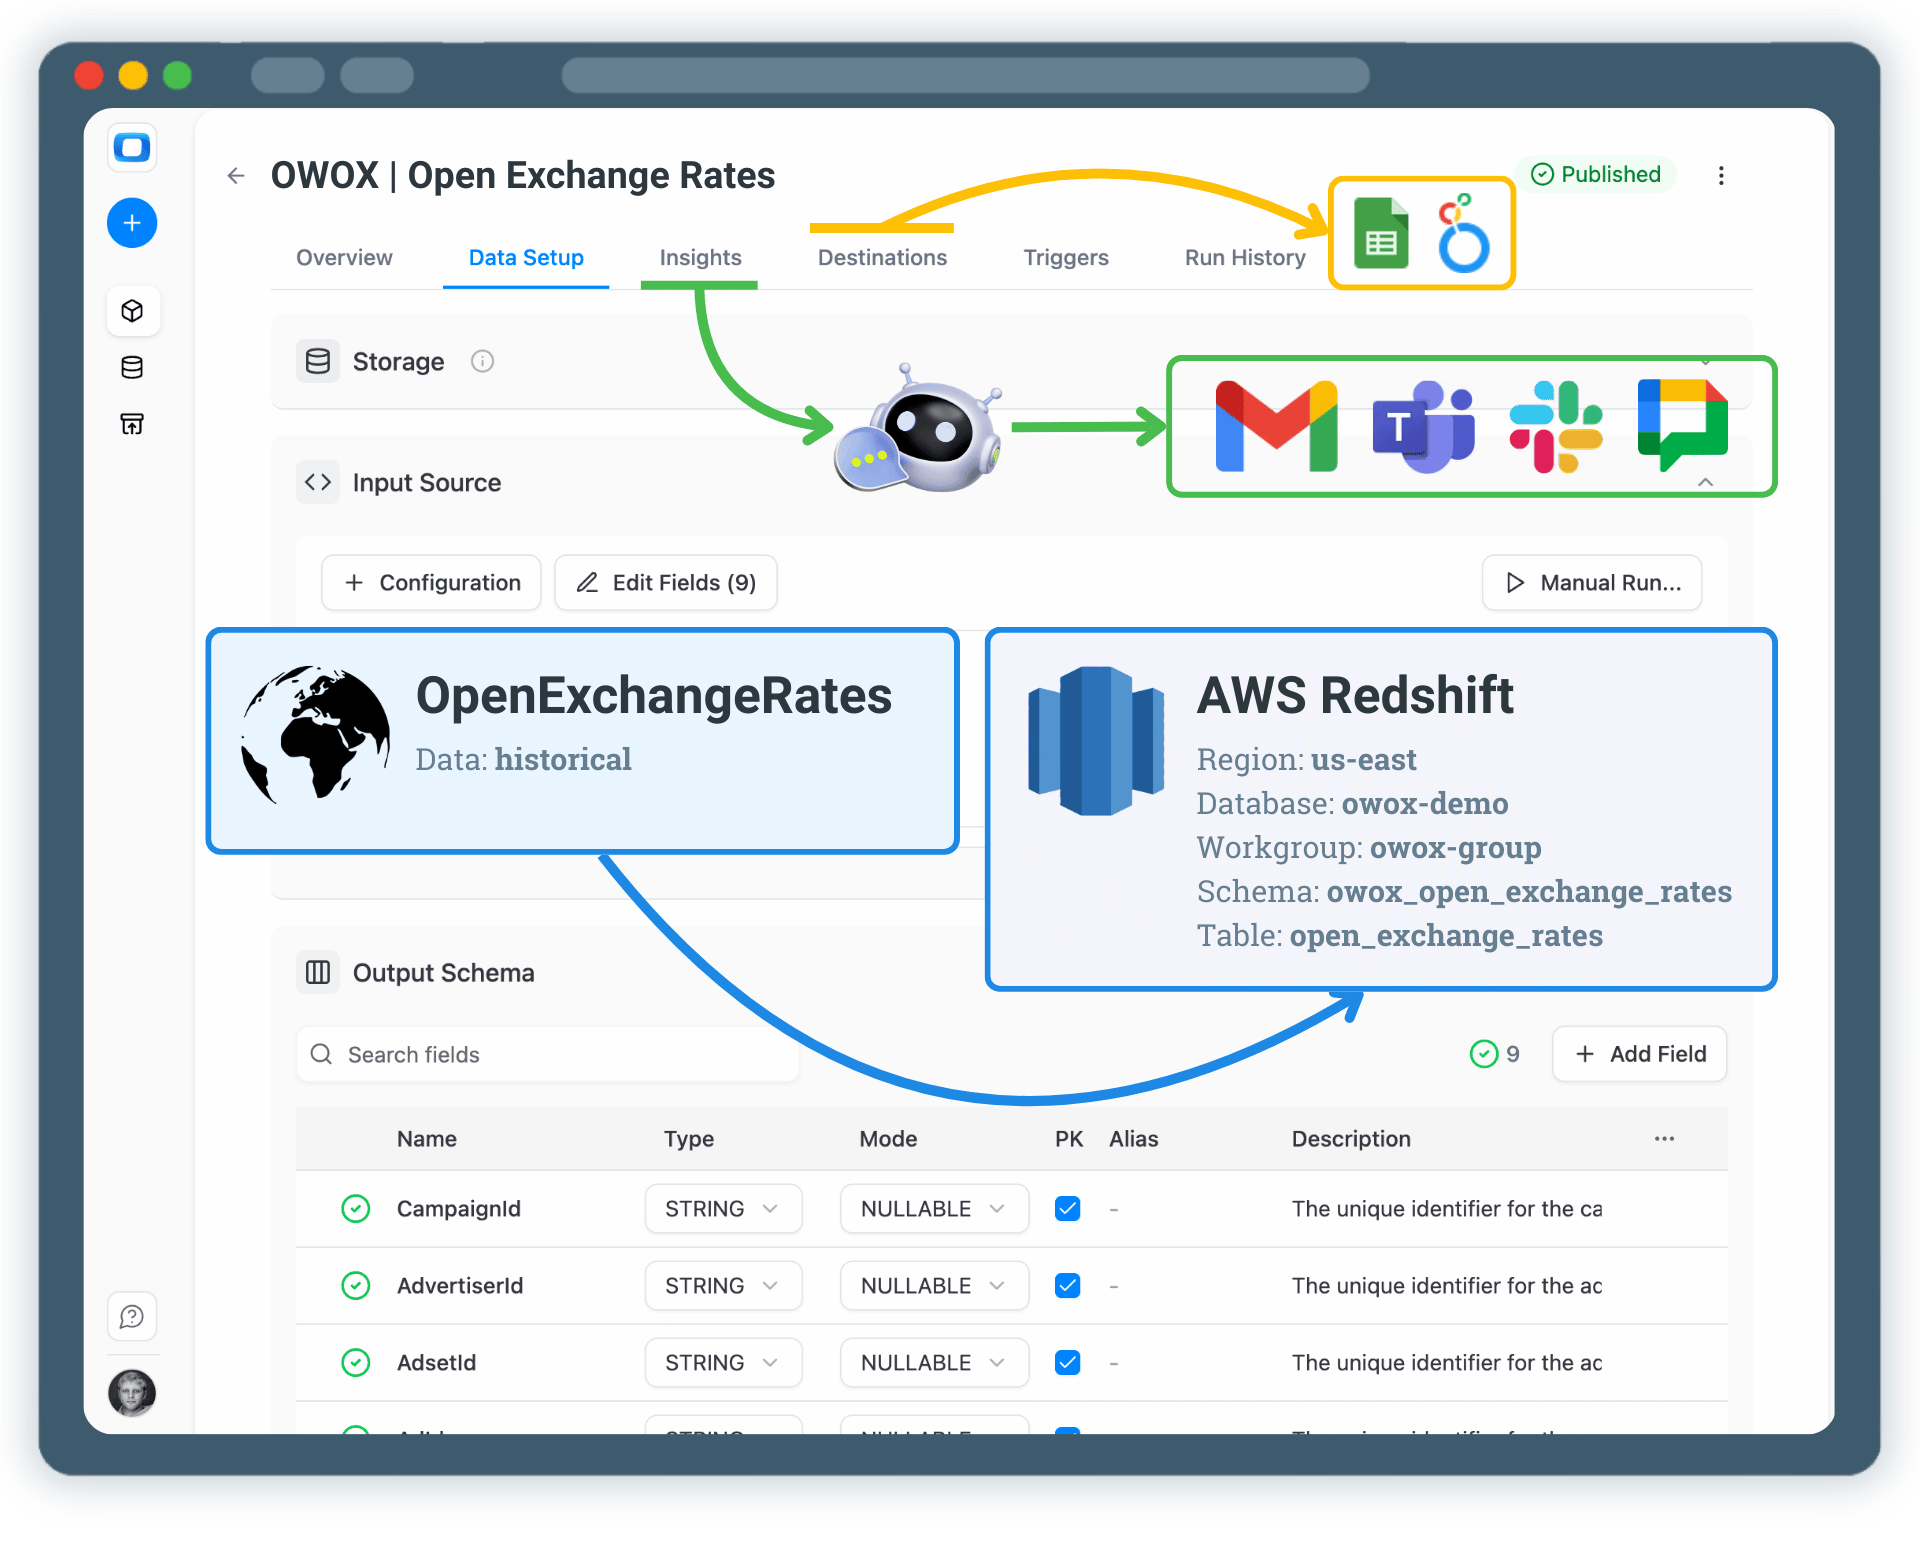
Your exchange rate data is now available in AWS Redshift.

Normalize revenue and cost metrics across currencies
Join exchange rates with ads, sales, or finance datasets
Enable AI Insights for alerts or currency fluctuation summaries
Step 5: Use Exchange Rates Data Across BI Tools & AI Insights
Social proof

Every claim has a receipt.

Stats with comment threads attached — like a colleague verifying your numbers in a shared sheet.

170,000
Users on OWOX Platform — and growing 40% year-over-year.
B2
cell "users on platform"
SM
Sarah M.
Head of Analytics, Retail
3d ago

We migrated 200+ reports from Looker to OWOX Data Marts. Our team now self-serves without filing a single Jira ticket. Easily the best infrastructure decision we made this year.

✓ Verified
12 min
Median time-to-first-report for new OWOX users. No onboarding calls required.
C4
cell "time to first report"
DL
David L.
Data Lead, SaaS
1M ago

Connected BigQuery, set up 37 data marts, built a data model and had live reports in Sheets in under 15 minutes. My team thought I was joking when I showed them how they can now get live reports right in their sheets.

✓ Verified
Self-service analytics

Turn Exchange Rate Data into Business Decisions

Google Sheets were never designed to be a system of record. With OWOX Data Marts, Sheets becomes a trusted analysis layer — powered by governed data marts defined upstream in your warehouse.

Business teams keep the flexibility they love
Data teams retain control over logic and definitions
No more fragile joins duplicated across spreadsheets
See how it works