All resources
Most specialists start getting to know analytics and reports with Google Analytics. We decided to figure out how the marketer could find answers to business questions using GA reports. In our article, we’ve collected 12 main reports from 4 sections of Google Analytics and arranged them in the same order as in the service. Setting up these Google Analytics reports will help you to analyze the effectiveness of advertising campaigns and tell you how to find risks and growth zones.
Want to know how to configure an efficient web analytics system using the example of the OWOX BI service? Try the service for free and find out how a well-tuned analytics system should work:
If you want to find out where your customers come from to optimize your ads campaigns, develop the website, and email marketing, you need this report. These primary dimensions are available in the Location report:

The report shows a map of the world by default, and color saturation demonstrates the proportion of sessions from different regions. There is also an Explorer tab in the report.

If you need data for more detailed targeting, the Location report is what you need. For example, you click on the country name and get detailed data on traffic from that country.
Useful links:
Use the Mobile report to check from which devices the traffic comes.

With this report, you can check how the time of average session duration and bounce rates vary in the user’s device. If the bounce rate on some device is higher than the average, it’s worth checking the display correctness and your website load speed.
Find out what pages have a low conversion rate and make sure your website displays on various mobile devices accurately.
Useful links:
This report is useful for channel traffic analysis and channel comparison. Like other standard reports, the Channels report consists of a graph and a data table. The table collects data for all incoming traffic sources:

If you want to see statistics on a single channel, click it in the table.
Useful links:
This report is one of the top reports available in Google Analytics. It shows all incoming traffic to the website in sources and channels.

Google Analytics detects most sources and channels, such as direct traffic, organic search, or transitions from other websites automatically.
However, it doesn't work correctly with all sources and channels. Sometimes, if the source is undefined, you see not set value. If, for example, traffic comes from the email, and no UTM tags applied for this campaign, Google Analytics sets the value to email/referral. Accordingly, if you don't want to rely on a standard source/medium separation, you should always use your UTM tags.
Useful links:
The primary dimensions of the report are:

With the help of this report, you can:
Useful links:
Also, it’s necessary to add cost and revenue data to the calculations, to calculate the ROAS (main metric for channel performance). That’s the only way to make the right conclusions!
All Campaigns report allows you to evaluate the effectiveness of advertising campaigns marked with UTM tags.

You can use this report to compare campaigns and evaluate their effectiveness. The primary dimensions are campaign, source, medium, or source/medium.
If you want to view detailed information about a specific campaign, click on it.

Useful links:

In the Cost Analysis report, you can view the cost and profitability of advertising by different channels, making it one of the essential reports in a marketer’s work. However, by default, all indicators except Google Ads have zeros. But if you import cost data using OWOX BI, real values appear in your report.

If you want to analyze ad campaigns that belong to the same traffic source, choose, for example, google/cpc. The table displays data for all loaded campaigns:

As mentioned above, you have to set up the cost data import from the advertising services you use, to ensure that this report works correctly. You can add data to the Cost Analysis report from:
The last option is the most convenient. You adjust data import for once and then the service transfers cost data automatically, checks data for mistakes, and converts it into the chosen currency.
Useful links:
You can use Behavior reports to analyze how users navigate through the website. You need a Landing Pages report to understand what website pages bring you lots of visitors.
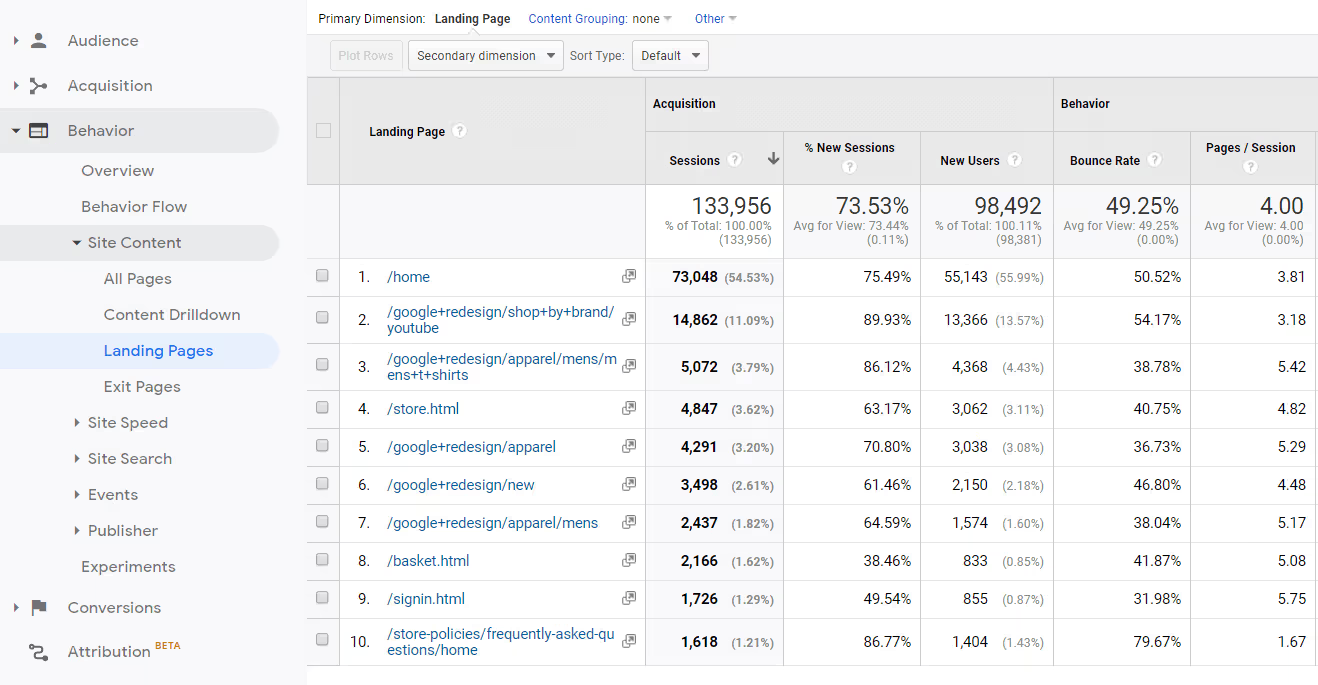
The Landing Pages report helps you to:
Useful links:
Many different interactive elements enrich websites. Like if you press a button on the page, the video starts loading. However, Google Analytics doesn’t know how to track such actions automatically. That’s why you need to configure events to track clicks on different items on your site. It helps you to know exactly how visitors use the content on your website.You can use the Events reports to track configured events in the view.The primary dimensions of this report are:


In Google Analytics, the new user, by default, counts as the new event.
Events can include both watching videos on the page and adding an item to the cart. You can read more about events and their settings from the links below.
Useful links:
If you want to find out what channel has led a client to conversion, use reports in the Multi-Channel Funnels section.

These reports let you see the path to the goal. Google Analytics tracks visitors who have been on the site more than twice and eventually made a conversion.
The Assisted Conversions report shows how many conversions specific channel was associated with: it didn’t lead the customer straight to the conversion, but it was in the chain. This data is useful for evaluating marketing channels.
Useful links:
The Top Conversion Paths report helps you to understand how many conversions have been obtained through a specific channel. Thus, you can evaluate the most efficient paths to conversion and optimize these channels.

Using the settings from above, you can select which conversions/goals to consider and determine the length of the sequence. You can also choose a type of the conversion window, and the period from 1 to 90 days (by default, Google Analytics uses 30 days).

Useful links:
This report shows the number of interactions before conversion. It includes the total number of conversions, and the number of channels participated in the conversion, and the conversion value.Most people visit your site more than once before buying something. This report helps you to understand how many times a customer interacts with your brand to make a conversion.

Note: Google Analytics selects all your conversions for the calculation by default. So don’t forget to remove the unessential conversions. It’s better to choose the All type instead of the Google Ads type (this option is suitable only for re-marketing based on this source).
Useful links:
This report compares the distribution of value by applying the logic of the default and customized attribution models.

You can compare two or three models at a time. The Model Comparison Tool helps you to evaluate how different models determine the value of marketing channels.

You can also edit existing attribution models using the editor window.

After creating your attribution model, you can also download it to Google Analytics Solutions Gallery.
Of course, it’s necessary to select a model that includes all the peculiarities of the company to estimate the effectiveness of marketing channels correctly. How can you make it?
First, you should learn more about the available attribution models. For this purpose, we have prepared a detailed review and comparison of attribution models in our blog.
Important! As announced by Google, the first click, linear, time decay, and position-based attribution models will be going away starting in July 2023. If you need these attribution models and don't want to give them up, you can continue to use them in OWOX BI. With OWOX BI you can get those simple models in a few clicks.
Second, if you want to evaluate each customer step in the funnel with consideration of the offline sales and refunded orders, you can try the Machine Learning Funnel Based Attribution by OWOX.
The ML Funnel Based Attribution by OWOX works with merged data that includes user behavior data from Google Analytics, data from advertising services, and CRM data. It allows you to configure funnel steps differently for different companies.
Useful links:
Short conclusionsWe’ve studied the most relevant reports for a marketer to make decisions in everyday work. The main trick about Google Analytics reports is to find answers to business-oriented questions of revenue and costs.If you have any questions, ask in the comments below:)And if you want to learn more about Google Analytics and other analytics tools, subscribe to our newsletter. Every month you’ll get useful tips for modern marketers and analysts.


