OWOX Pipeline helps Contentmart improve customer experience & engagement
Cohortuser engagement optimized via analysis

Goals
Launching a new website is an acute challenge for most companies. They strive to enhance the user experience on their website, provide their customers with a seamless journey through the sales funnel and improve the customer retention rate. A company has to decide if certain improvements are successful or not. There are quite a few hypotheses for improving the website, and since the project is new, it’s still unclear which ones to accept. The decisions have to be made quickly, so they can only be based on short-term data.
With challenges like these, it’s important to remember that the increase in user engagement can be influenced by a variety of factors. Such growth metrics as, Daily / Weekly / Monthly Active Users, etc… are not just influenced by the quality of the website (or changes to the website), but also by the marketing of the website. In this case, cohort analysis cohort analysis is the best way to measure the effect of website improvements while excluding the effects of marketing.
Contentmart.com, a content marketplace that targets the Indian market, aims to become an automated content marketplace not only within India, but also to expand to other English-speaking countries. That’s why the company needed an analytics system to analyze all the metrics of concern, even at the initial stage of the product launch. This would allow for keeping track of all the key stages of the product improvement process. With the help of Google BigQuery, Google Sheets and the OWOX Pipeline, companies can quickly make the right decisions on improving the functionality of the website and detect “bottlenecks” in the sales funnel.
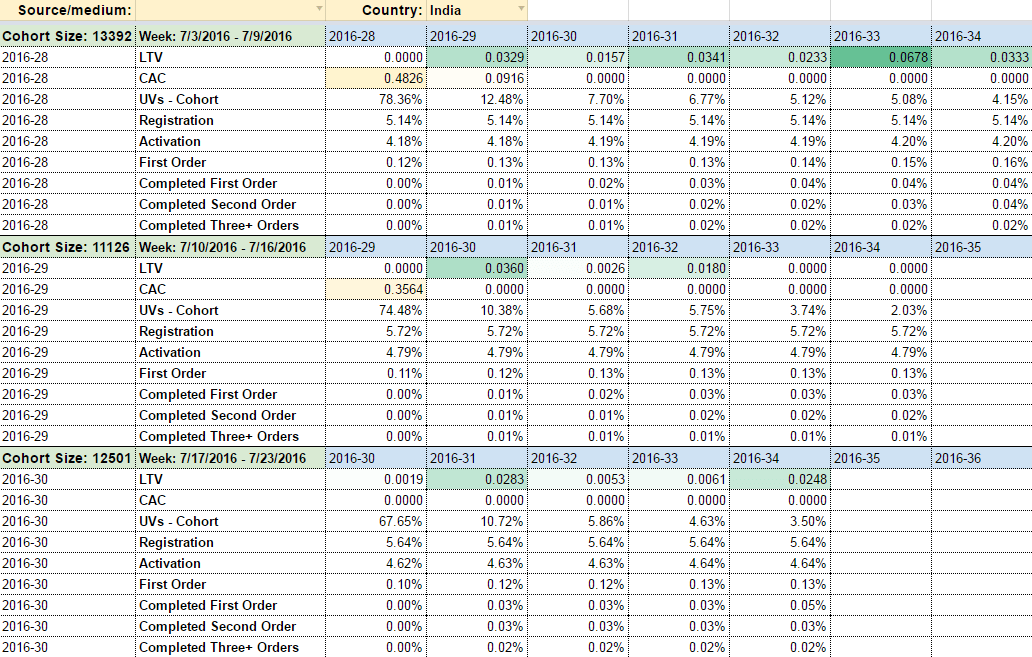
The cohorts were created on the basis of first-visit data about the country, the source and the date of the first visit. It was important to visualize the results of the funnel analysis as a convenient table and enable the company to see the desired metrics. In this case, the metrics were both the channel that attracted users to the website, and the country where users in the cohort belonged to. The cohorts were built on a weekly basis, so that the company could see if the changes made to the website during a week helped improve user experience.
Approach
OWOX recommended monitoring user interactions with the website using Google Analytics + Google BigQuery. During the first stage, Contentmart implemented data collection for all events and page views. The data was collected in Google BigQuery with OWOX Pipeline, as well as in Google Analytics.
At the second stage, Contentmart set up cost data import from advertising services to Google Analytics using OWOX Pipeline.
These steps enabled the company to get real-time, unsampled raw session data that can be easily accessed with SQL-queries to build relevant reports.
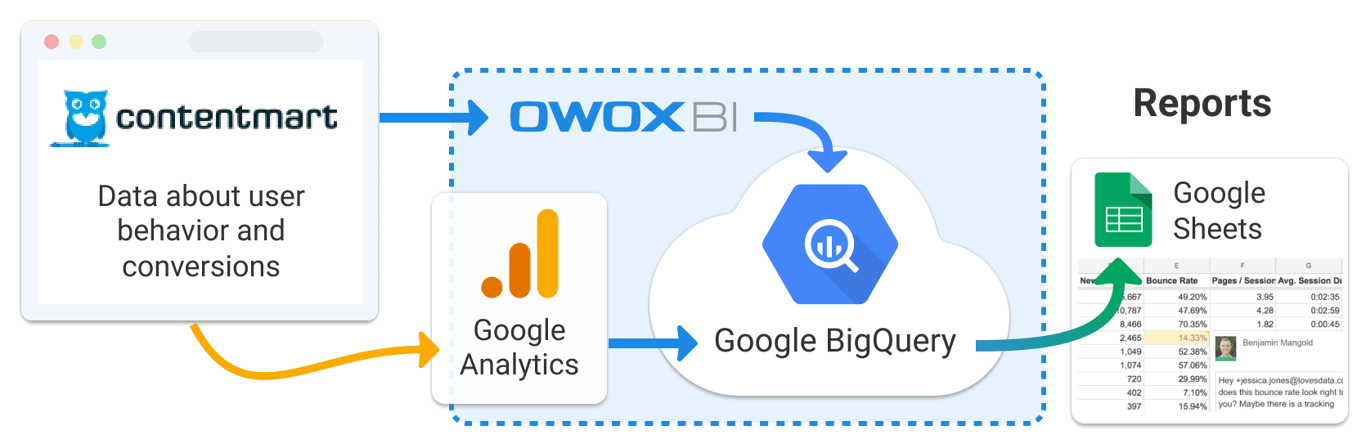
The third stage was to create and visualize reports in Sheets using Google BigQuery Reports Add-on. The implemented queries allowed linking all the website user’s data, both to the media that attracted customers, and to the country from where customers came to register on the website. It wouldn’t be so convenient to implement such linking using only Google Analytics data — with Google Analytics only, one could not obtain all the necessary data in a single report and the needed structure.
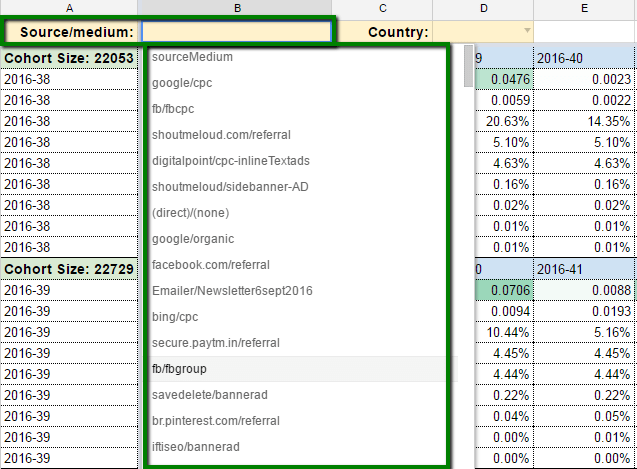
Google BigQuery Reports Add-on automatically imports all the necessary weekly data to Google Sheets to enable building funnels on the basis of cohorts. The OWOX team also suggested a convenient format for the data reports—Contentmart now only needs to filter the report by the medium and the country. The data on cohorts is rearranged with respect to the chosen filters:
At the final stage, Contentmart specialists could see if the website changes (such as introducing new landing pages or redesigning the checkout page) were a success or failure, and then refocus their efforts on attracting customers, with regards to the performance indicators of each channel.
Results
As a result, Contentmart:
- Got the tool to monitor the efficiency of website improvements at the end of each sprint.
- Started optimizing customer acquisition costs to drive more visitors to their website.
- Increased the LTV for major promotional channels.
- Broadened their customer base.
Integrating the analytics solution into our project allowed us to better understand the main problems and bottlenecks of our business. Relevant metrics are among the things without which an online platform simply can not develop properly and quickly. Our goals for analytics are to ensure a deep understanding of our sales funnel from point A to Z, understanding the efficiency of each advertising tool in the context of cohorts, understanding the LTV for each advertising tool and platform as a whole.
Thanks to introducing all metrics systems together with OWOX, we could see all the product bottlenecks and start working on them. Owing to cohort analysis by traffic source, we can clearly understand the returns we’re getting on all our marketing costs. We’ve identified the channels that work best for us, and we’ve abandoned using the rest. By doing so, we were able to cut our marketing budget by almost 50%. Now we also can choose channels more effectively in the future.
We thank the OWOX team for working with us throughout the process, professionally and patiently.
Anton Rublevskiy, CEO ContentMart
OWOX Data Marts
See your first report built in real time. 15 minutes.
- Connect your data warehouse
- Pick your metrics
- Get a live Google Sheets report
In the time it takes to write a ticket. Then imagine never writing that ticket again.
Book a DemoWe'll use your actual use case
Turn your data into decisions.
Governed data marts give you the clean foundation ML needs to actually work.
- No AI hallucinations
- Analyst-governed definitions
- Every number traces to SQL