CRM says one thing. Marketing says another. Finance has a third version. OWOX joins your pipeline, attribution, and revenue data in one governed library — so every team pulls the same numbers. Your sales team self-serves in Google Sheets. AI delivers forecast briefs on schedule.

Sales, marketing, and finance each have their own version of pipeline, attribution, and revenue. Your forecast lives in a spreadsheet nobody can audit. And when the board asks "are we going to hit the number?" — you’re not sure which pipeline to believe.
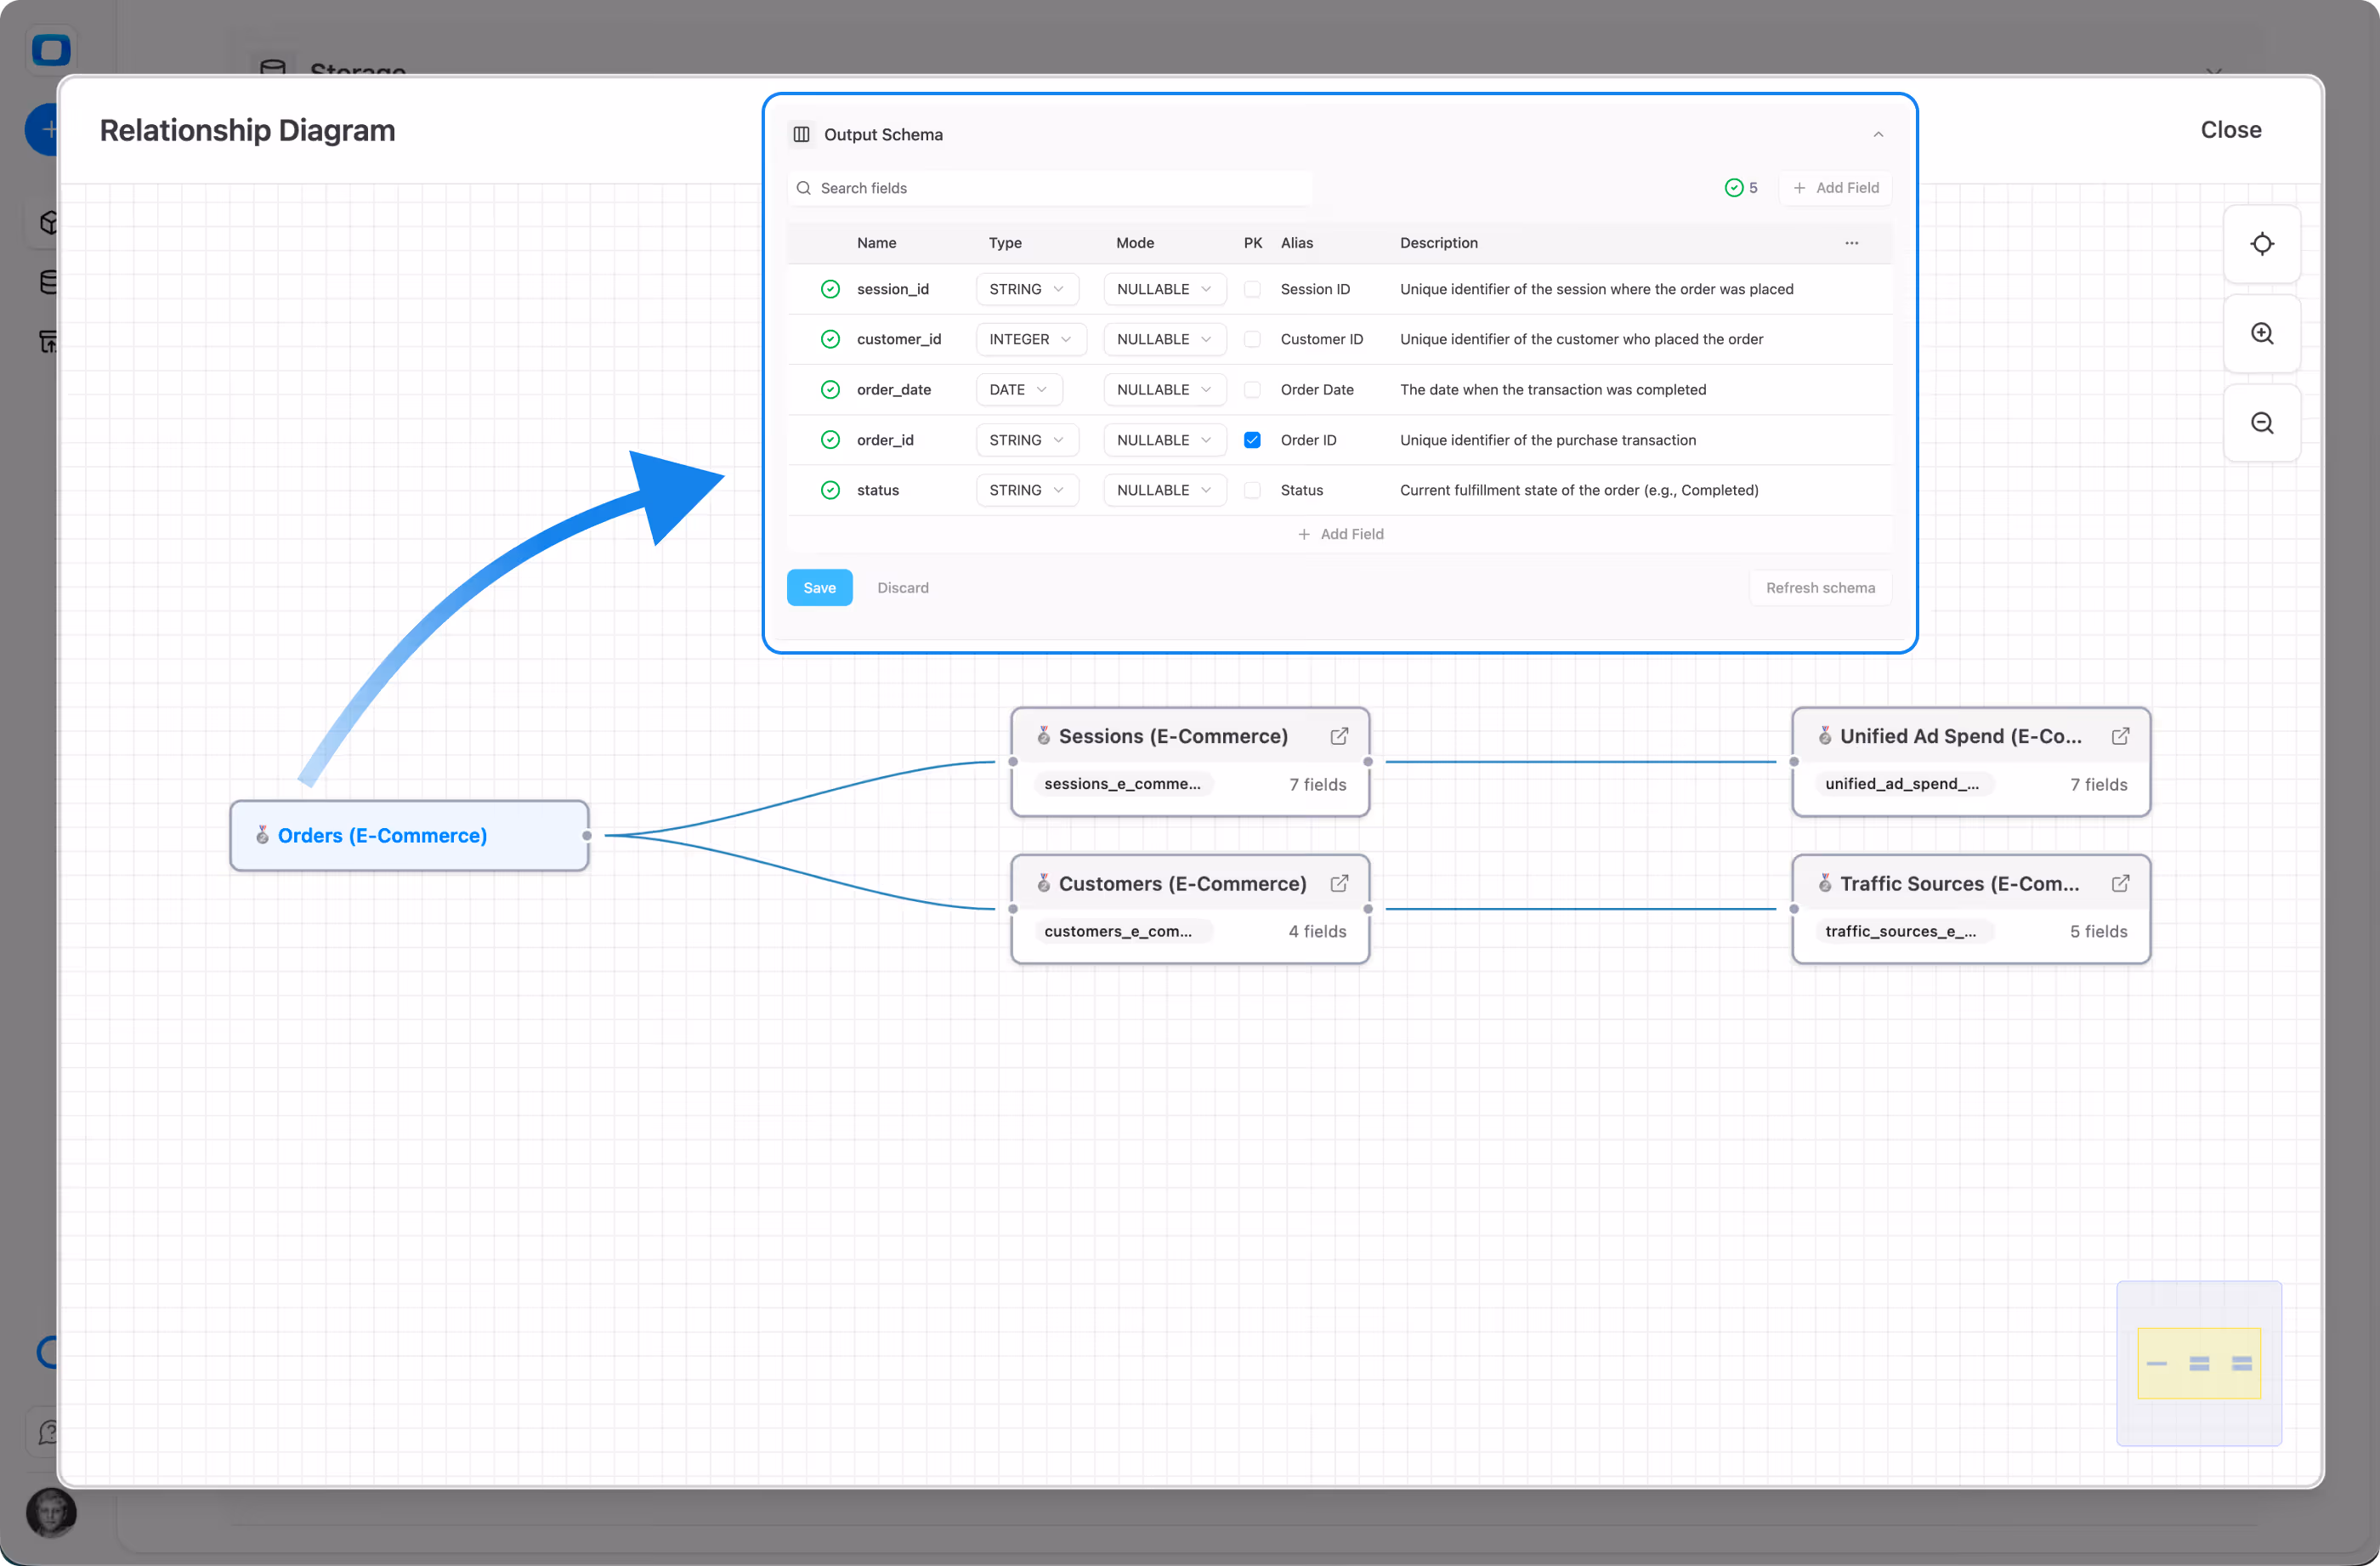
Pipeline numbers reconcile because CRM, marketing, and revenue data pull from the same governed source.
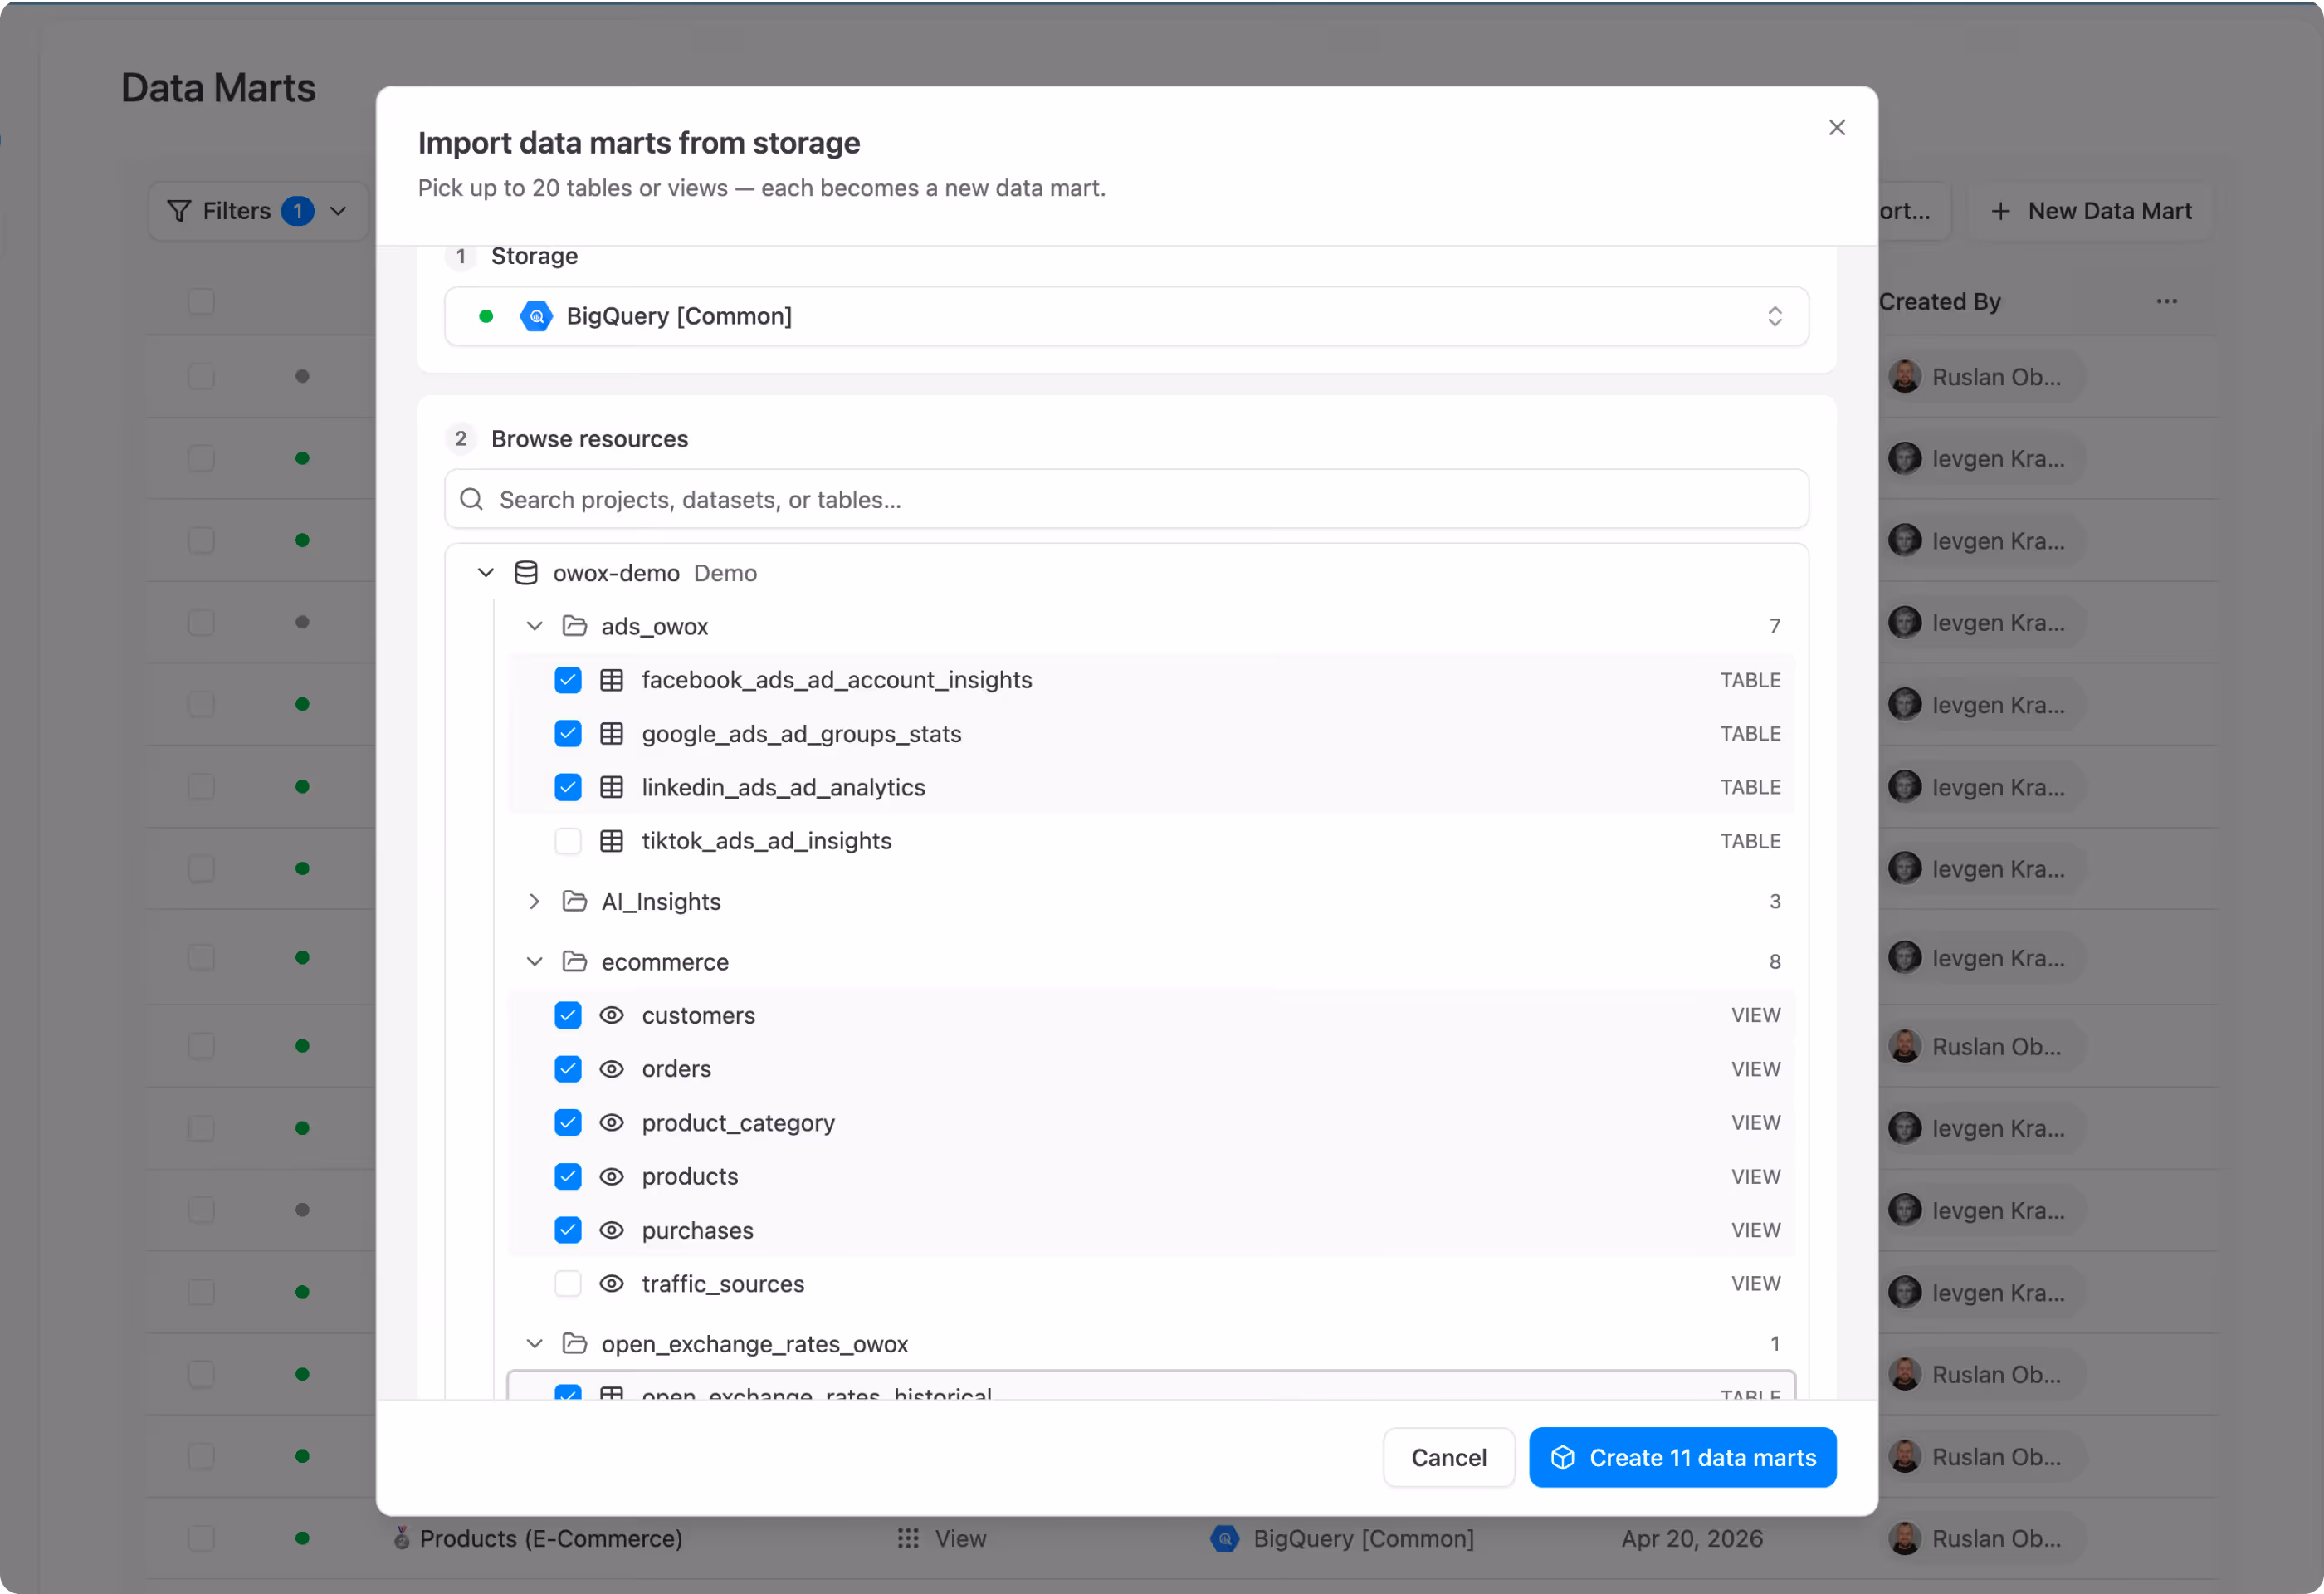
Get started free →Your RevOps team joins CRM, marketing, and revenue data in the warehouse and publishes it as a governed library. One definition per metric. One source of truth.


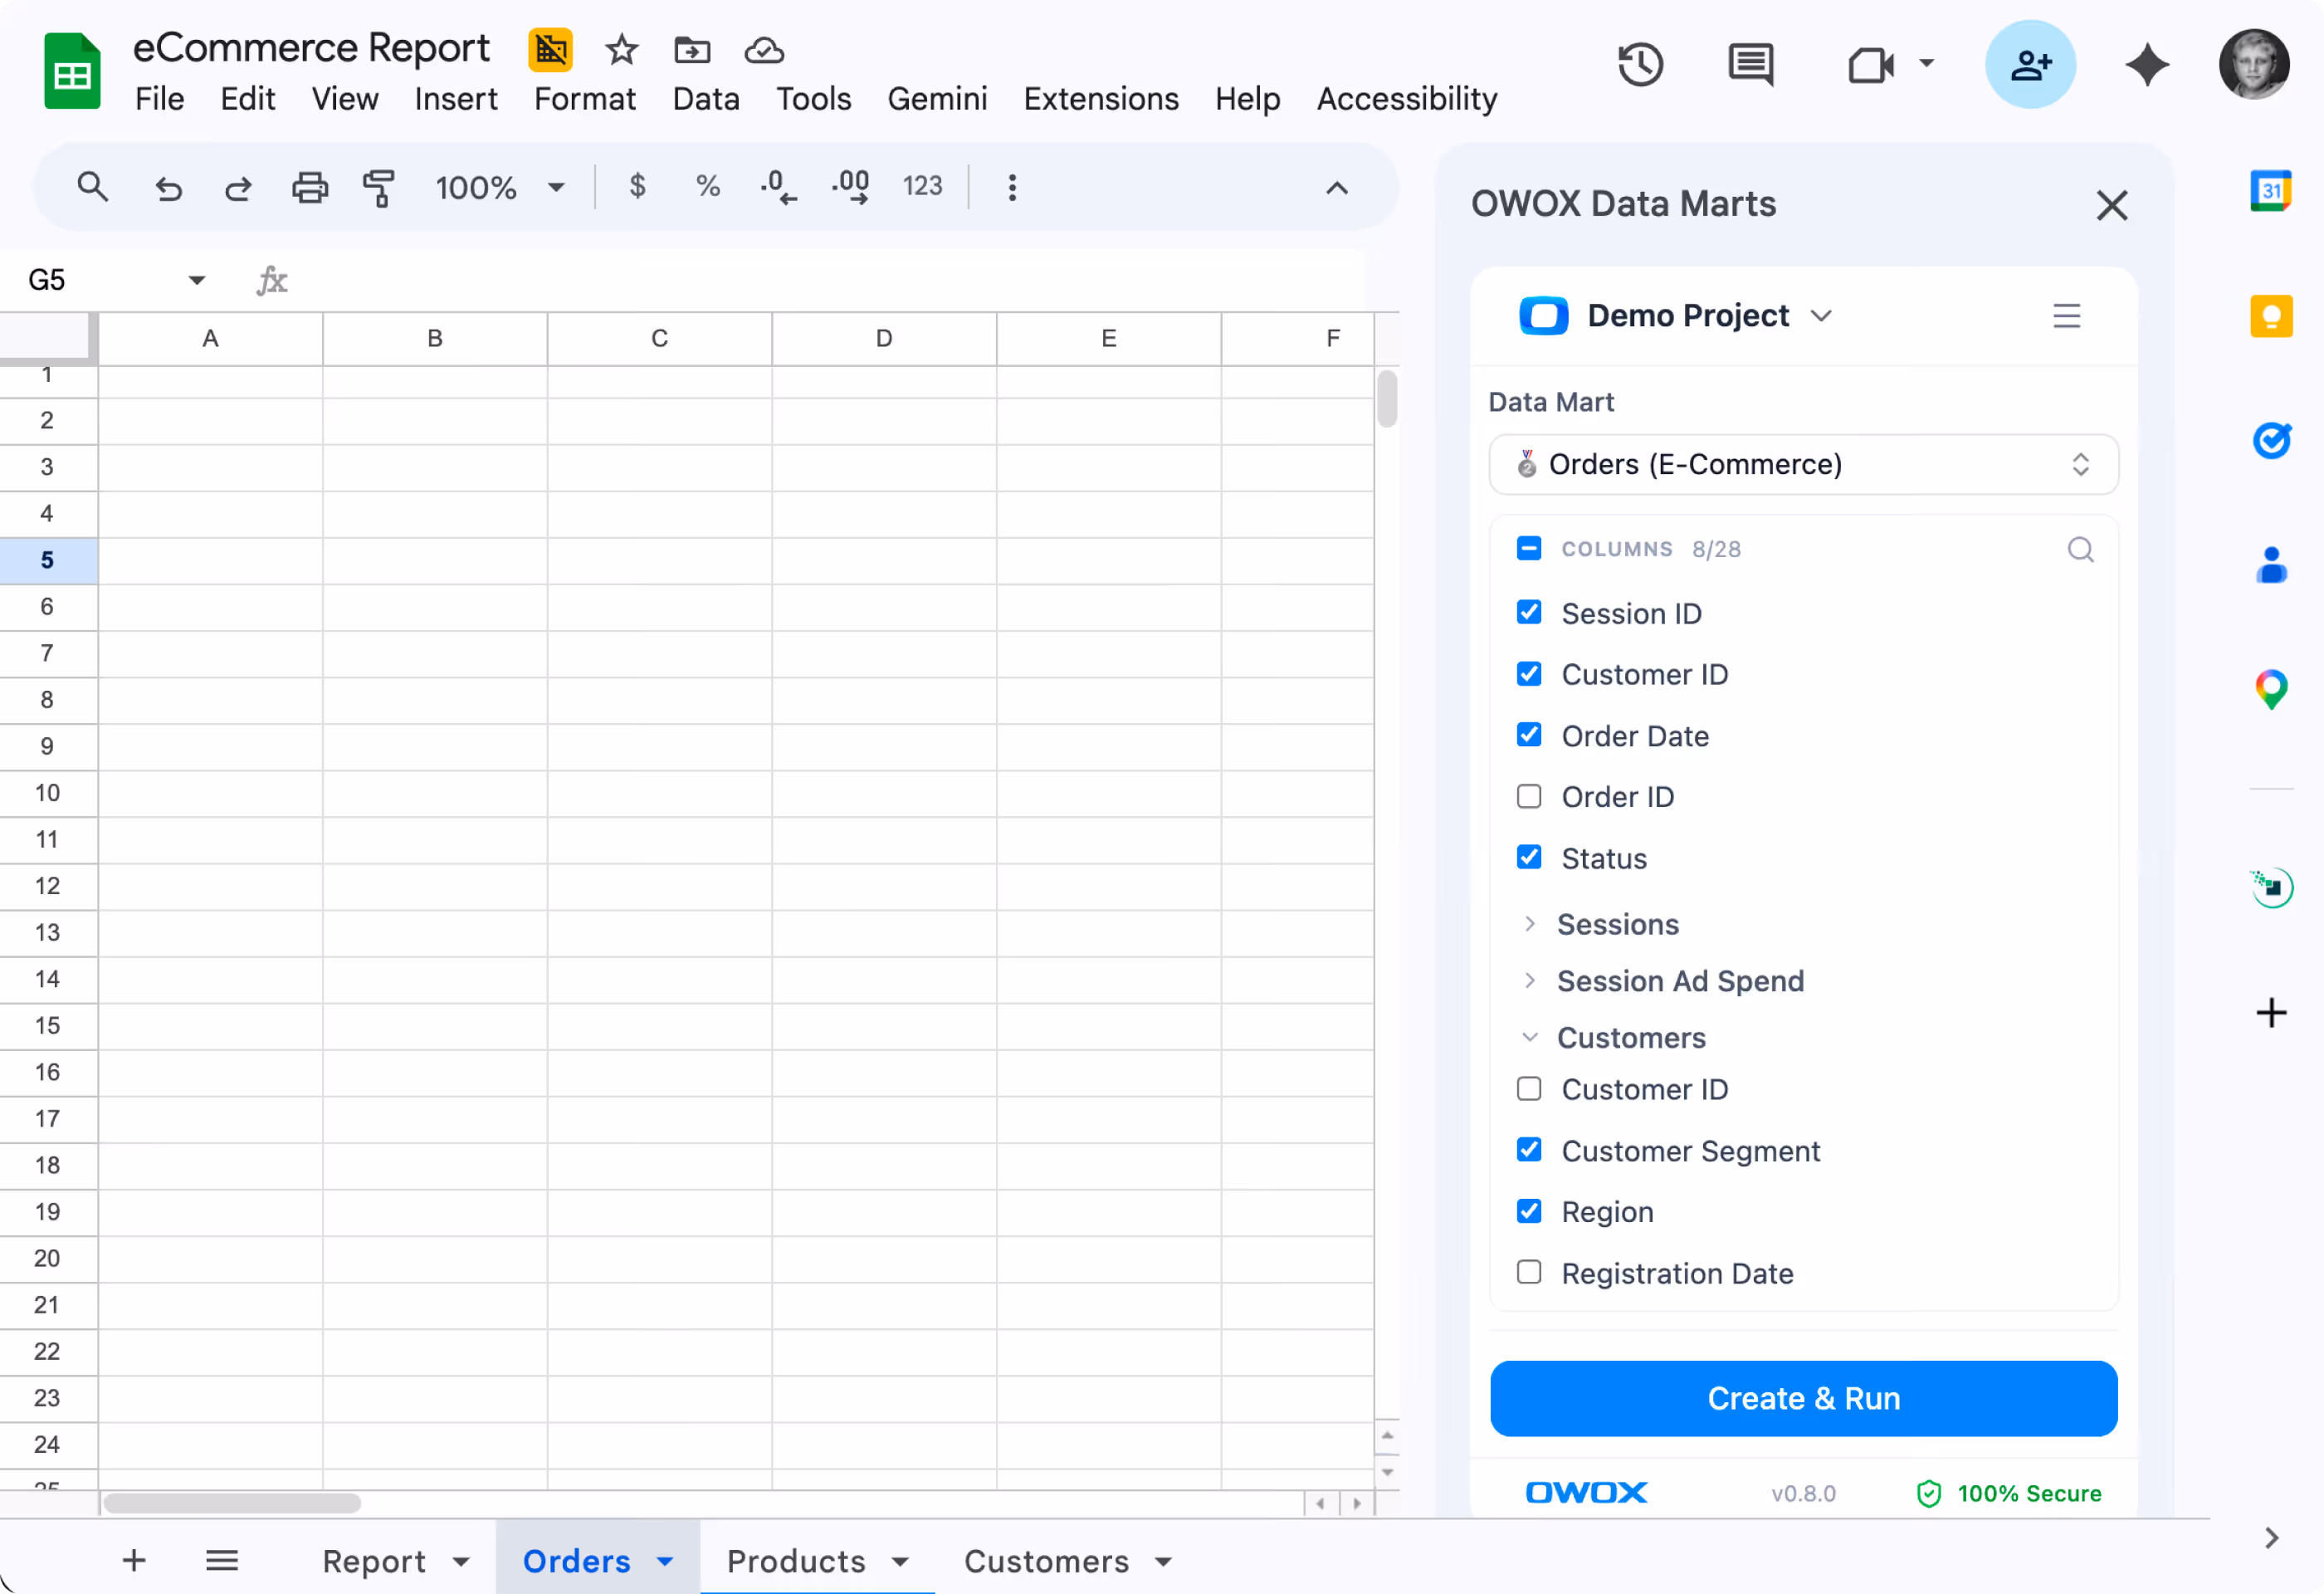
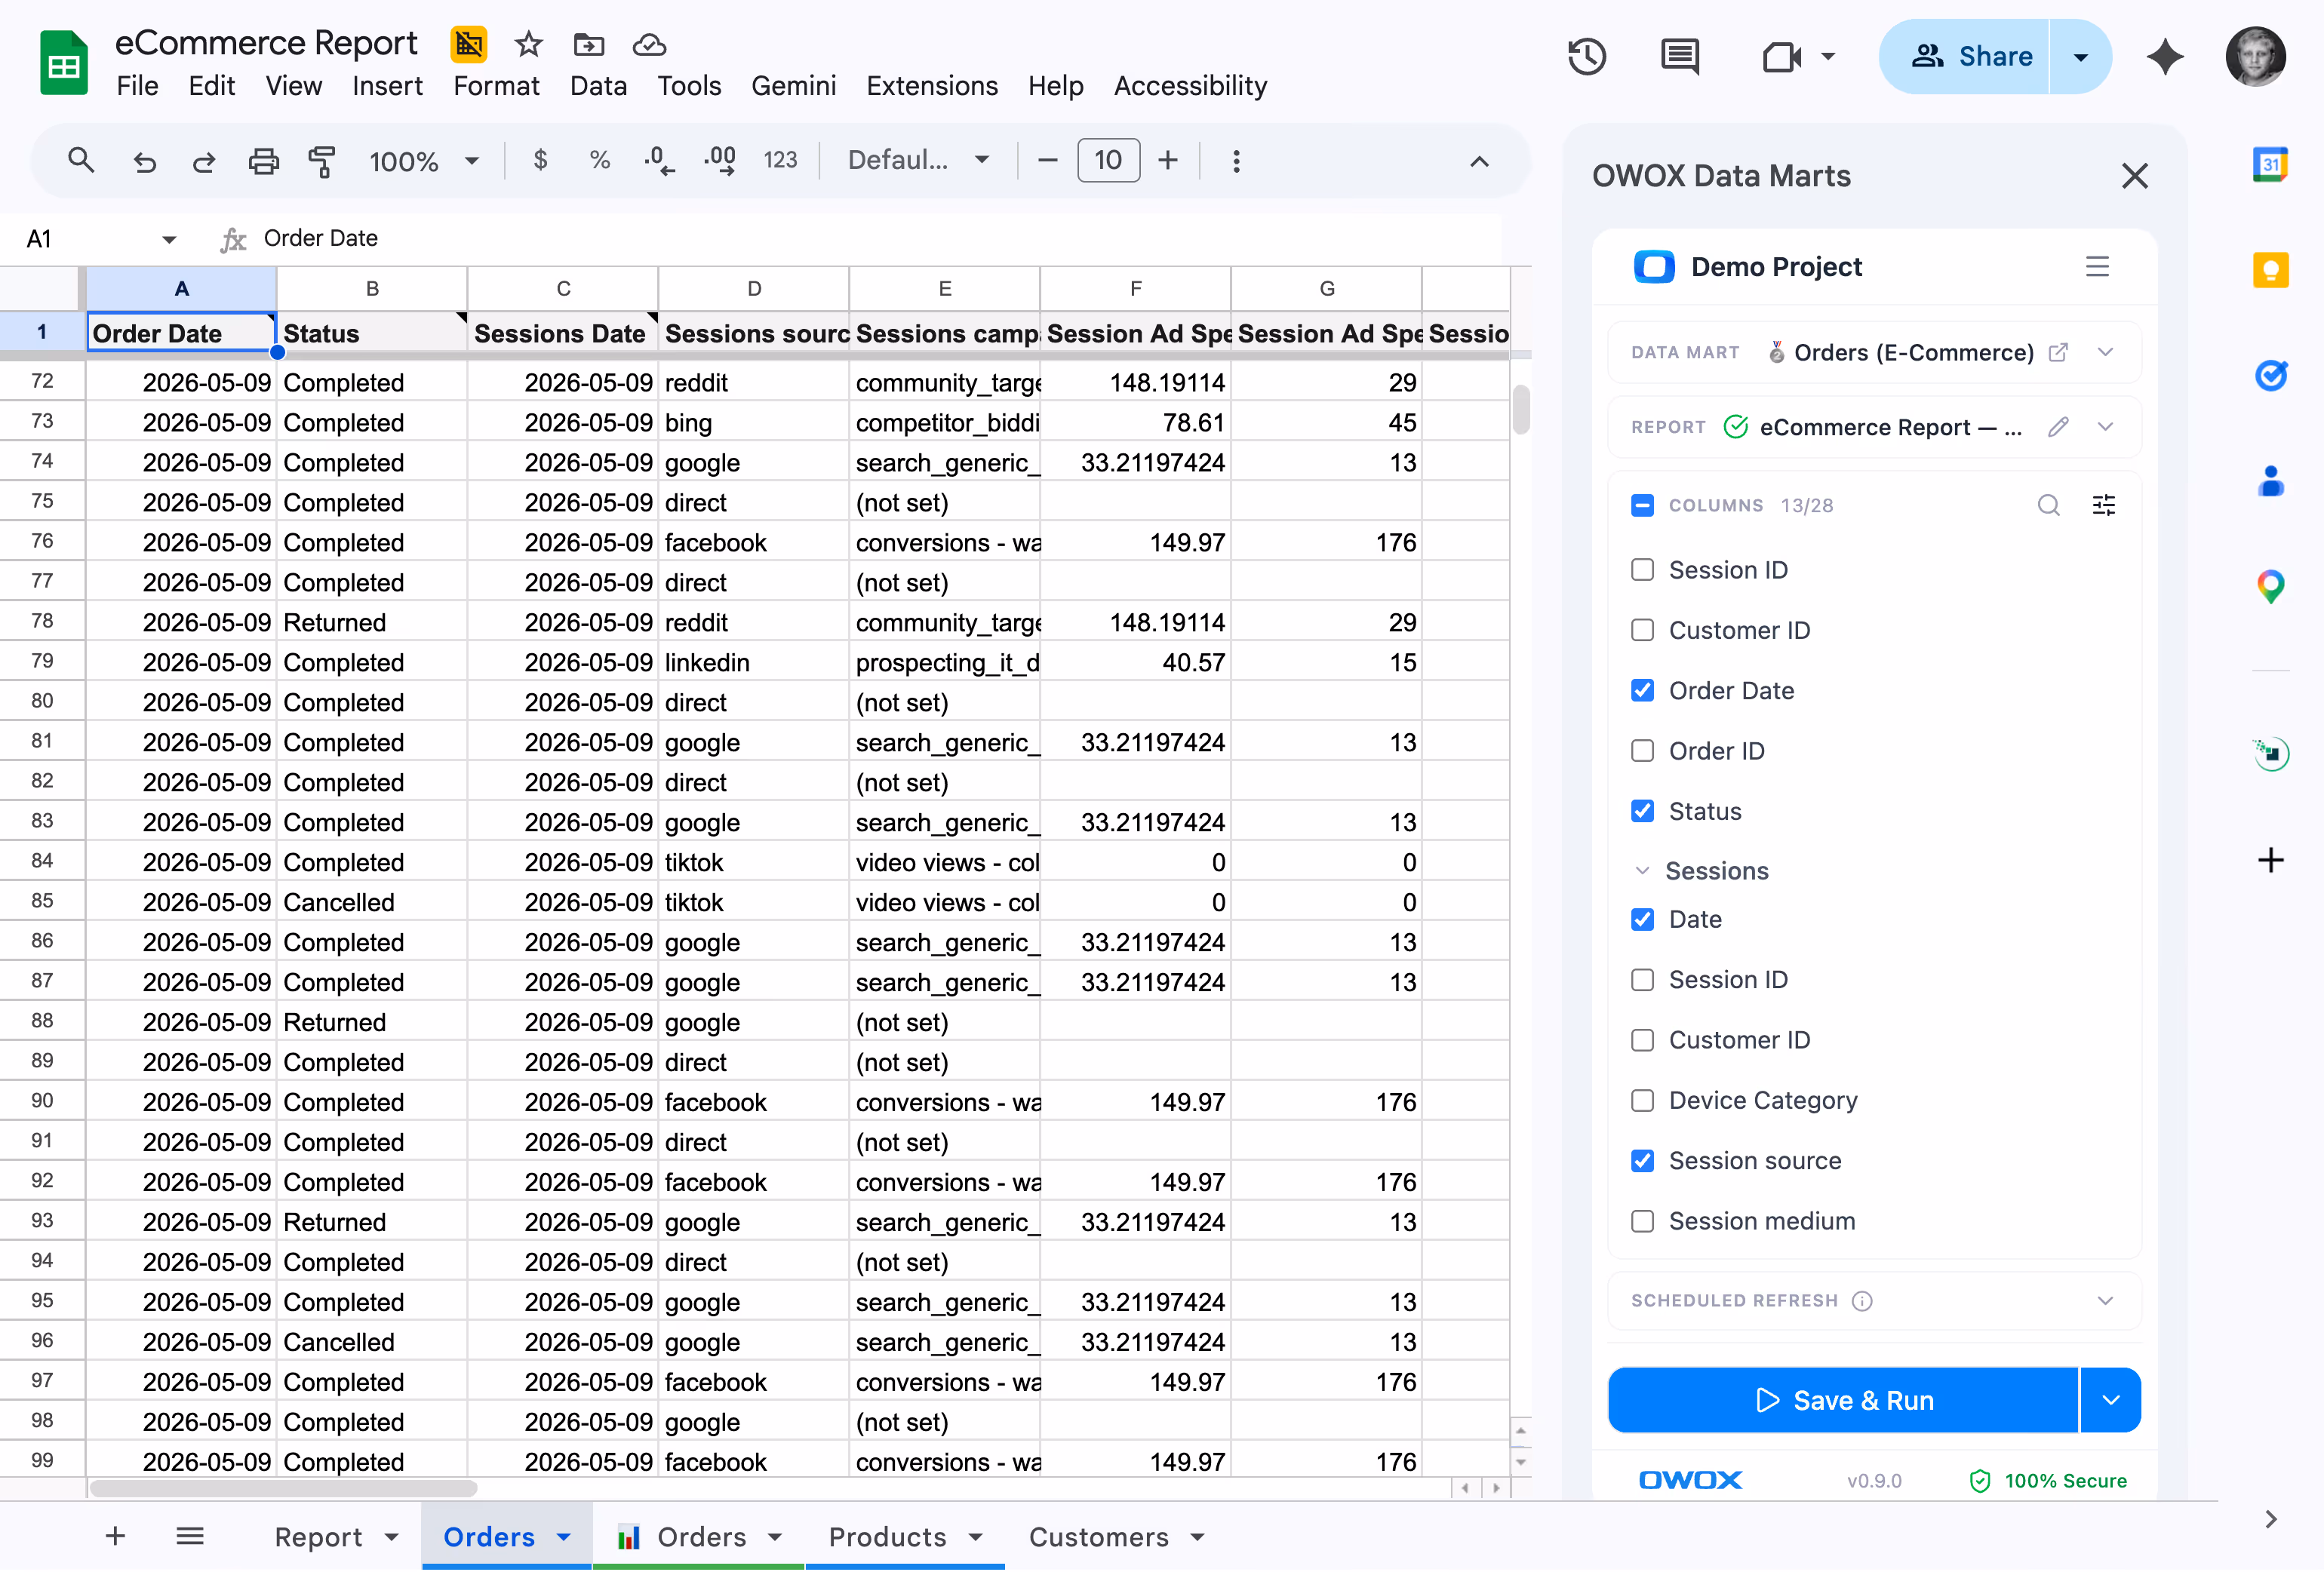
The OWOX sidebar puts the pipeline library inside Google Sheets. Your sales managers browse, join, filter by region, and refresh. No RevOps in the loop.

Insights turn your pipeline Data Marts into recurring sales narratives delivered on schedule. AI writes the summary. Every metric is deterministic SQL.


Send this to your RevOps lead. They’ll join CRM, marketing, and revenue data. Monday pipeline reviews finally use numbers everyone agrees on.
Your RevOps team builds the library. Your sales org self-serves. AI delivers pipeline intelligence. The reconciliation meetings end.
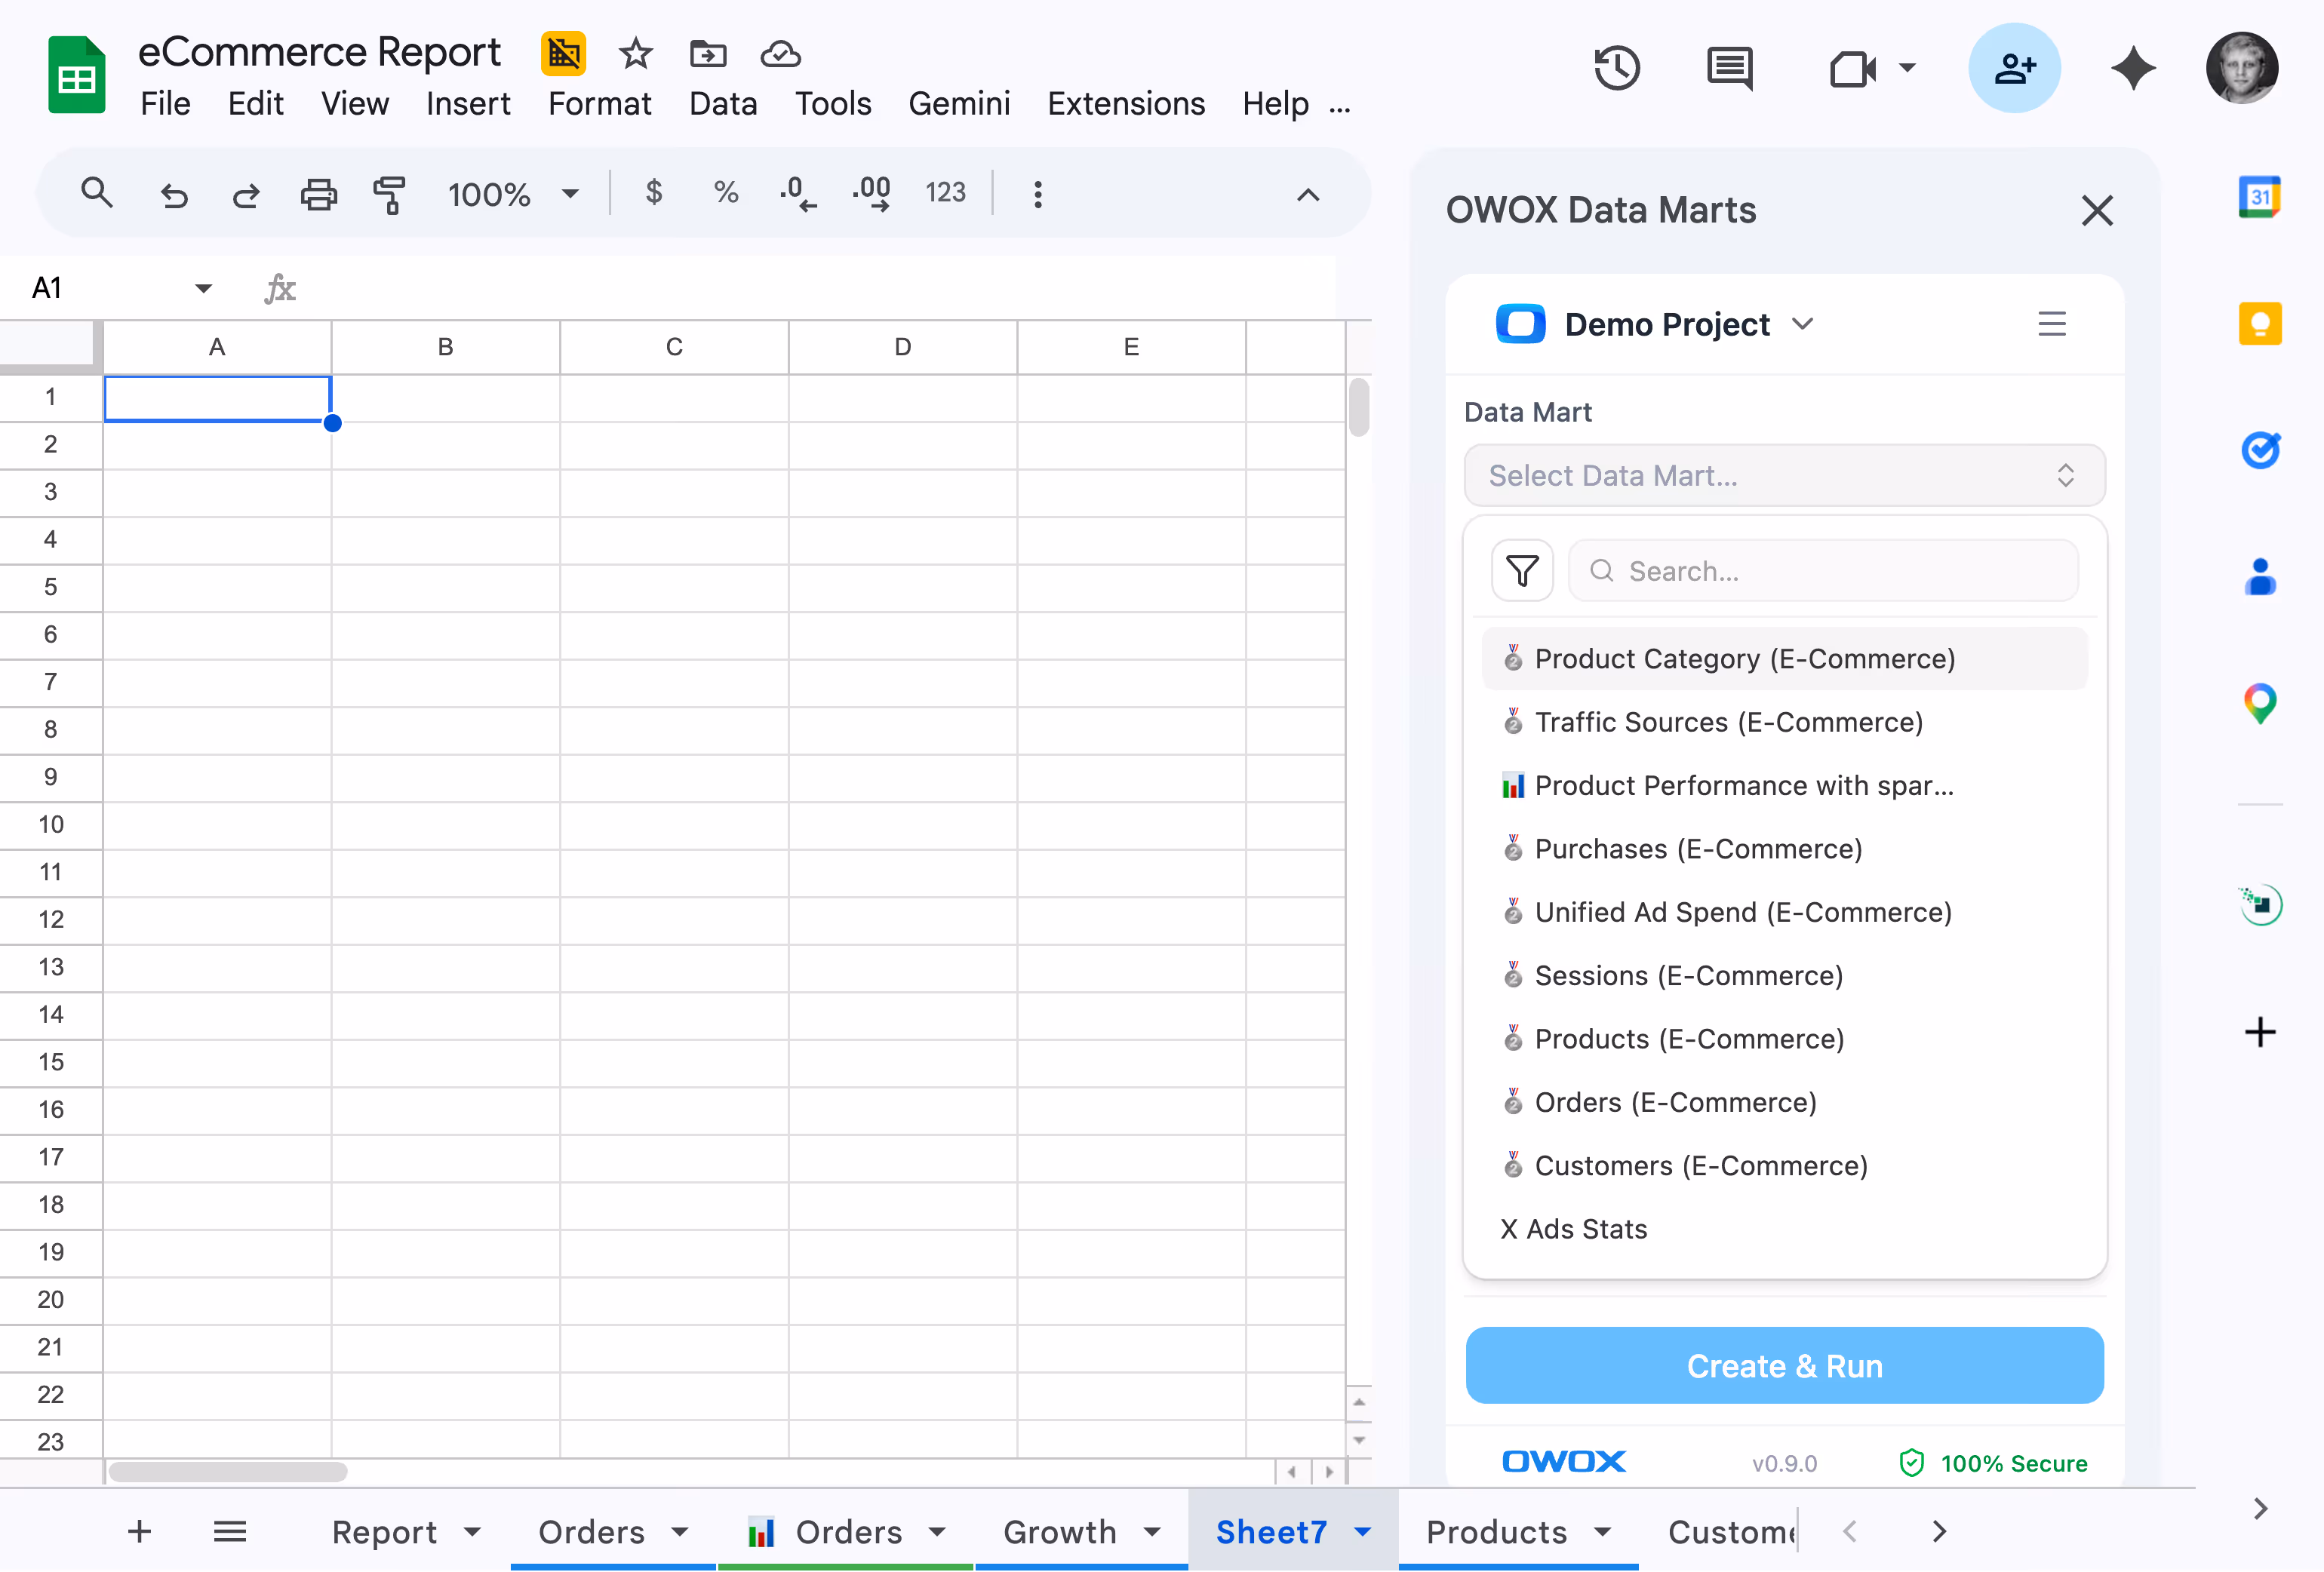
CRM, marketing, and revenue data joined and published as governed Data Marts. One definition per metric.

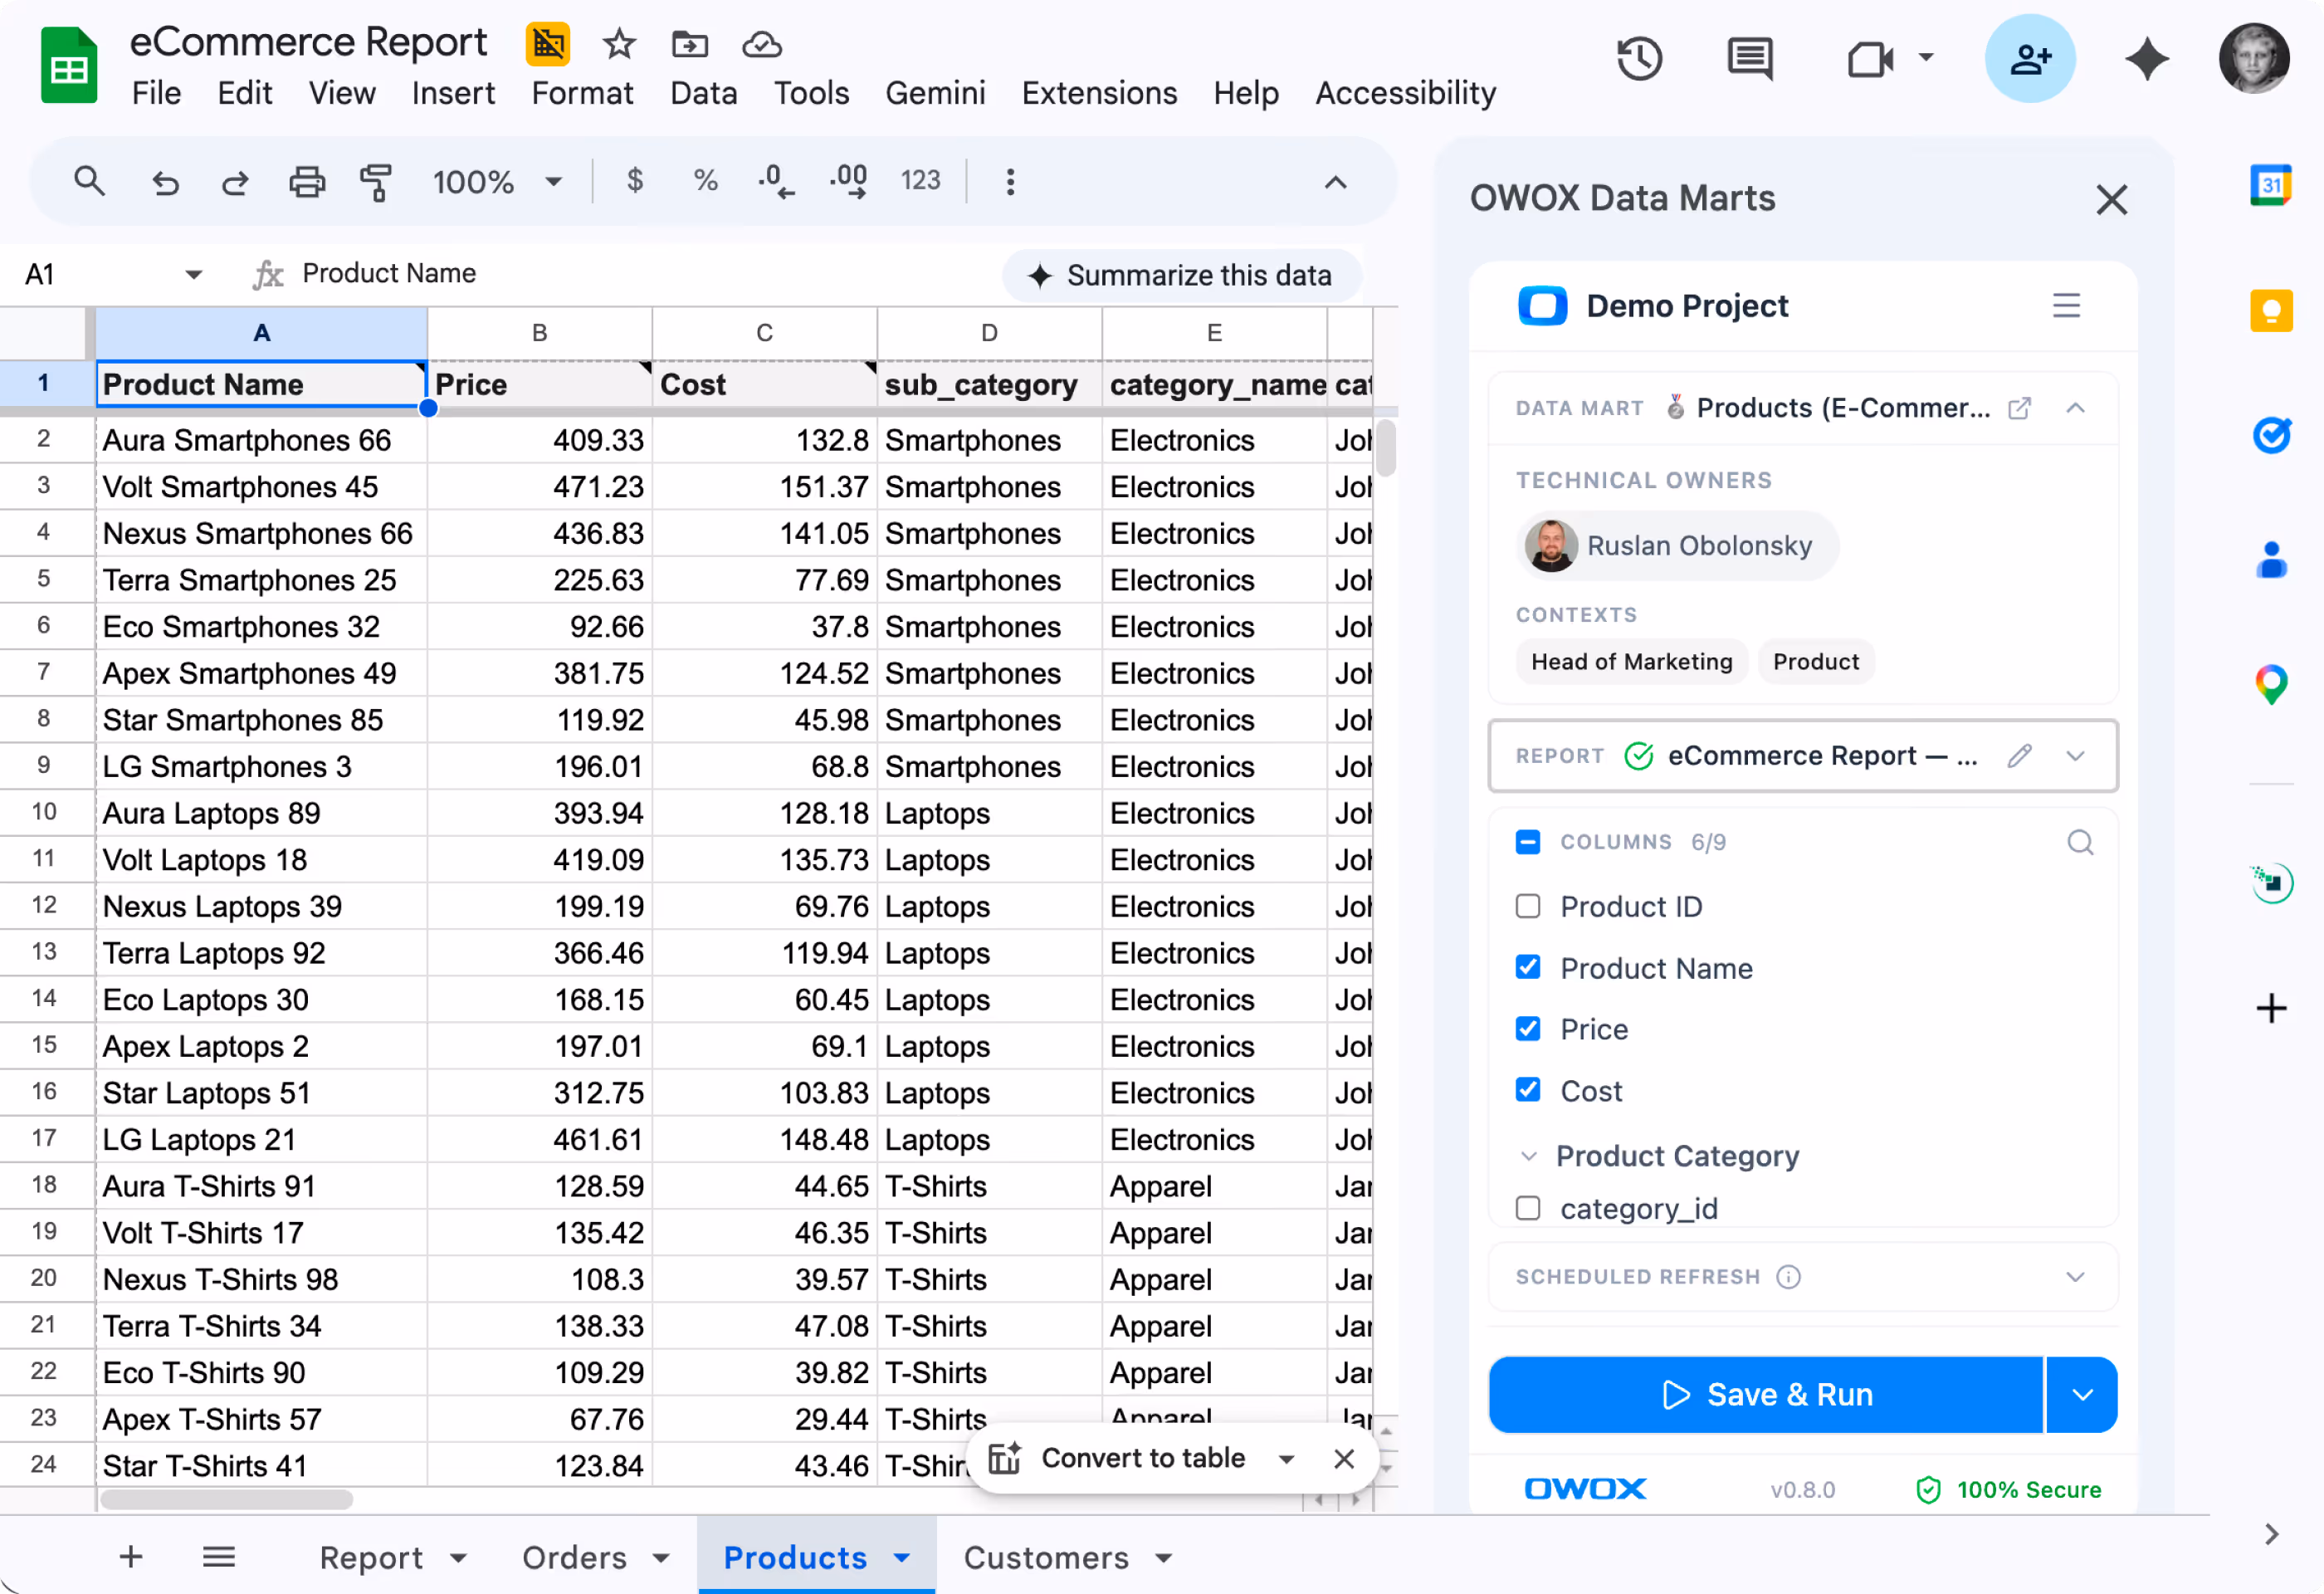
Sales managers open Sheets, browse the pipeline library, filter by rep or region, refresh. No RevOps bottleneck.

Pipeline narrative — conversion rates, velocity, forecast confidence — to Slack every Monday. Deterministic.


When pipeline, attribution, and revenue pull from the same governed source, the sales org transforms.
MQL-to-close tracing in one view. Marketing sees which leads converted. Sales sees which efforts mattered. No more "your MQLs were junk" arguments.
Pipeline data is governed, versioned, deterministic. Your forecast has a foundation, not a formula you inherited.
When the sales team self-serves pipeline data, your RevOps lead stops spending 20 hours/week on snapshots and starts optimizing the process.
Teams that ended the pipeline reconciliation problem
OWOX connects to the data warehouse where your CRM data lives — not to the CRM directly. Most sales orgs already replicate Salesforce, HubSpot, or Pipedrive data to a warehouse via Fivetran, Stitch, Airbyte, or native CRM exports. OWOX sits on top of that: your RevOps team wraps the CRM tables as Data Marts, joins them with marketing attribution and revenue data, and publishes the governed library. If your CRM data isn’t in a warehouse yet, that’s a one-time setup — tools like Fivetran handle it in an afternoon. Once the data is there, OWOX makes it joinable, governed, and self-serve for your entire sales org.
The argument exists because marketing and sales look at attribution from different systems. Marketing sees platform-reported conversions. Sales sees CRM close data. Neither is wrong — they just see different slices. OWOX joins both datasets in the warehouse: ad platform touchpoints + CRM pipeline stages + actual revenue from your billing system. Your analyst defines the attribution logic as a Data Mart. When marketing pulls "Deals Influenced by Campaign X" and sales pulls "Pipeline by Source," they’re pulling from the same joined data with the same definitions. The argument ends because the data is the same.
The Google Sheets Extension is a column picker. Your regional sales manager opens a Sheet, browses the Data Mart library (they see names like "Pipeline by Stage" and "Revenue by Rep"), checks the columns they want — Deal Value, Stage, Close Date, Marketing Source — filters by their region, and hits refresh. It’s closer to a Sheets filter than a BI tool. Nothing to install, nothing to configure, no query language to learn. The technical work happens once on the RevOps side.
The AI brief doesn’t generate a forecast from scratch — that would be dangerous. Instead, your analyst defines the forecast logic as a Data Mart: pipeline by stage, historical conversion rates, deal velocity metrics. Insights runs that deterministic SQL against your warehouse and computes the exact numbers. AI then writes the narrative: "Q3 pipeline is $4.2M at a 68% stage-weighted conversion rate, implying $2.8M in expected closed revenue — down 8% vs. Q2 at the same point." The $4.2M, 68%, and $2.8M are SQL results. Every number is traceable. Patented technology.
Cloud Starter is $30/month — includes Data Mart management and the Google Sheets Extension. Your RevOps lead can have the first pipeline Data Marts live in a day. Team plans from $875/month add AI Insights (the weekly pipeline brief), multi-destination delivery (Slack, Teams, email), and SLA. For context: your RevOps lead currently spends 20+ hours/week on pipeline data pulls and reconciliation. At $60/hour, that’s $4,800/month in RevOps time spent on data extraction, not process optimization. OWOX eliminates most of that.
CRM dashboards show CRM data. They can’t join it with marketing attribution, advertising spend, or revenue from your billing system — because that data lives in different tools. Every time a sales leader asks "which marketing campaigns actually drove pipeline?", someone has to manually export, join, and reconcile data from 3+ systems. OWOX automates that join in the warehouse. Your CRM data + marketing attribution + revenue = one governed library. CRM dashboards stay for day-to-day pipeline management. OWOX adds cross-system visibility that CRM alone can’t provide.
Send this to your RevOps lead. They’ll join CRM, marketing, and revenue data. Your sales org self-serves. Monday reviews finally work.
See how your CRM data joins with marketing attribution and revenue — with your actual pipeline in mind.