Data Mart Management
Define the logic once. Reuse it everywhere.
A Data Mart is analyst-defined logic — SQL, Table, View, Pattern, Connector or Joinable — published once and reused by every report in Google Sheets, Excel, Looker Studio, Slack, Teams, email and your AI assistant. Nothing reaches a destination until the analyst publishes it.
Get started freeRead the docs →
Data Partner You Can Trust
users
175K
Executives and data analysts across 20+ industries
G2 rating
4.9★
“A trusted data analytics partner” — verified review
Customers
Define once, publish once, reuse everywhere
The analyst owns the definition. Business users get governed, ready-to-use data in every reporting tool, and nothing changes downstream until the analyst publishes it.
THE ANALYST
Own the logic, skip the tickets
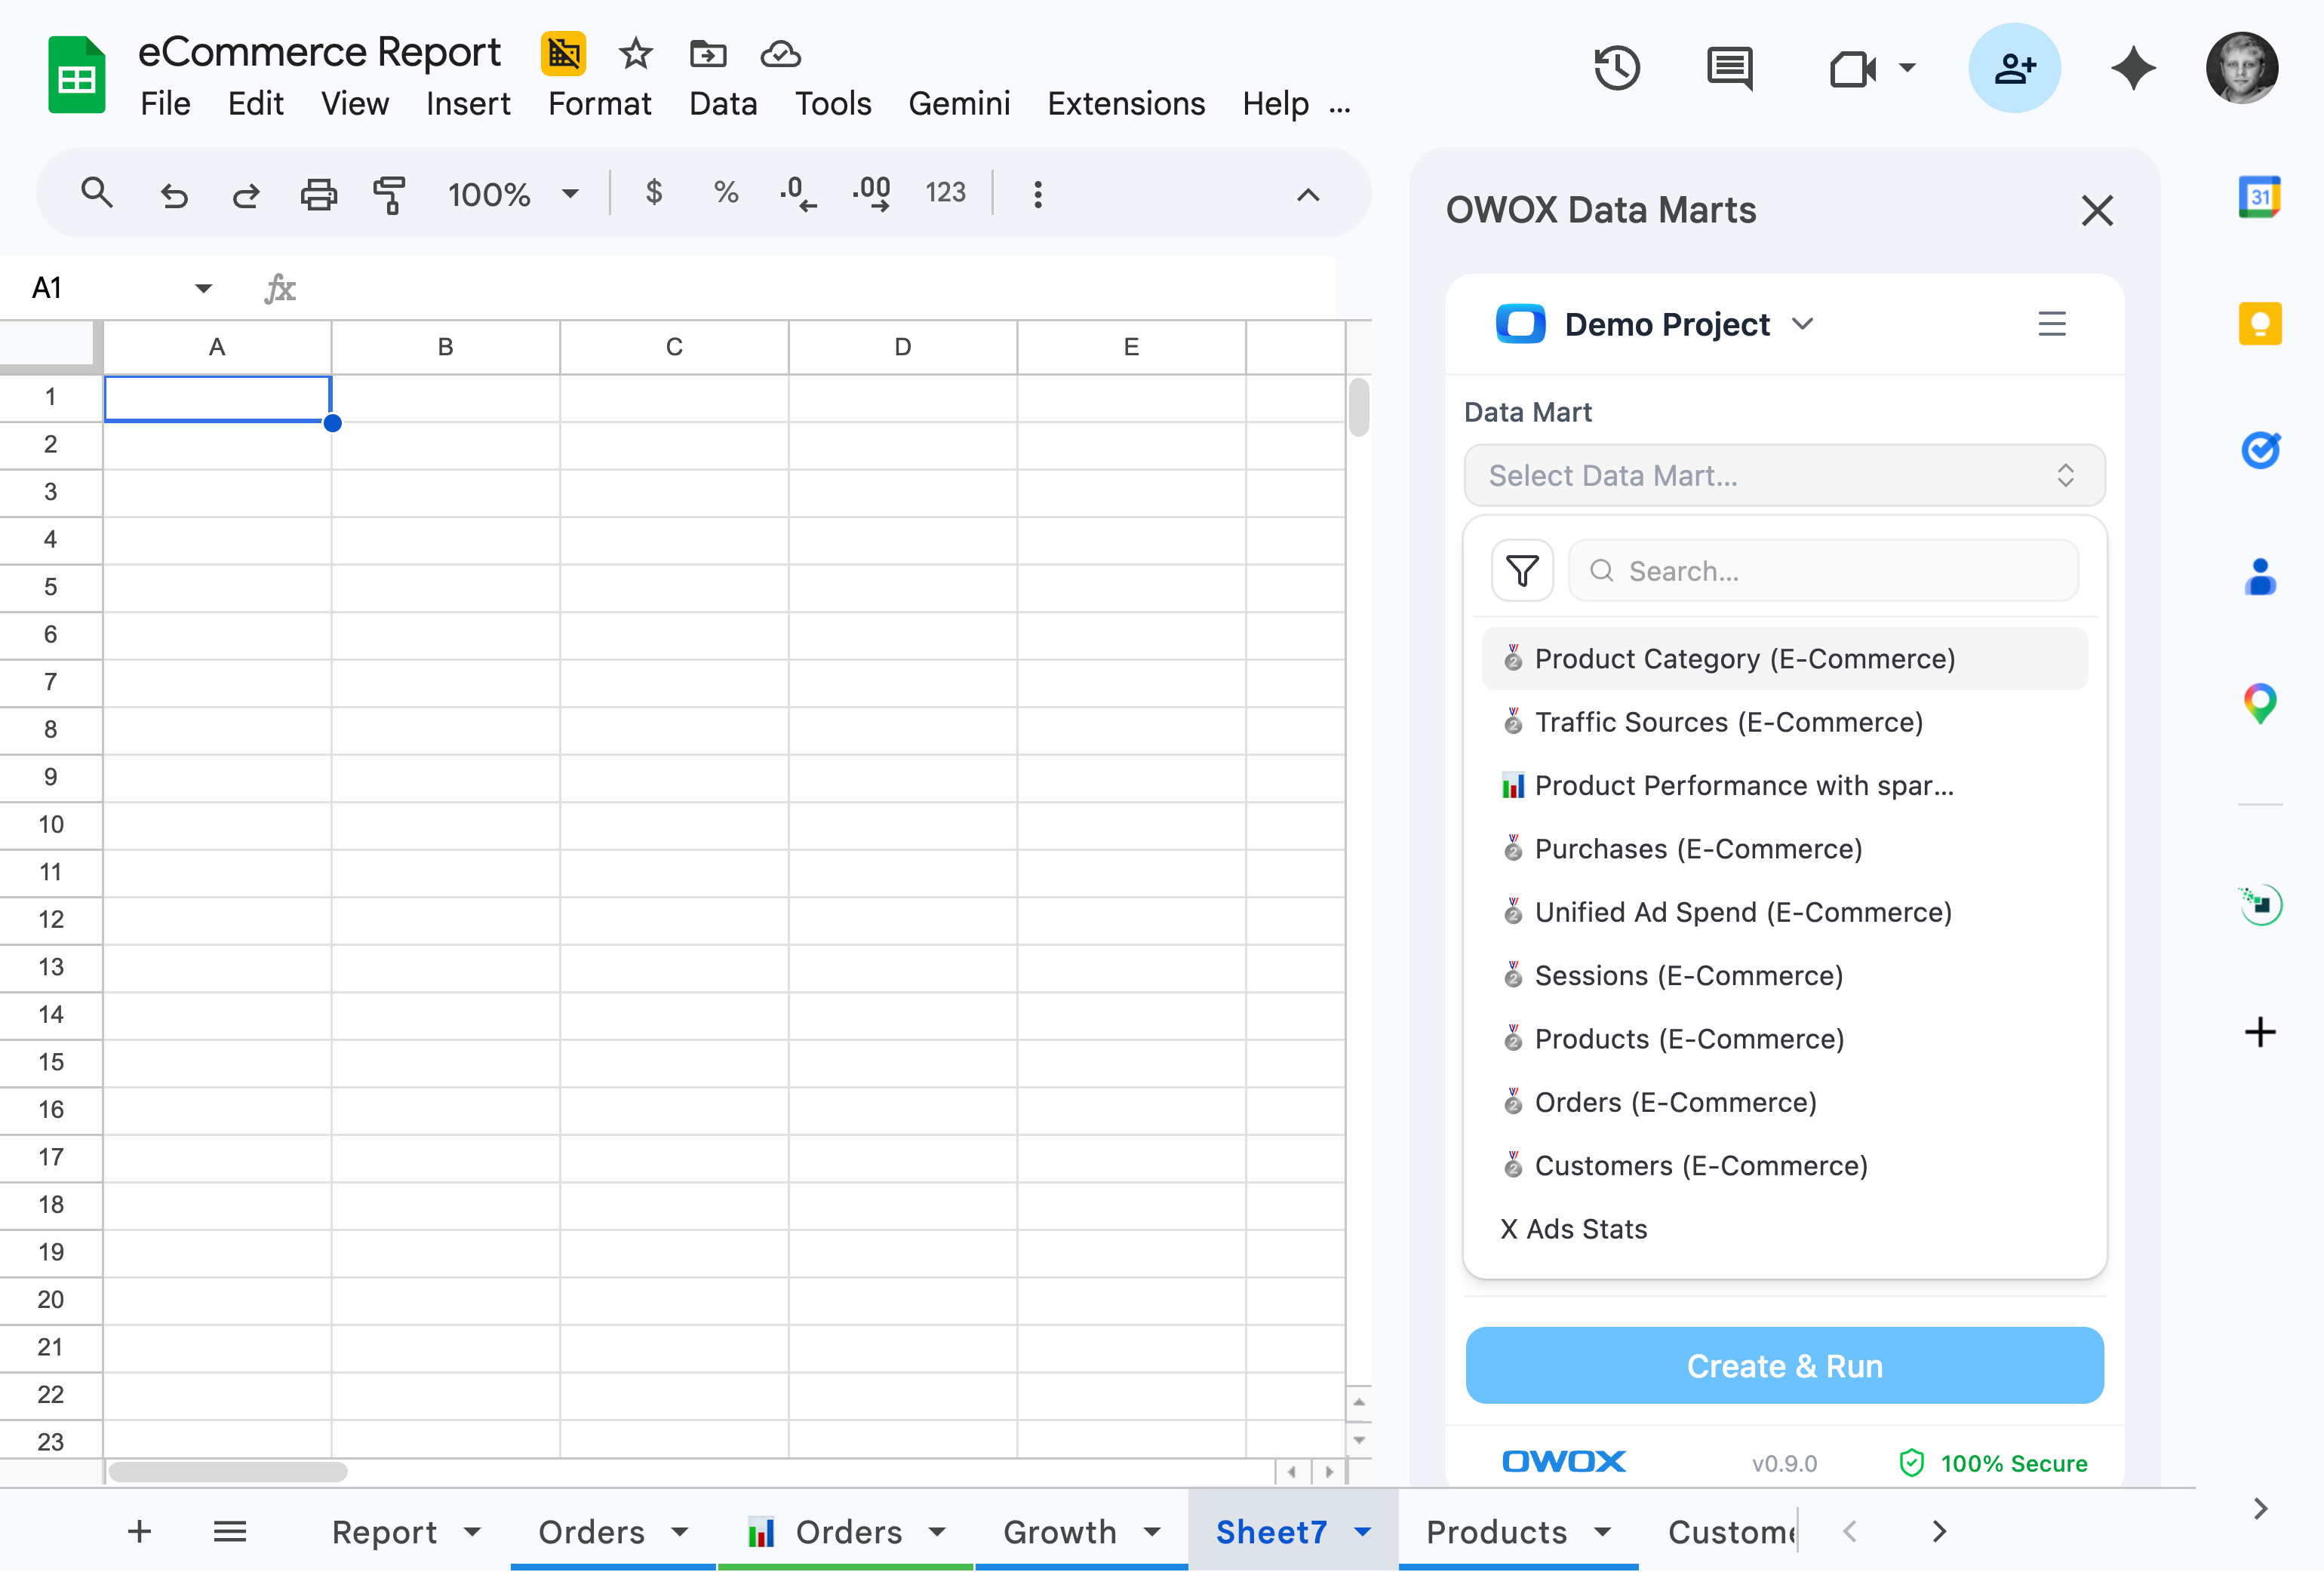
Write SQL or point at a table, view or pattern, describe the output schema, publish. Every report built on the mart uses the definition you own and shows the SQL behind its numbers.
Your SQL, your rules — packaged for the entire organization.
THE BUSINESS USER
Clean data, zero setup
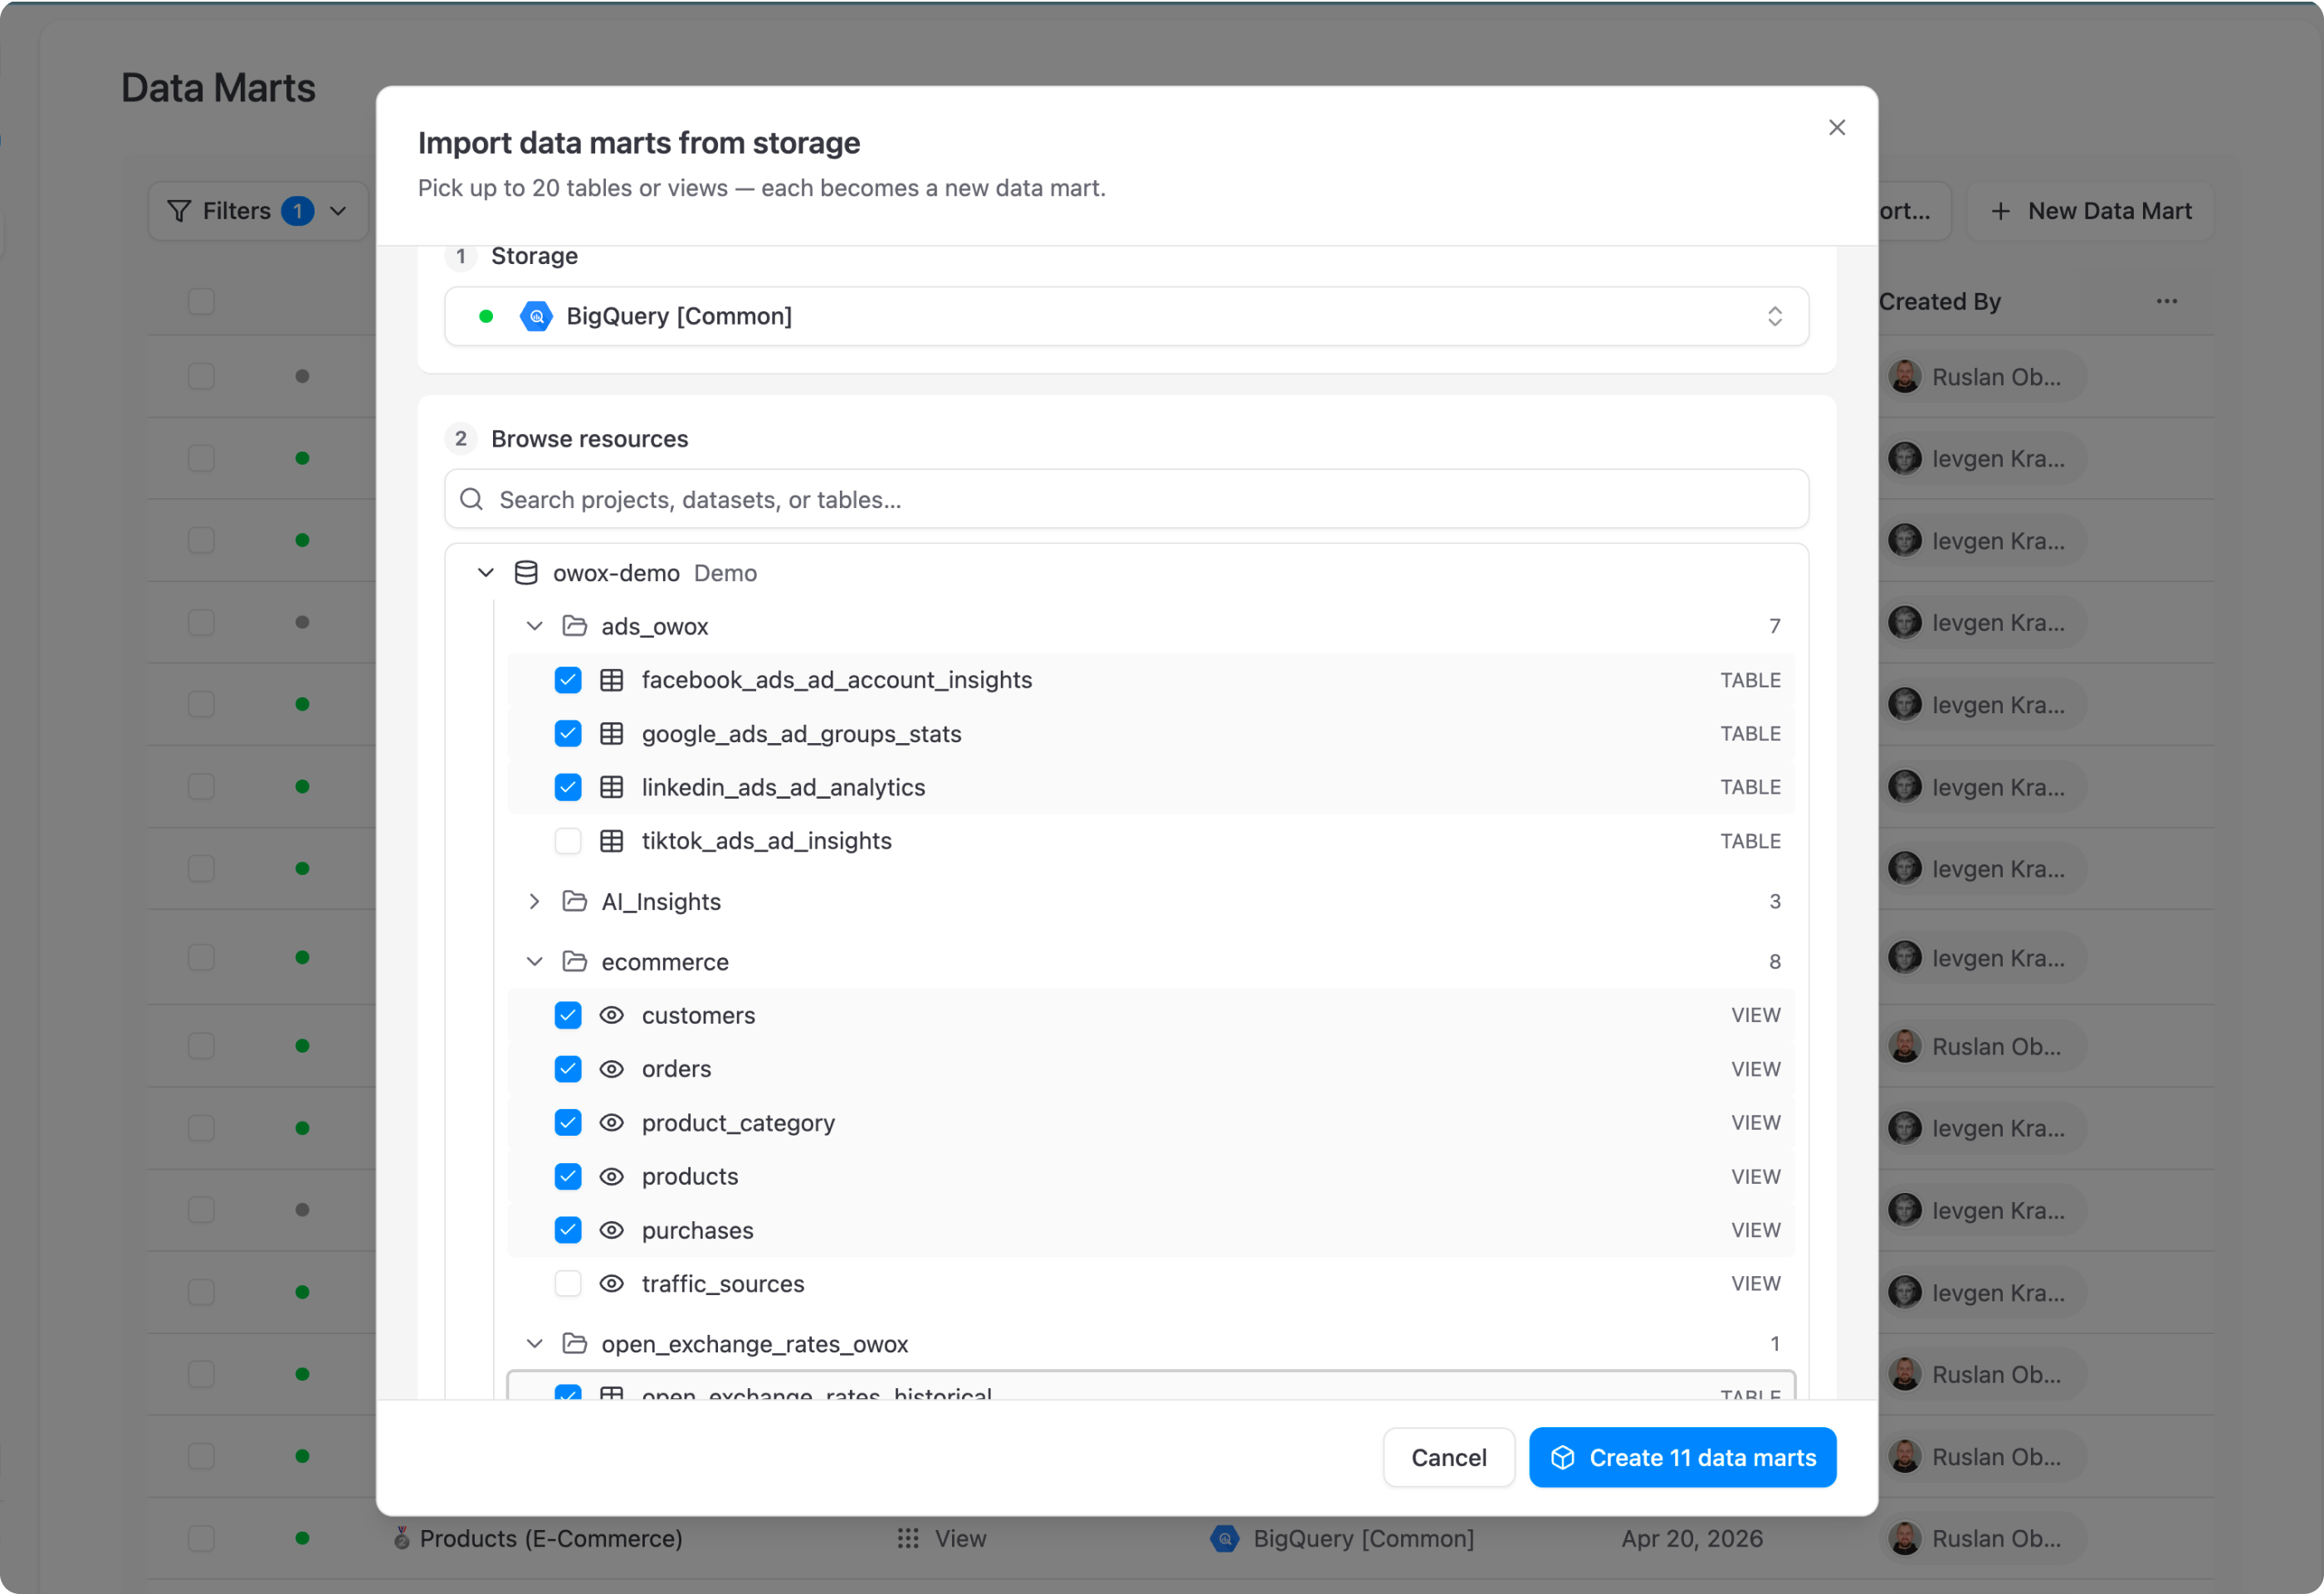
Browse the Data Marts your team has published. Pull them into Google Sheets, Excel or Looker Studio, or ask in Claude or ChatGPT via OWOX MCP. No joins, filters or warehouse schemas to learn.
Think of data marts as 'playlists' — curated by analysts, enjoyed by everyone.
One definition every report agrees on — When the analyst defines the logic once, business users take the next column themselves, and the request queue stops refilling.
For Data Teams
Build reusable analytics assets
Write SQL, define transformations, version your work — every data mart becomes a governed asset the whole company can query.
Build a Data Mart from anything you already have
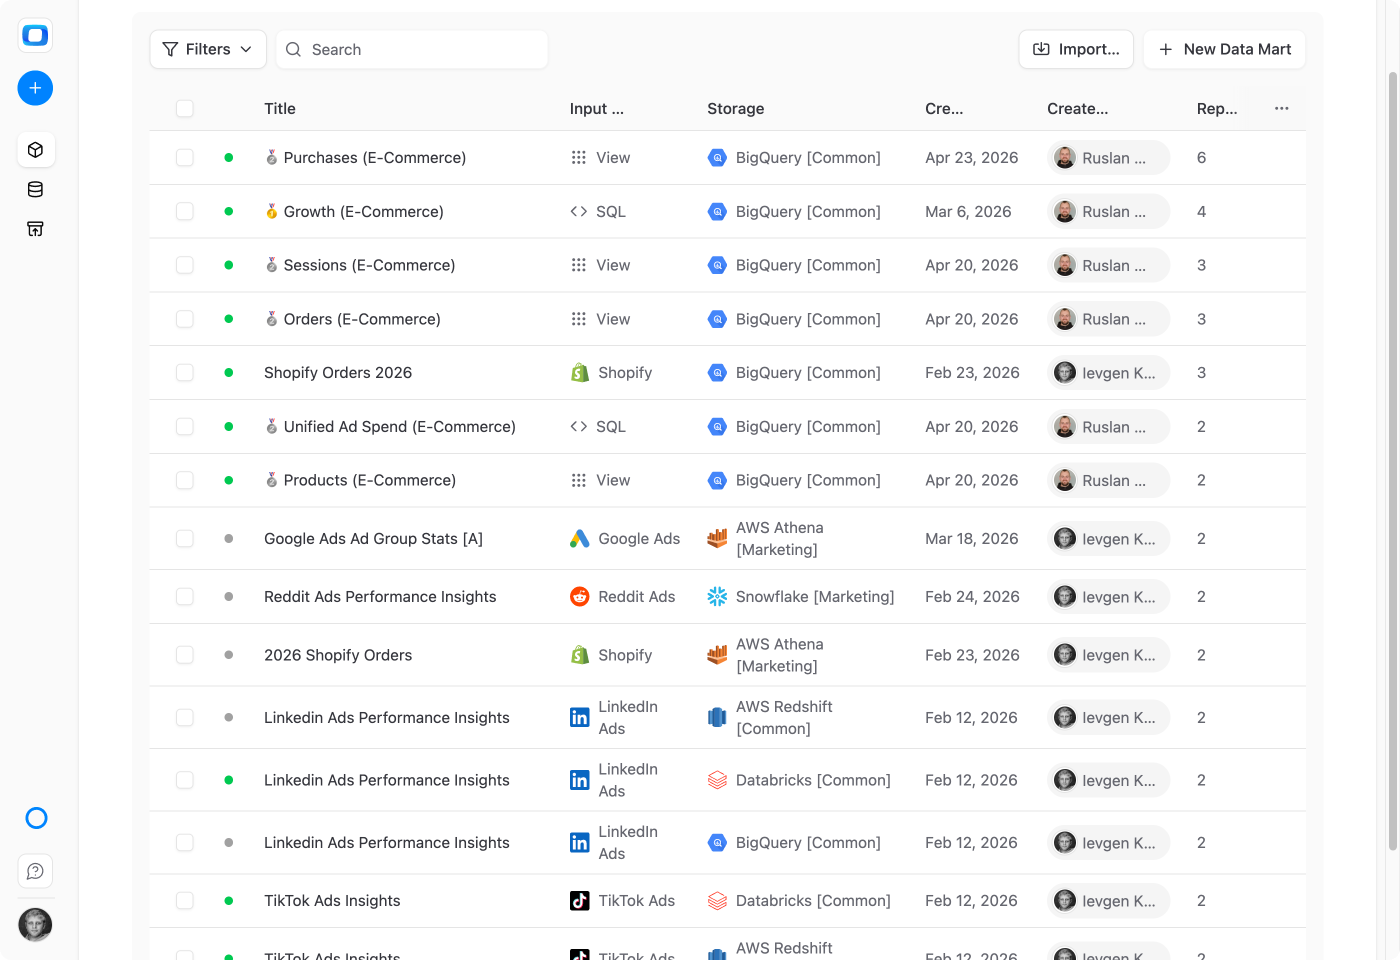
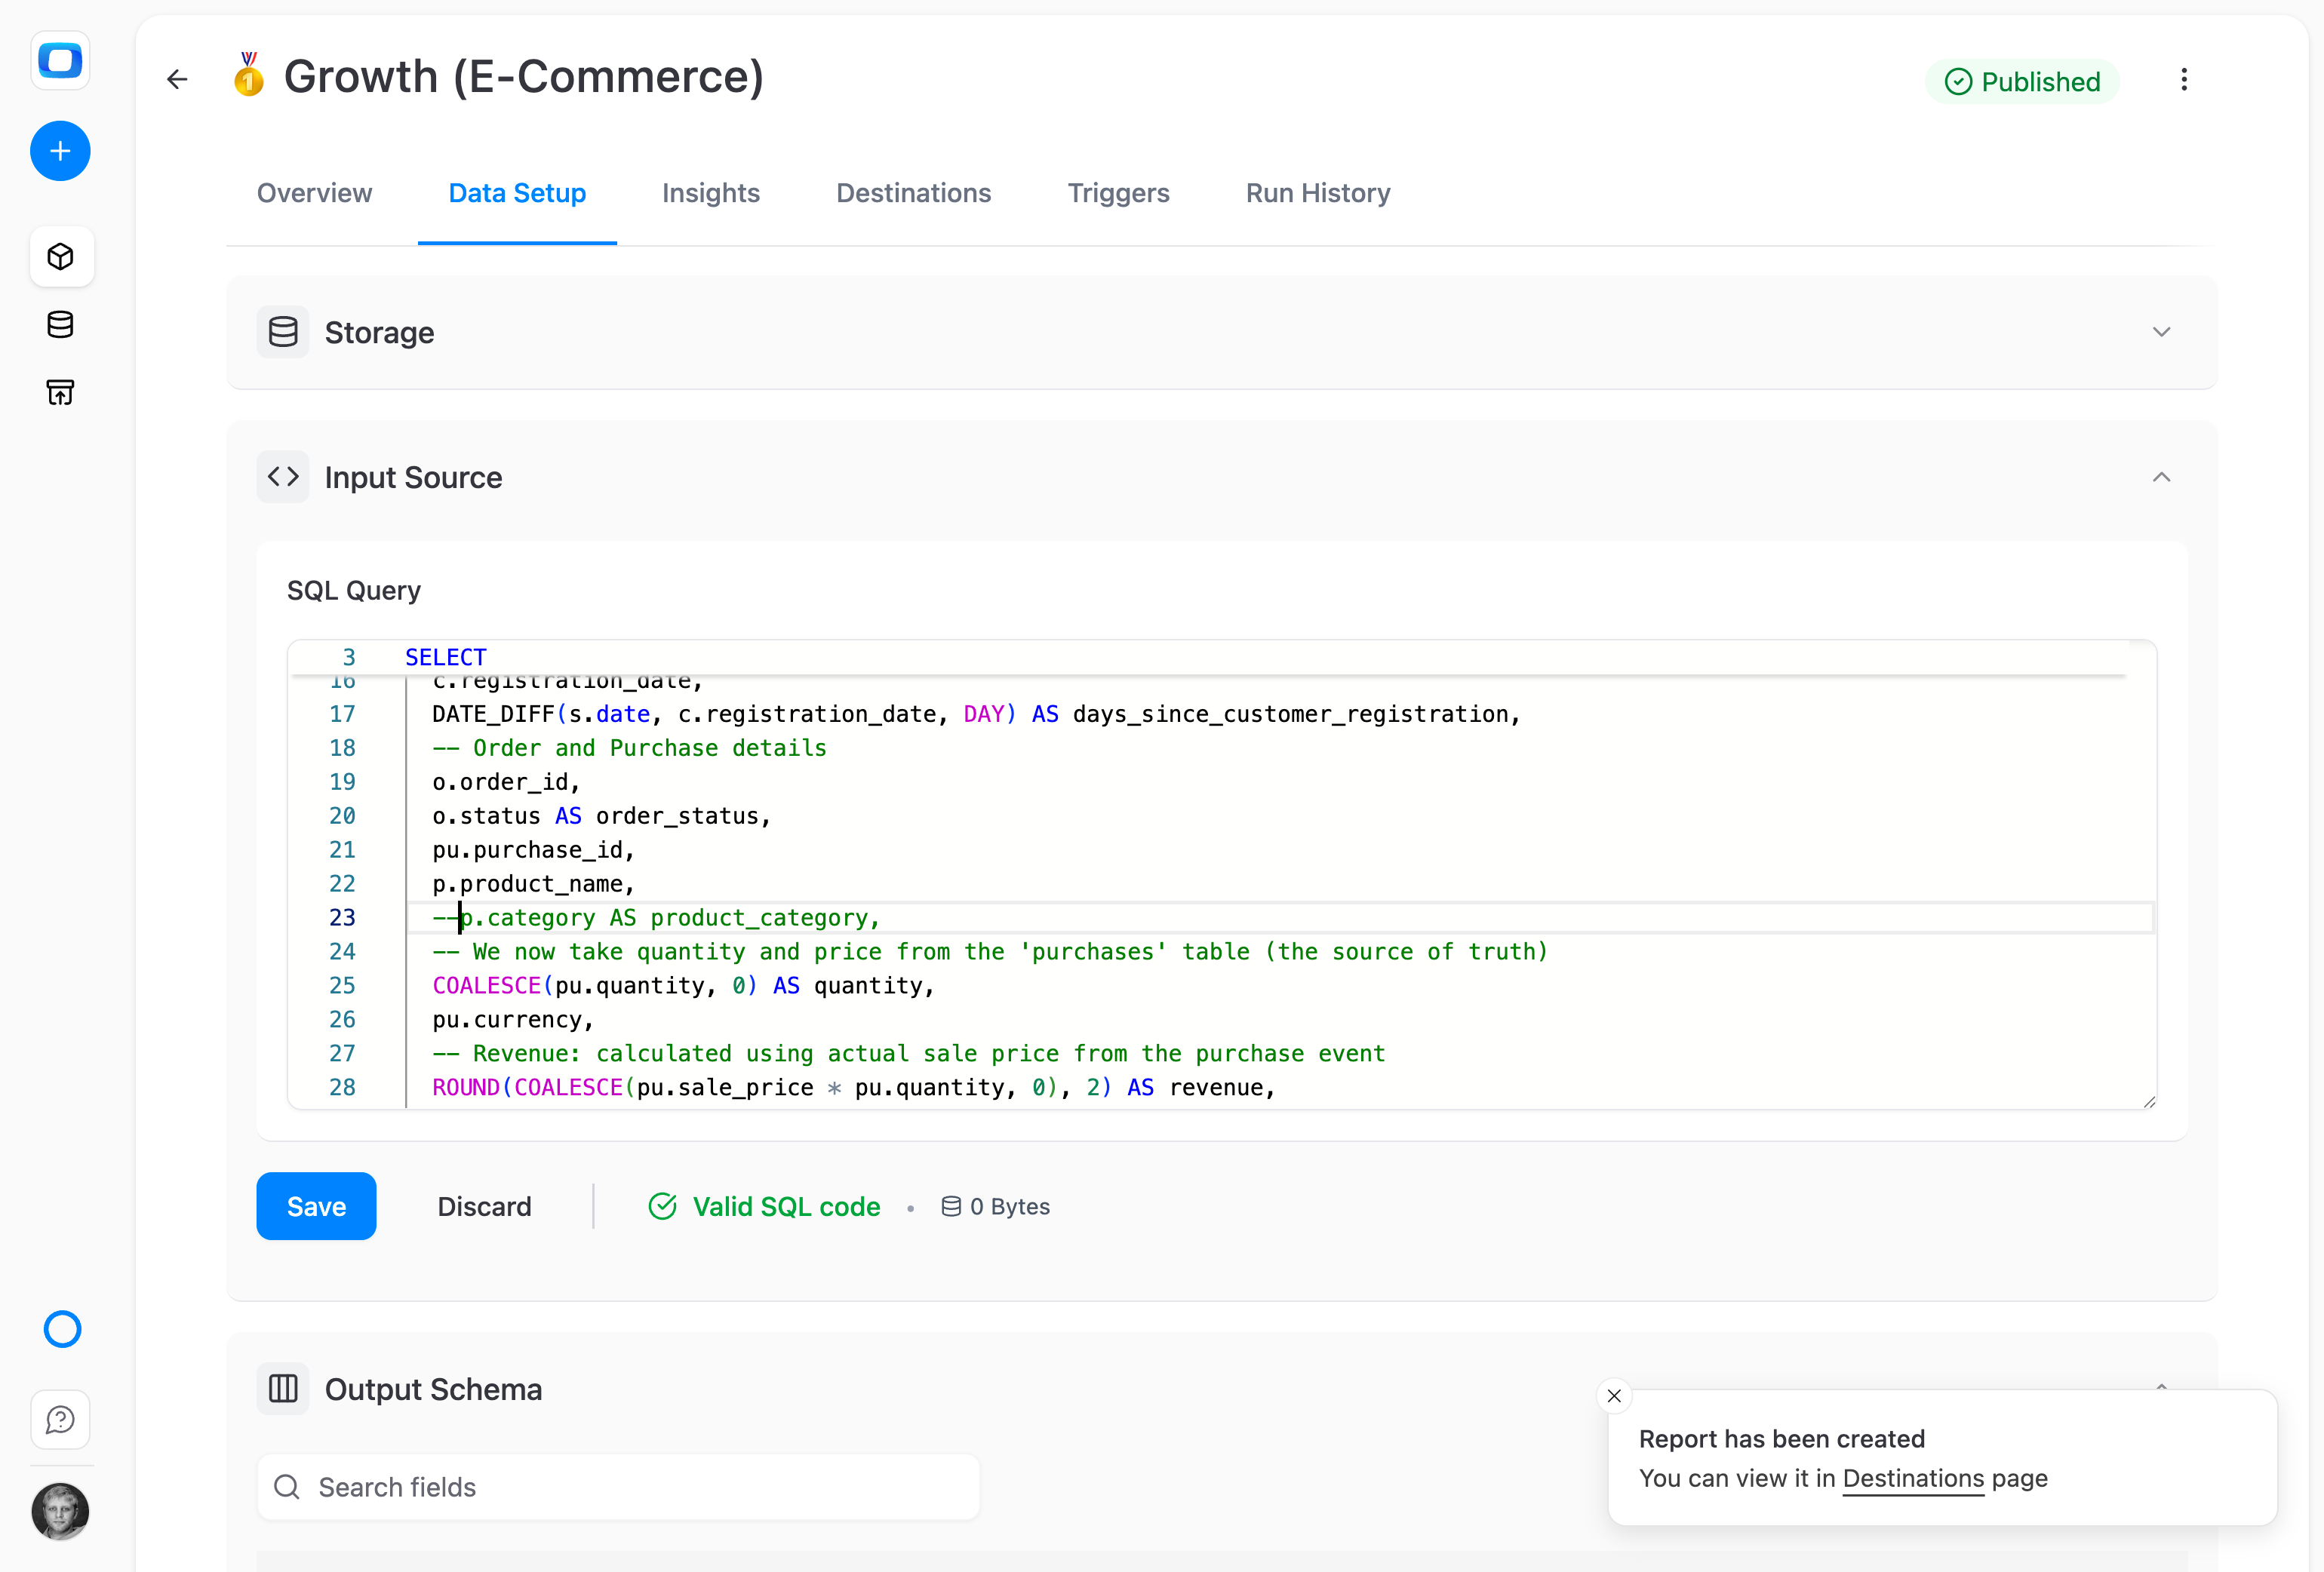
Start from a SQL query, a warehouse table, a view, a pattern or a connector's output. Or import up to 20 BigQuery tables and views in one action, with sharded tables collapsed into a single Pattern mart.
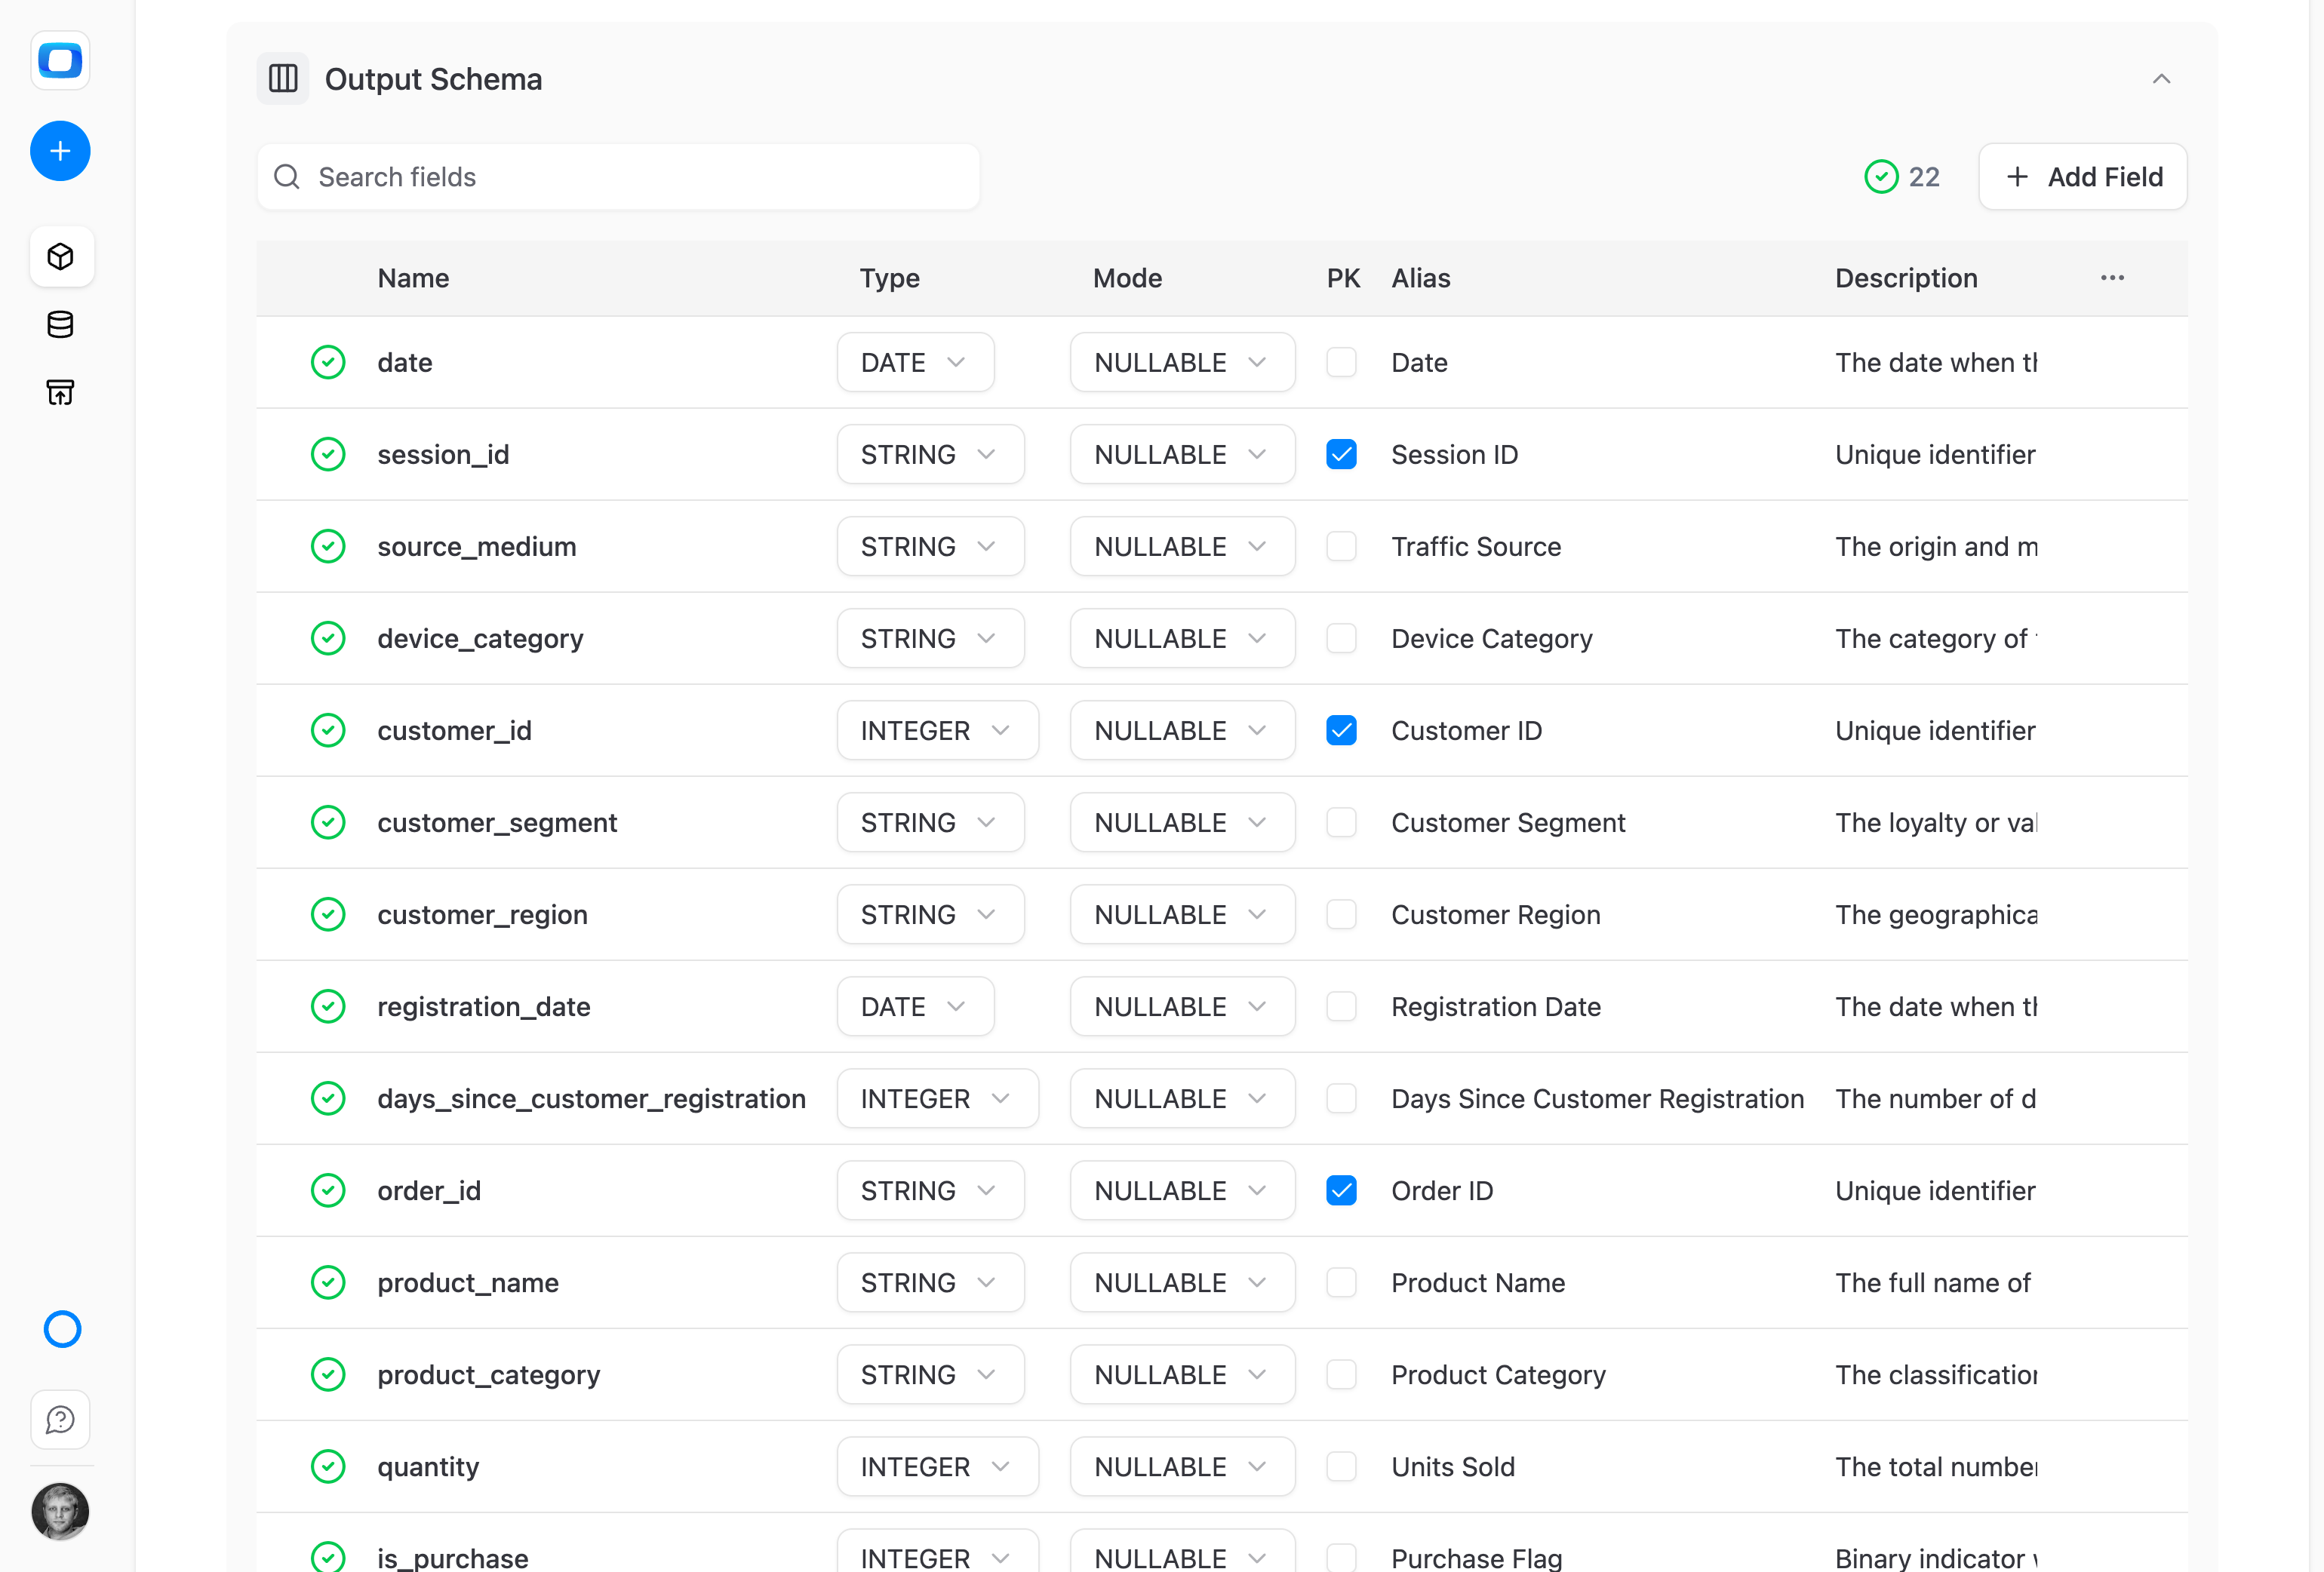
Clean output schemas — aliases, descriptions, metadata
Rename fields, add descriptions and business-friendly aliases, or let the AI helper draft them from the schema and sample rows. Add calculated fields like CTR or ROAS as formulas that recompute at the grain each report asks for.
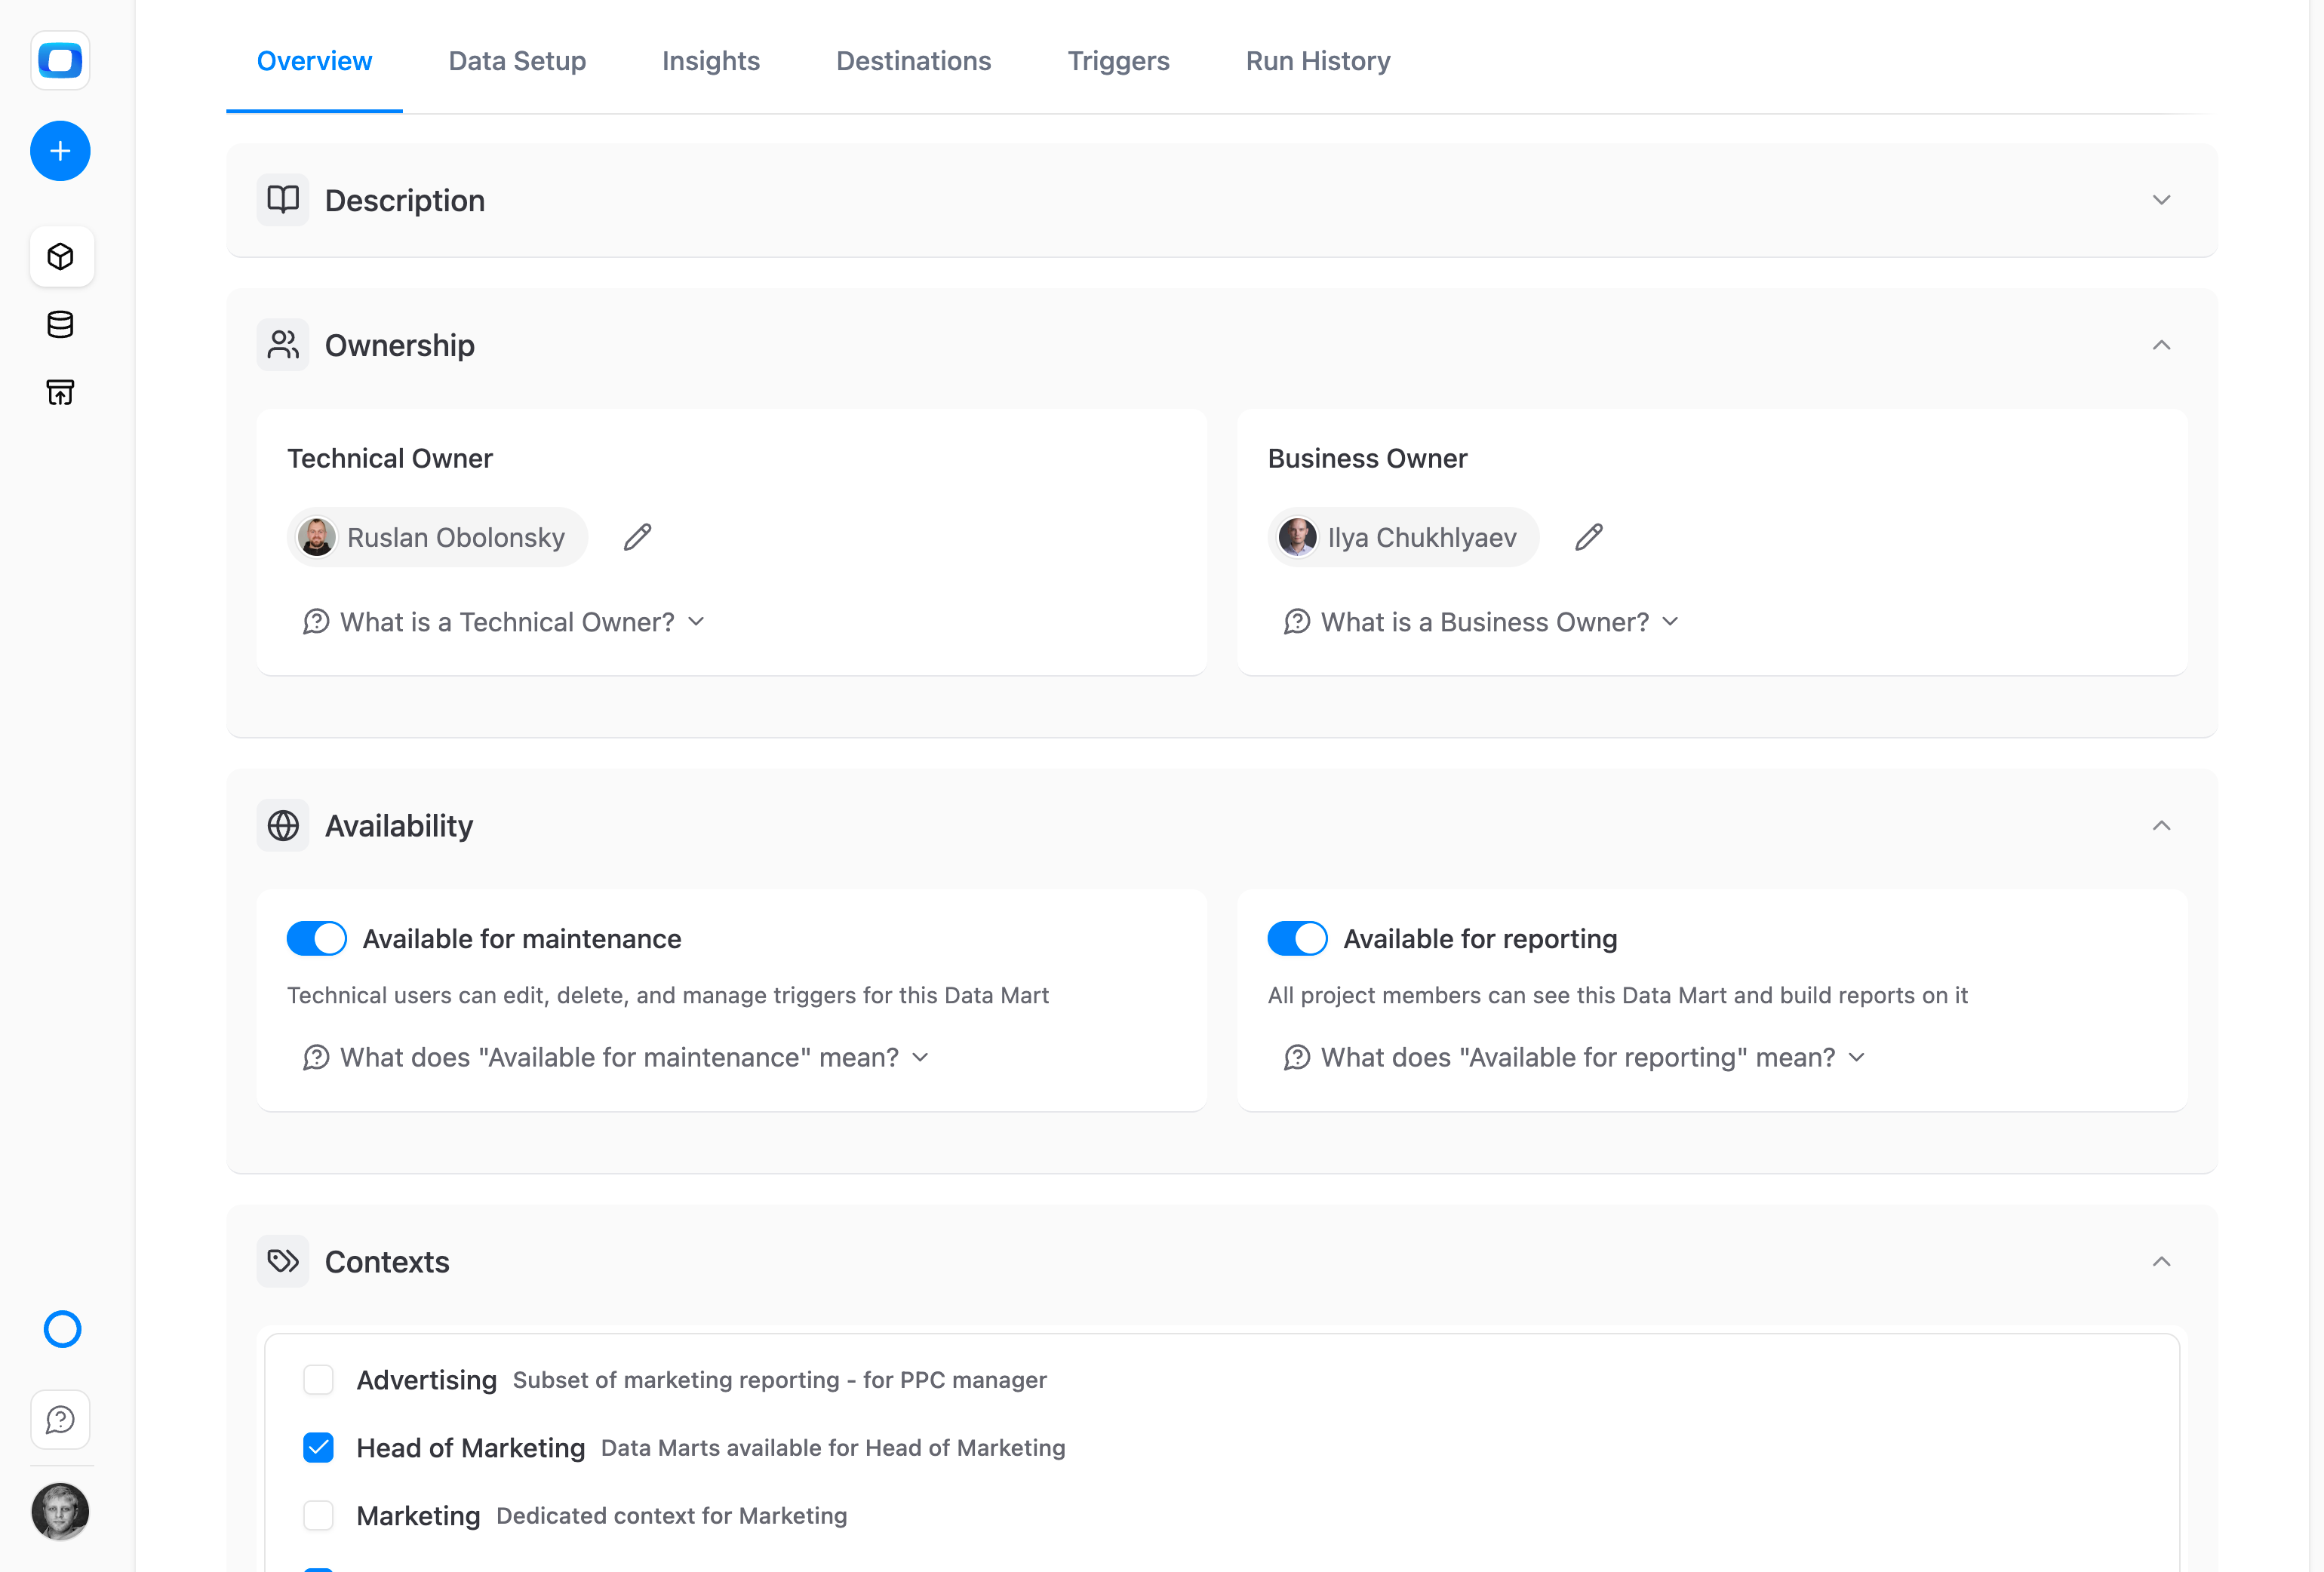
Governance built in — who sees what, who edits what
Publish when the mart is ready. Nothing reaches a destination before that. Then set who can report on it and who can edit it, and assign it to a context. The data team stays in charge of every governed asset.
For Business Teams
Access clean data instantly
Browse ready-to-use datasets and pull them into Sheets, Looker Studio, or ask in Claude or ChatGPT via OWOX MCP — no SQL required.
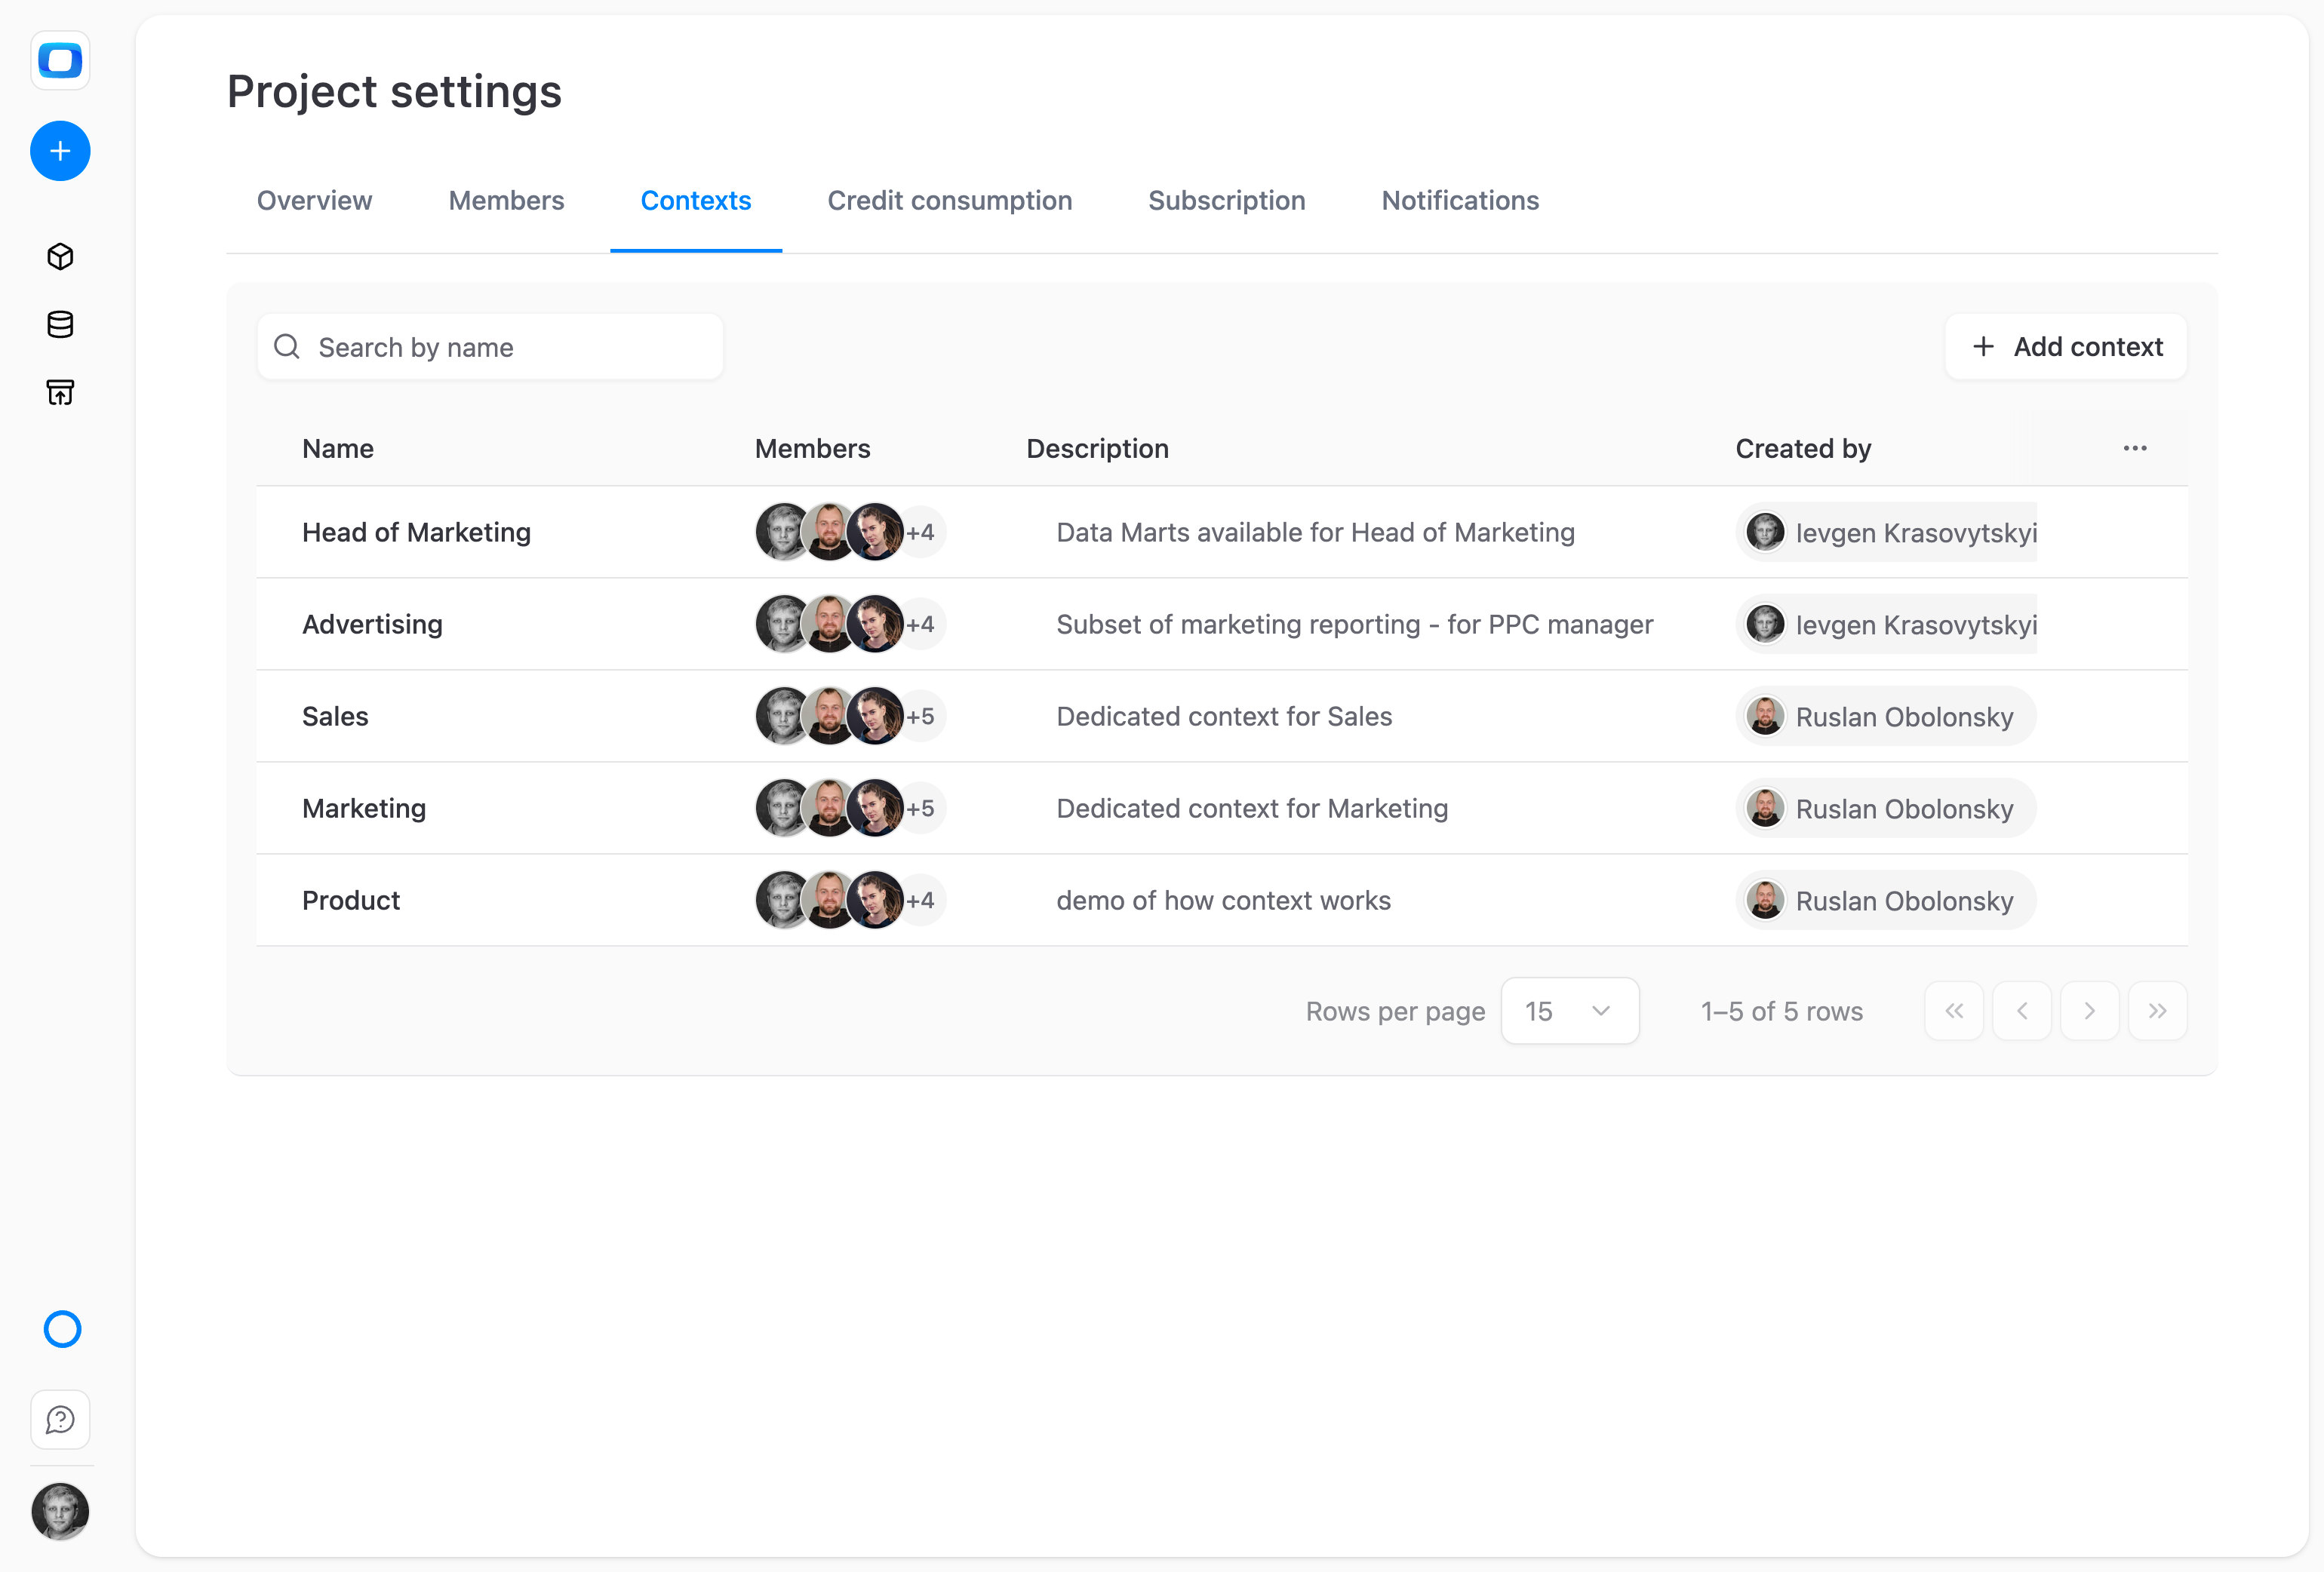
Your context, your data
Marketing sees marketing marts, finance sees finance. Project Contexts, set by your admin, show each team only the Data Marts that matter to them.
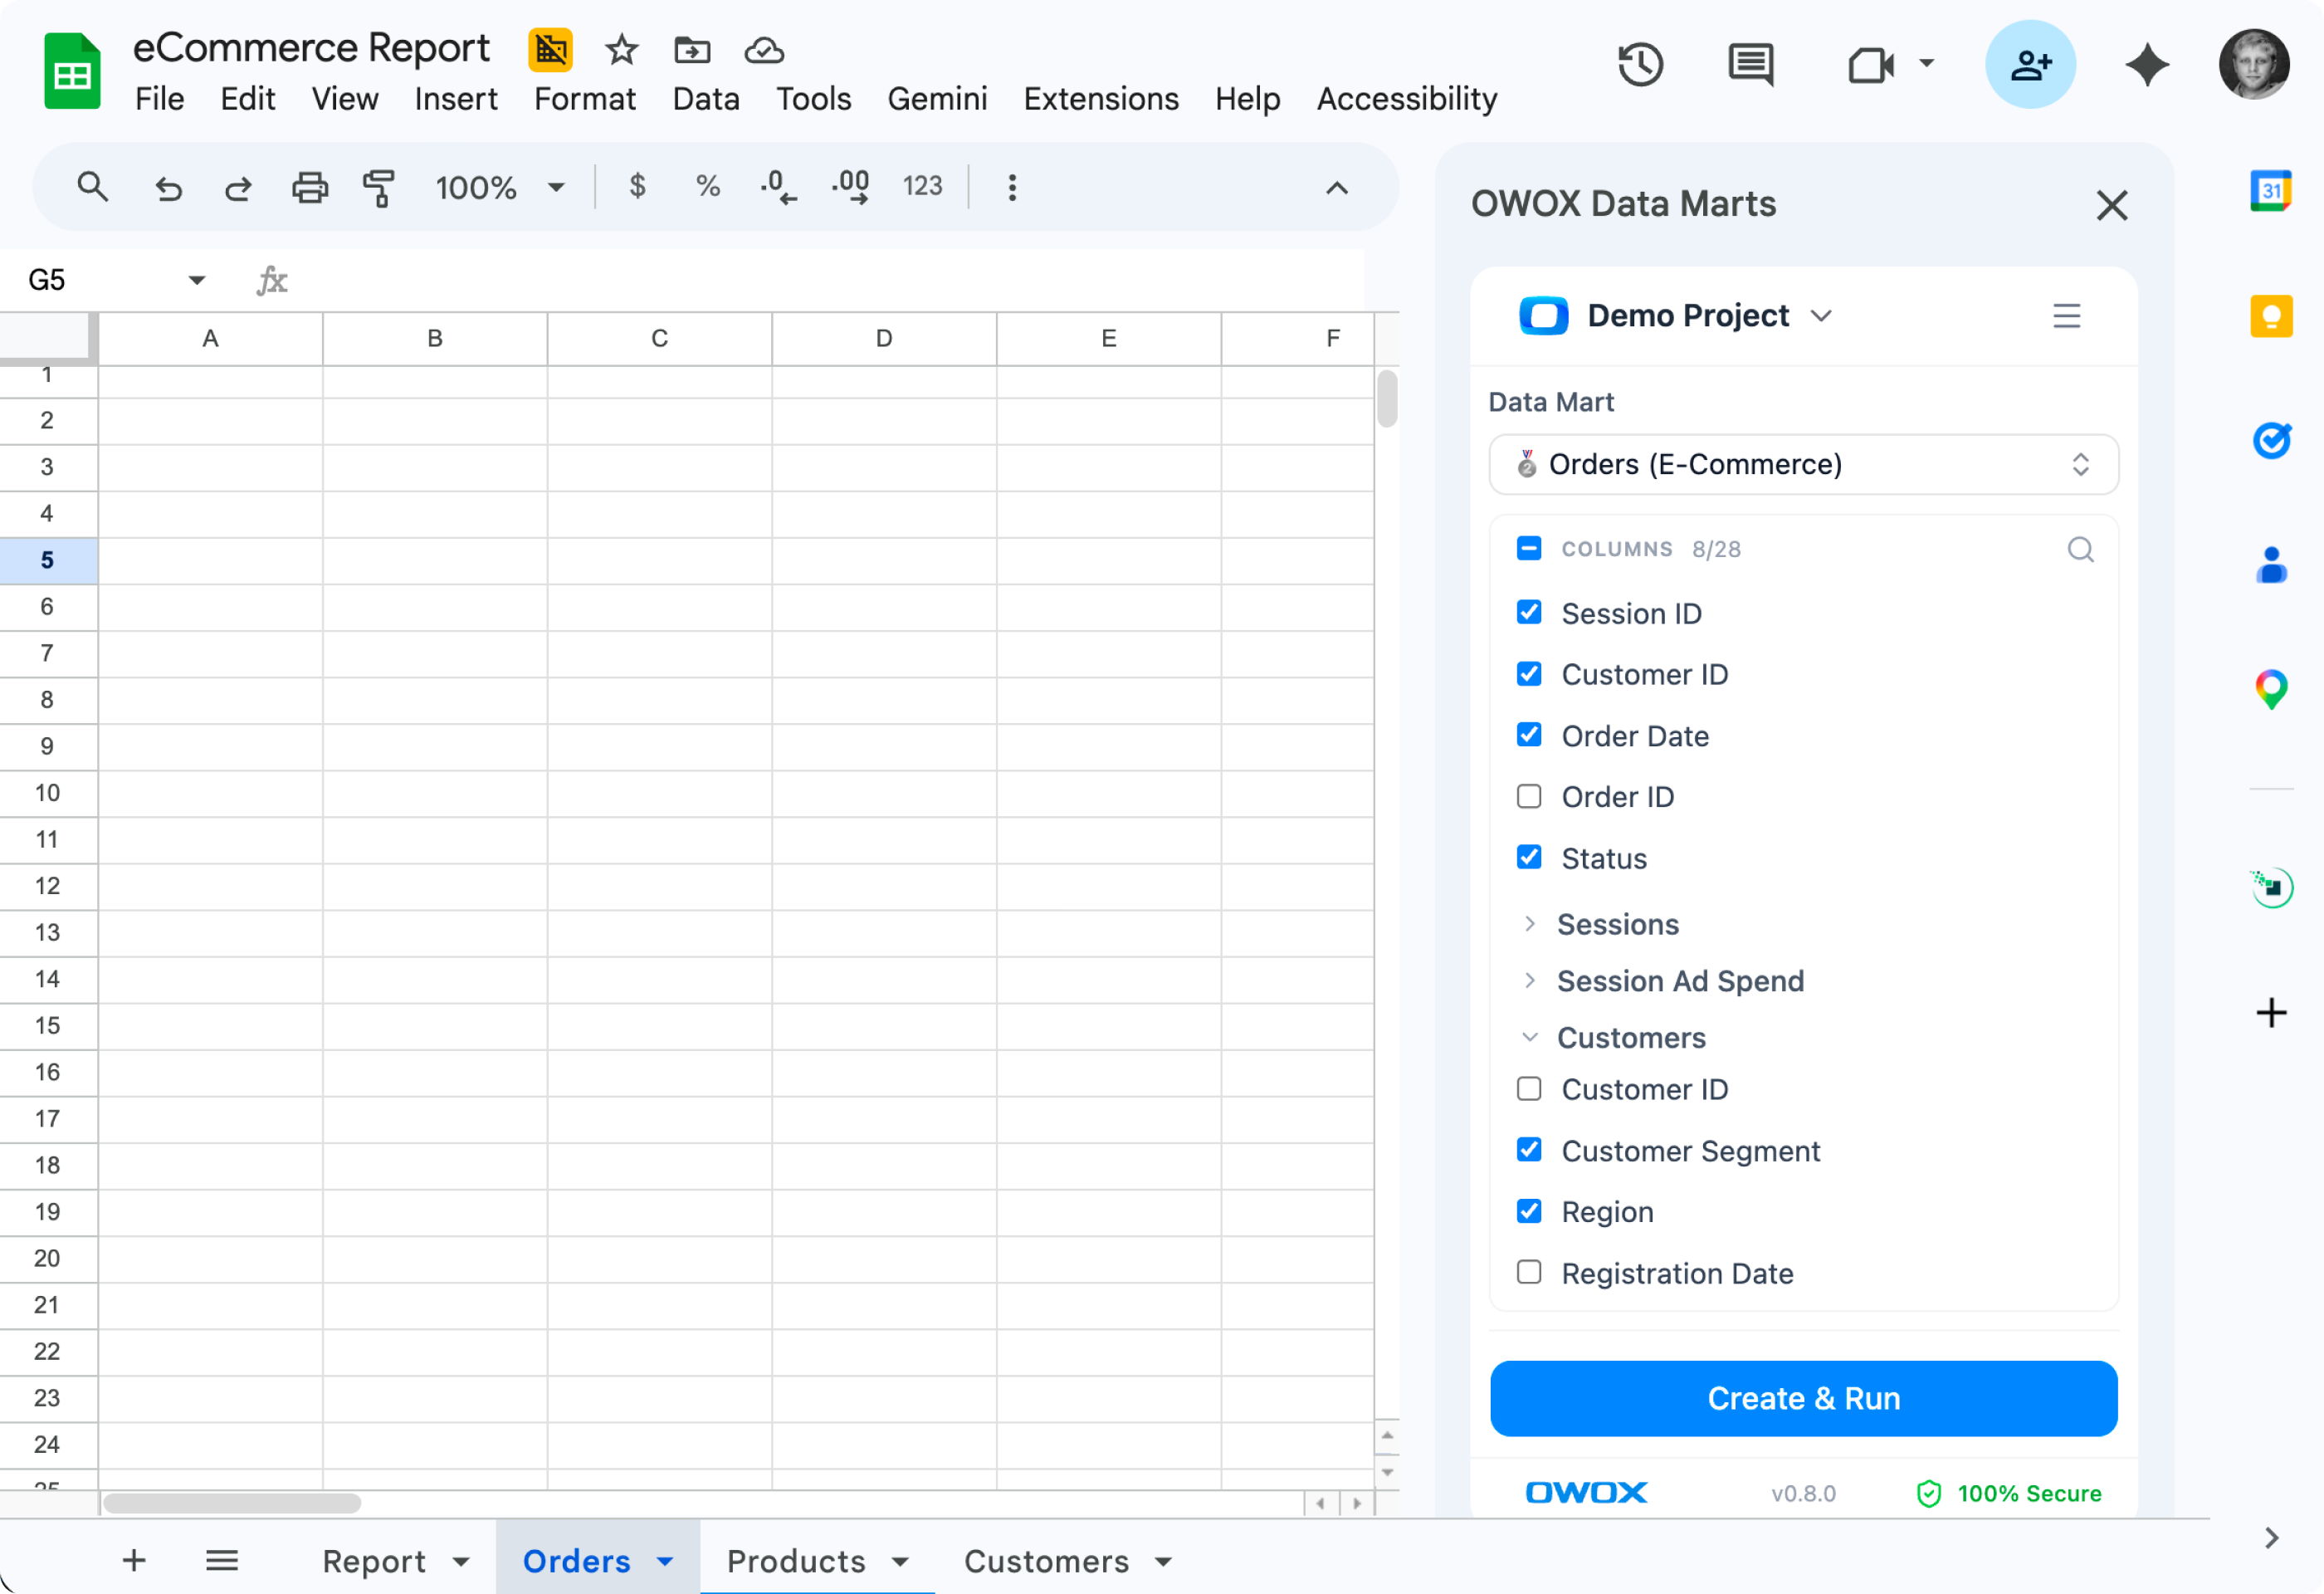
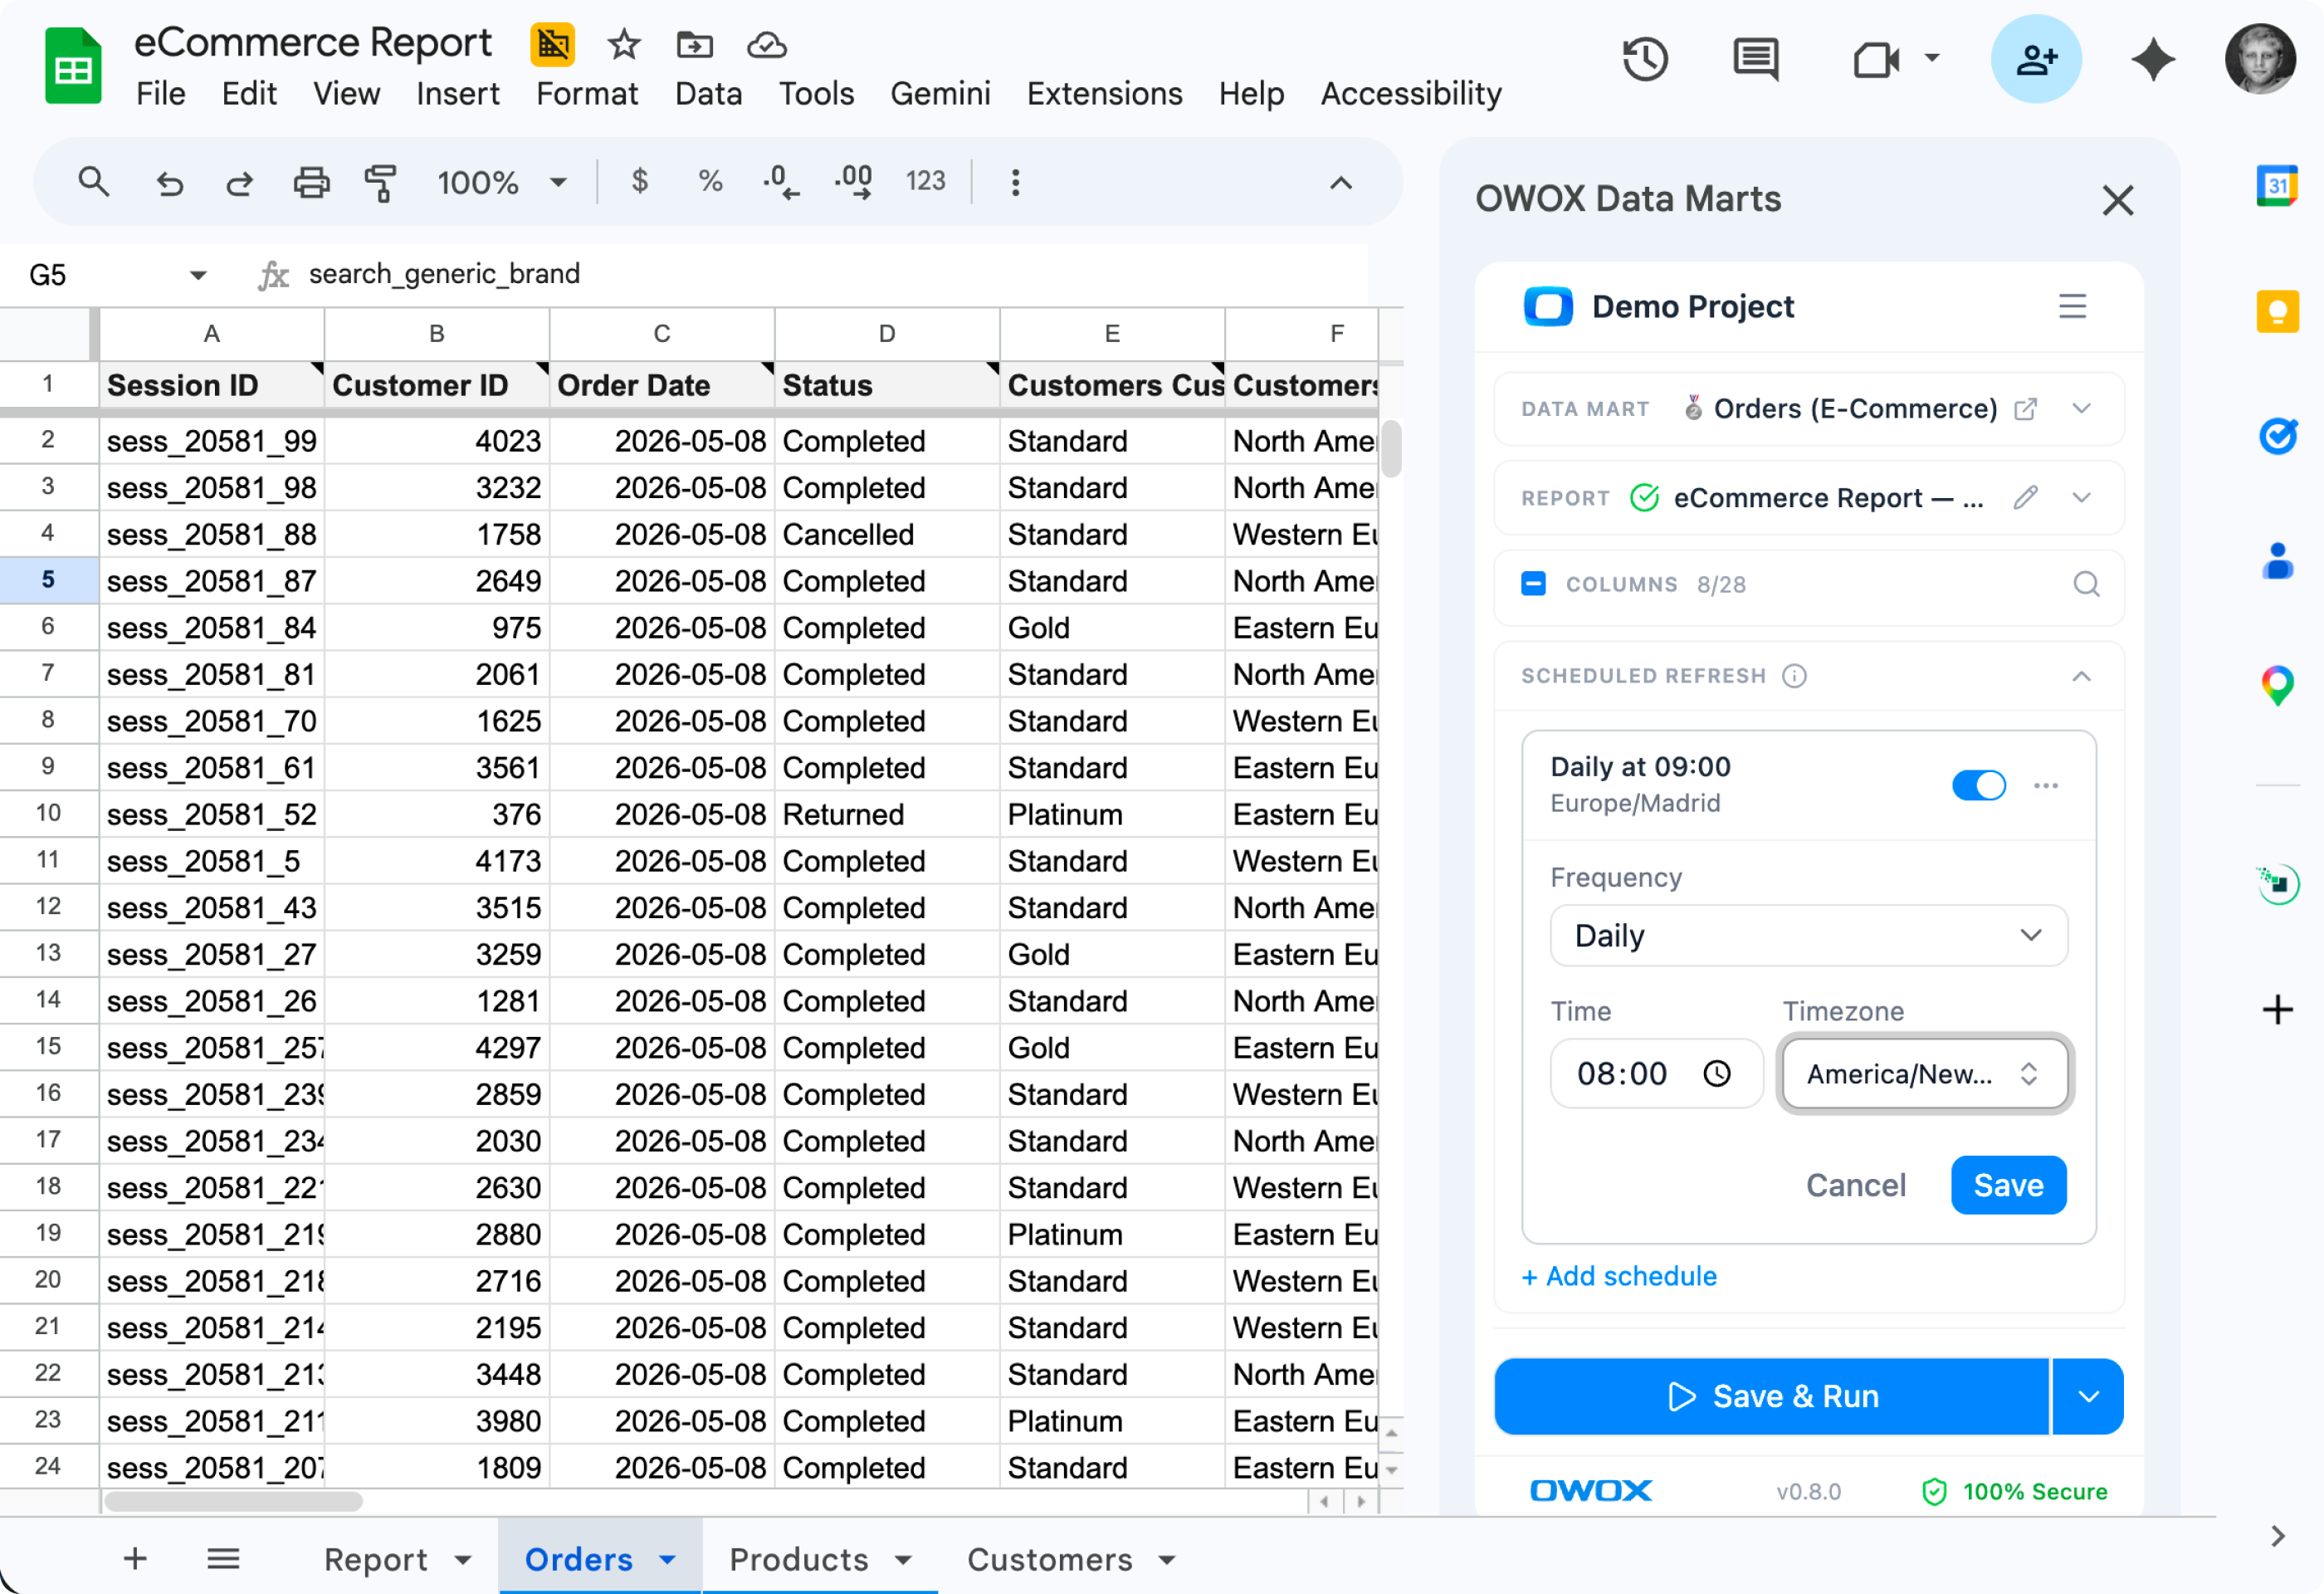
Joinable Data Marts, right inside Google Sheets
Pull two Data Marts into a Sheet and join them as if they were one. Blend orders with products or with sessions without writing SQL – the data team already wired the relationships.
Self-serve inside a trusted perimeter
Every Data Mart you can see was published by your data team, with the joins and definitions already in place. When a number is questioned, the analyst opens the report's SQL and checks it against the warehouse.
Included in all editions at no extra cost
Everything business needs

Governed metric definitions
Centralize metric logic in one place, so everyone works from the same definitions, without rewriting SQL.

Metrics you can trust
Define KPIs once and reuse them everywhere – across Looker Studio, Sheets, Excel and AI assistants – with full control over changes.

Define once, reuse everywhere
Write your KPI logic once, then apply it across reports, dashboards, and clients – no duplication, no rework.

Numbers you can check
Every report exposes the SQL that produced it. When a figure is questioned, the analyst re-runs the query against your own warehouse.
Frequently asked questions
What is a data mart in OWOX?
A Data Mart is a governed, reusable definition of data the analyst owns: a SQL query, a table, a view, a table pattern, a connector's output or a join of other marts, with an output schema that names and describes each field. Business users report on it in Google Sheets, Excel, Looker Studio, Slack, Teams, email or an AI assistant without writing SQL.
How do data marts differ from raw database tables?
Raw tables contain unprocessed data that requires SQL expertise to query correctly. Data marts apply business logic, joins, filters, and metric definitions — producing clean, ready-to-use datasets. They standardize how your organization interprets data.
Can I version and manage changes to data marts?
Yes. Changes to a Data Mart are published explicitly. Nothing downstream sees an edit until the analyst publishes it.
What outputs can data marts power?
Google Sheets and Excel reports, Looker Studio dashboards, scheduled Insights delivered to Slack, Teams, Google Chat or email, and questions asked in Claude or ChatGPT via OWOX MCP.
Is this included in the free tier?
Yes. Data Mart creation and management is available in every edition, including the free Data Intern plan and the Community self-managed edition.
Do I need SQL skills to create data marts?
Usually, yes. A SQL Data Mart needs SQL; a Table, View or Pattern mart needs none. The analyst defines the logic once, and business users consume it in Sheets, dashboards or AI without writing SQL.
Every claim has a receipt.
Real things real customers said — each quote pinned to a specific claim, straight from the quotes database.
 Nodari RizunFounder & CEO, Pürblack®
“AI, by the nature of the models, will hallucinate. And because of that, you need something which will create guardrails to ensure that there are no hallucinations, that you can trust your data.”
 Mark SimmonsCMO, Pürblack®
“We had six or seven different channels and no single source of truth — it was almost impossible, a lot of guesswork.”
Nodari RizunFounder & CEO, Pürblack®“We regained time. And time is the one resource that never comes back.”
Ready to structure your data?
Define your Data Marts once and let every report reuse them.