Report Output Controls
One Data Mart. A Different Cut In Every Report.
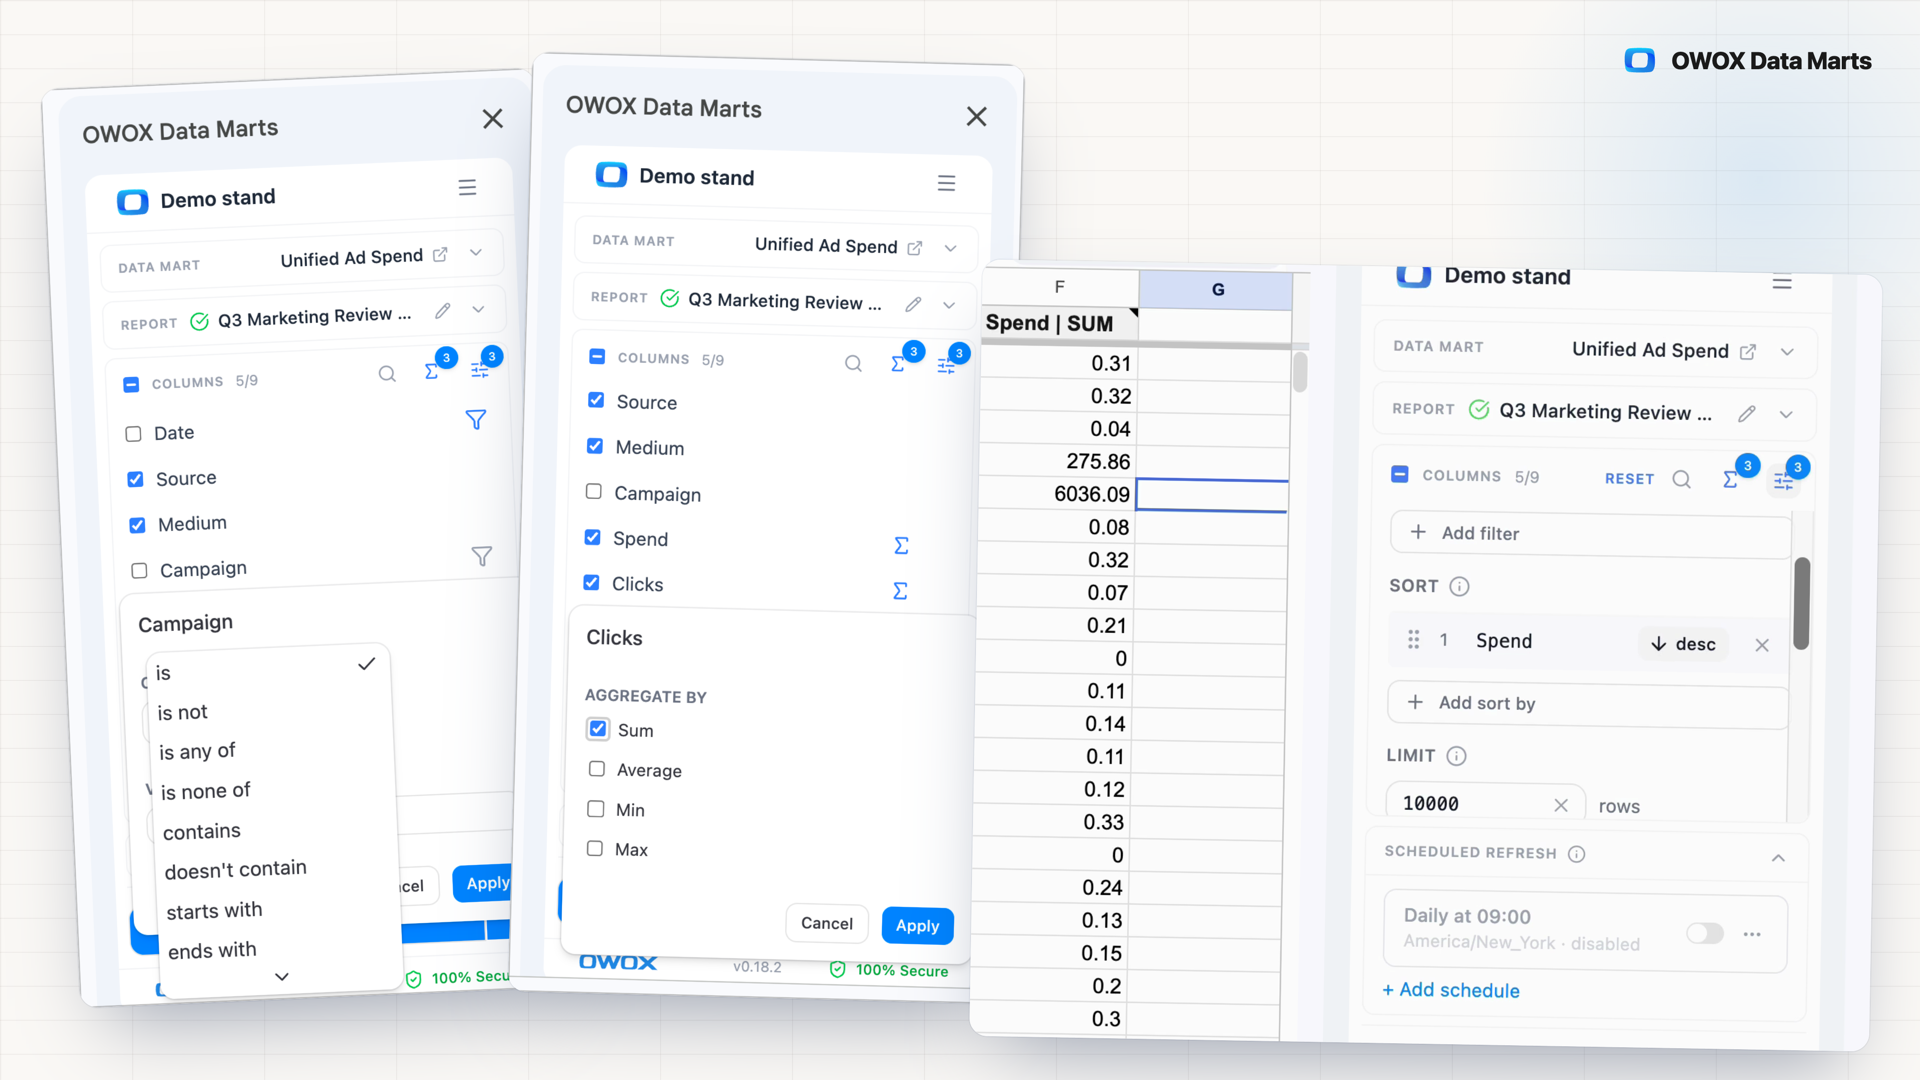
Each new cut used to become another Data Mart copy or a hand-trimmed export, until two reports showed different ad spend. Output controls give every report its own filters, slices, sort, row limit and aggregations over one Data Mart, run in your warehouse.
Get started freeRead the docs →
Does this fit your stack?
Why OWOX
A marketer asks you why the regional sheet and the dashboard show different ad spend: each cut was built as another near-duplicate Data Mart or a hand-trimmed export, and the copies drifted. Output controls give every report its own filters, slices, sort, row limit and aggregations over one Data Mart, applied at query time in your warehouse.
- Aggregations run as one GROUP BY query in your own storage, and every report shows the exact SQL behind its numbers.
- Every cut reads the same Data Mart definition: a report applies only the aggregations the Data Owner allows on each field, and the Data Mart's SQL never changes.
- Set once on the report in Google Sheets, Microsoft Excel or Data Studio and reapplied on every run; a Last N days filter rolls forward on its own.
Every new cut became a copy, and the copies disagree
Just my region, just last month: each cut became a SQL tweak, a near-duplicate Data Mart or a hand-trimmed export. Every copy is one more definition to keep in step, and when they drift, you are the one asked which number is right.
THE DATA OWNER
Govern the cuts, not every report
On the Data Mart's schema, set each field's role and the aggregations reports may use: SUM, AVG, MIN and MAX for numbers; Count and Count Unique, among others, for text. Reports then shape their own output at query time; your SQL stays as written.
One definition in the Data Mart. The cut lives on the report.
THE BUSINESS USER
Narrow it yourself, in the report you have
Open Output controls on your report: filter to your region, sort by spend, cap it at 100 rows, or sum revenue by month. No SQL, no new request, and the Data Mart everyone else reports on stays untouched.
Your cut, on the Data Owner's definitions.
One Data Mart instead of one per question — Output controls keep one definition and put each variation on the report that needs it, so a new cut adds no copy for you to maintain.
For Data Owners
Stop writing a query per variation
Filters, slices, sort, limit and aggregations sit on the report and run at query time, so the next variation is a report setting, not another Data Mart for you to maintain.
Allowed aggregations, set per field
Each field carries a role, dimension or metric, and the functions reports may apply to it. Numbers default to SUM, AVG, MIN and MAX; narrow the set or switch aggregation off. A report cannot request a function the field does not allow.
Worked example: distinct sessions by date and source
Select date, source and sessionId, then set Count Unique on sessionId. The report returns one row per date and source, the same result as SELECT date, source, COUNT(DISTINCT sessionId) … GROUP BY date, source, built for your storage's dialect.
The SQL behind every cut
Preview the generated SQL from the report: the exact GROUP BY, aggregate expressions and date truncation, in your storage's dialect. Copy it into a standalone SQL Data Mart when a cut deserves to become a definition.
For Business Users
Get just the rows you need
Output controls sit on your report in Google Sheets, Microsoft Excel and Data Studio, and on the reports an AI assistant creates for you through OWOX MCP.
Filters that keep rolling
Pick a column, an operator and a value. Date filters take relative presets such as Last N days or Last month that re-evaluate on every run, so a rolling report stays current without editing the filter. Several filters combine with AND.
Slices for joined columns
When a report pulls columns from a joined Data Mart, a slice narrows that Data Mart before the join: only Active records from a CRM Data Mart, while every source row still comes through.
Sort, cap and summarize
Sort by one or more columns, cap the row count anywhere from 1 to 10,000,000, or bucket dates by month and sum. When a cap shrinks the result, OWOX clears the leftover rows it wrote to the sheet last time.
Compare plans
Everything business needs
The Data Mart stays untouched
Every report carries its own filters, slices, sort, limit and aggregations. The Data Mart's SQL and schema do not change, so other reports on it are unaffected.
Summed in your warehouse
Aggregation runs as one GROUP BY query in your own storage: Google BigQuery, Snowflake, AWS Redshift, AWS Athena or Databricks. Nothing is recomputed downstream.
Only the functions allowed
Reports apply only the aggregations the Data Owner allows on each field. A date defaults to MIN and MAX and cannot be summed.
Rows sized for the destination
A row limit and filters keep a report inside what the destination holds: about 1,048,576 rows per Microsoft Excel sheet, 1,000,000 per Data Studio request.
Frequently asked questions
How is this different from a new Data Mart per request?
A new SQL Data Mart per variation copies the logic, and copies drift until two reports show different ad spend. Output controls keep one Data Mart and put the variation on the report: its filters, sort, limit and aggregations run at query time over the same definition.
Where do output controls work?
On every report built on a Data Mart: in the web app, in the OWOX Extension for Google Sheets, in the Microsoft Excel add-in, in Data Studio, and on email, Slack, Microsoft Teams and Google Chat reports. AI assistants connected through OWOX MCP use the same filters, slices, sort, limit and aggregations.
Who decides which aggregations a report can use?
The Data Owner, per field, on the Data Mart's schema: each field's role and its allowed aggregations. Whoever builds the report picks from that set. Numeric fields default to SUM, AVG, MIN and MAX, with percentiles and ANY_VALUE available; COUNT is not offered on numbers.
What is the difference between a filter and a slice?
A filter drops rows from the final result, after the joins. A slice narrows a joined Data Mart inside its own subquery before the LEFT JOIN, so source rows with no match still come through, with empty joined columns. Slices appear only when the report has joined columns.
What happens to a ratio like CTR when a report aggregates?
If the Data Owner defined CTR as a calculated field, it recomputes at the report's grain instead of averaging per-row ratios. A filter on it compares the recomputed value: ctr > 0.5 by country keeps the countries whose own CTR clears it.
How do I check what a report returns?
Preview the generated SQL from the report. It shows the exact filters, GROUP BY, aggregate expressions and date truncation in your storage's dialect, ready to run in your warehouse. Totals come back as a separate block through OWOX MCP and the HTTP Data API, not in Google Sheets or Data Studio.
Every claim has a receipt.
Real things real customers said — each quote pinned to a specific claim, straight from the quotes database.
 Nodari RizunFounder & CEO, Pürblack®
“AI, by the nature of the models, will hallucinate. And because of that, you need something which will create guardrails to ensure that there are no hallucinations, that you can trust your data.”
 Mark SimmonsCMO, Pürblack®
“We had six or seven different channels and no single source of truth — it was almost impossible, a lot of guesswork.”
Nodari RizunFounder & CEO, Pürblack®“We regained time. And time is the one resource that never comes back.”
- 0.37.0Unchecking a column in the OWOX Extension no longer fails Save & Run
- 0.36.0Automatic aggregations you can change
- 0.35.0Handle array fields safely in reports
- 0.35.0Reports no longer deliver duplicate rows when no aggregation was chosen
- 0.34.0Keep report output controls consistent with the column selection and the Data Mart schema
Shape your next report, not another Data Mart
Open Edit report, click Output controls under Report Columns, and add a filter, a sort or a limit.
- Internal OWOX data as of 2026-10-02
- G2 reviews of OWOX
- npm installs stat
You are booked. The invitation is on its way to , with the calendar invite and the meeting link.