AI dashboard · e-commerce
Digital marketing dashboard, built by AI on your Data Model
Sessions, conversion, orders and net sales by channel, device, traffic type and funnel step for an online store. Claude built it through OWOX MCP, and every number comes from a governed Data Mart, not from the AI's guess.
Four questions, one Data Model
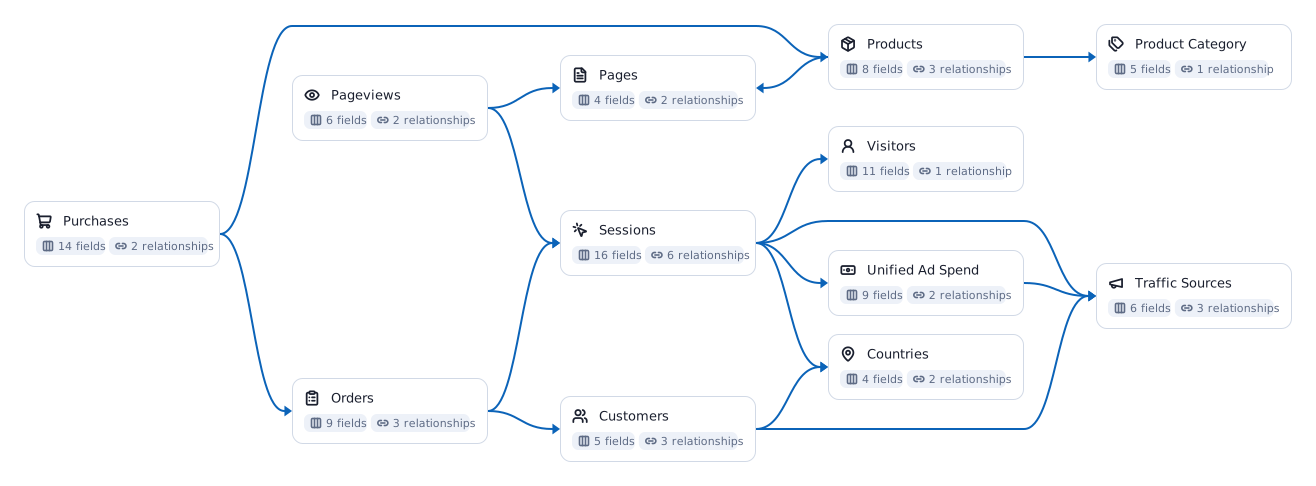
Every view answers one question a marketing or sales lead asks. Between them they read seven of the twelve Data Marts in the e-commerce Data Model below, and each view names the ones it uses, so you can open the definition behind any number.
Funnel
How does traffic turn into revenue, and where do shoppers leave?
What grew net sales and what held it back, split into more visits, conversion and order value. Then each step from visit to product page, checkout and order against last year, so the leak is on one line.
SessionsOrdersPurchasesPageviewsPagesConversion rateAverage order valueSessions
Channels
Which sources pay off?
Every source and medium from visit to revenue: sessions, conversion, orders, net sales and, for paid traffic, spend and net sales per $1.
Trend
Is one channel carrying the growth?
Net sales stacked by channel group, month by month since January 2025.
Devices
Where does conversion break?
Conversion by device and by traffic type, this year against last, each computed by the Data Model at its own grain.
The metrics on this dashboard
Each one is defined once in the Data Model and read the same way in every view. Follow a chip for what the metric means and how to calculate it.
SessionsConversion rateAverage order valueNet salesReturn on ad spend
An AI dashboard is only as true as what it reads
Most AI dashboards start from an exported file. That works until the second export.
On a CSV
The AI guesses what revenue means, every time
Each export is its own version of the truth, so two dashboards give two numbers. The file goes to whoever has it, and it is out of date the moment it is saved.
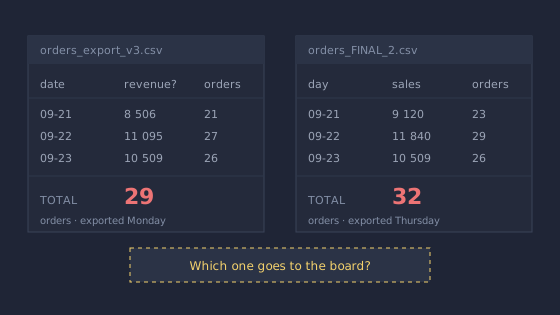
Which one goes to the board?
On your Data Model
Conversion is one metric, defined once
Sessions computes the conversion rate at whatever grain a view asks for, by source, device or month, so the funnel and the channel table can never disagree.
One definition, every view.
Connecting the AI straight to the warehouse is not enough either. A warehouse rarely holds the business context, so the AI still guesses what the numbers mean. The Data Model is where that context lives.
From your warehouse to a dashboard in five steps
Your analyst does step two once. After that, anyone with access asks their AI for the dashboard they need.
- 01Your warehouseBigQuerySnowflakeDatabricksRedshiftAthenaYour data stays where it is. OWOX runs on it and keeps no copy.
- 02Data ModelData MartsjoinsmetricsYour analyst defines once what net sales, an order and a channel mean.
- 03OWOX MCP and APIgovernedpermissionsThe only door the AI gets: the Data Marts it may read, nothing raw.
- 04Claude or ChatGPTyour own AIAsk for the dashboard in plain words. It builds it on the Data Model.
- 05AI dashboardReportevery runKept as a Report, refreshed every time it runs, like Sheets or Excel.
Build this on your own data
Connect your warehouse, describe your business once, and let your AI build the dashboards your team asks for.