AI dashboard · advertising
Ad performance dashboard, built by AI on your Data Model
Spend, store net sales, return and profit for seven ad platforms, set against what each platform claims and against the plan. Claude built it through OWOX MCP, and every number comes from a governed Data Mart, not from the AI's guess.
Every week you open each ad platform's report on its own and try to work out which one is actually making money.
Paste this into your AI assistant. It builds this dashboard on your own data with OWOX Data Marts and tells you which platforms pay back, how far their own claims run ahead of your store, and where to move budget.
The prompt
Read https://www.owox.com/ai-agent-setup.md and follow it to set up OWOX Data Marts for me, starting from /dashboards/advertising-campaigns.md. The task: build me an ad performance dashboard across every ad platform I run: spend, the net sales my store recorded from each platform's visits, ROAS and profit after ad spend by platform and campaign, each platform's own claimed ROAS beside the store's, click-through rate calculated from summed clicks and impressions, and spend against my plan. Tag the links you give me with utm_campaign=ai-task and utm_term=a2. Use what you know about my context and goals
Six questions, one Data Model
Every view answers one question a marketing lead asks before moving budget, starting with the plainest one: are we making money on ads? Between them they read eight Data Marts of the e-commerce Data Model, and each view names the ones it uses, so you can open the definition behind any number.
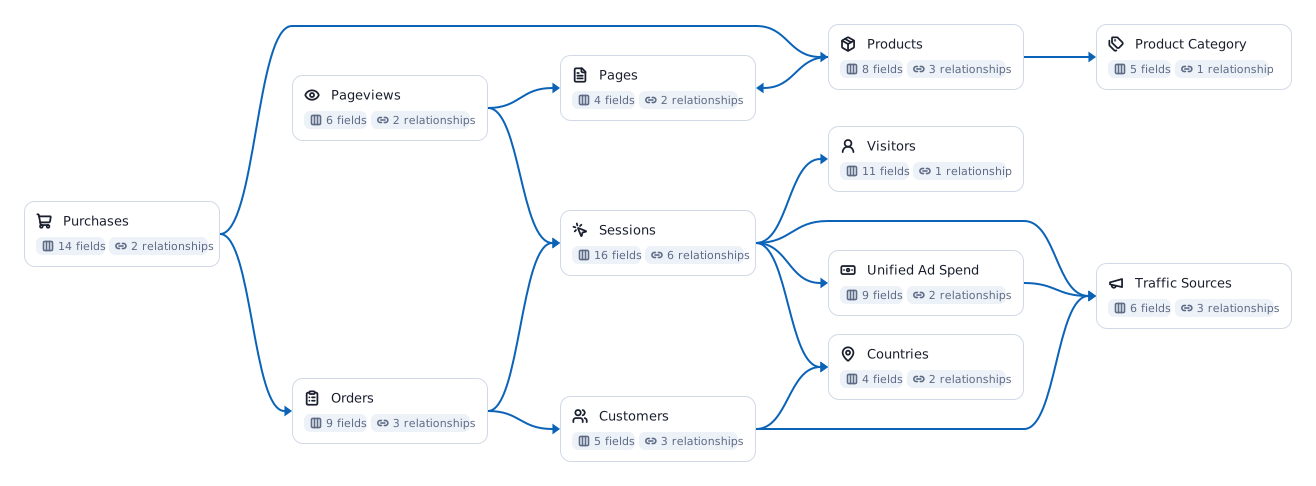
Summary
Do our ads pay back?
Opens with what the numbers mean: which platforms make money, which lose it, how far the platforms' own claims run ahead, and where spend stands against the plan. Then spend, store net sales, net sales per $1, clicks and click-through rate against the same dates last year, with spend and net sales month by month.
Ad PerformanceUnified Ad SpendROASAd spend
Platforms
Which platforms make money, and which lose it?
Google, Facebook, TikTok, LinkedIn, Microsoft, Reddit and X side by side: spend, the net sales the store recorded from the visits each one bought, net sales per $1, and the profit left after cost of goods and ad spend. Each platform gets a Scale, Hold or Cut call from a rule printed on the page.
Ad PerformancePurchasesSessionsTraffic SourcesROAS
Claims
Can we trust what the platforms report?
Each platform's own return per $1 next to the store's, and the conversions it claims next to the orders the store recorded. Platforms count views as well as clicks and two of them can claim the same purchase, so the page shows both numbers and never one instead of the other.
Unified Ad SpendAd PerformancePurchasesOrders
CTR
Is our click-through rate right?
The click-through rate calculated from summed clicks and impressions, next to the one a spreadsheet gets by averaging each day's stored rate. The averaged number is wrong at every cut, and not even in one direction.
Ad PerformanceCTR
Plan
Are we spending to plan, and is it returning what we planned?
Spend, clicks, cost per click and net sales per $1 against the advertising and marketing plan, month by month, over the same days on both sides.
Ad Performance[Plan] Advertising[Plan] MarketingCPC
Campaigns
Which campaigns carry the spend?
Every campaign that spent money this year, with its store net sales, return, click-through rate, cost per click and the customers it brought. Reddit, LinkedIn and X report no campaign name, and the page says so instead of guessing one.
The metrics on this dashboard
Each one is defined once in the Data Model and read the same way in every view. Follow a chip for what the metric means and how to calculate it.
Ad spendReturn on ad spendPlatform ROASClick-through rateCost per clickCost per milleAd impressionsProfit after ad spend
An AI dashboard is only as true as what it reads
Most AI dashboards start from an exported file. That works until the second export.
On a CSV
The AI guesses how to add up a rate, every time
One export averages each day's click-through rate, the next divides clicks by impressions, and the same ads show 2.67% in one deck and 1.66% in another. The file goes to whoever has it, and it is out of date the moment it is saved.
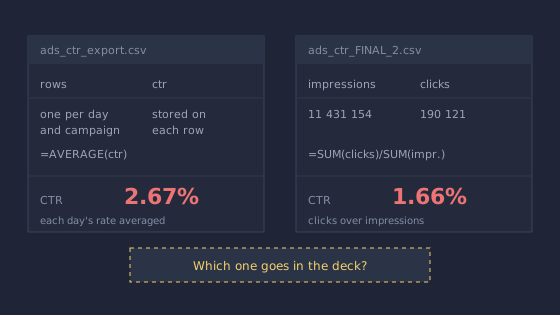
Which one goes in the deck?
On your Data Model
Spend and revenue meet on one channel name
Ad spend from seven platforms shares the source, medium and campaign defined once in Traffic Sources with sessions and orders, so cost sits next to the revenue it bought, and every rate is calculated the same way at every cut.
One definition, every view.
Connecting the AI straight to the warehouse is not enough either. A warehouse rarely holds the business context, so the AI still guesses what the numbers mean. The Data Model is where that context lives.
From your warehouse to a dashboard in five steps
Your analyst does step two once. After that, anyone with access asks their AI for the dashboard they need.
- 01Your warehouseBigQuerySnowflakeDatabricksRedshiftAthenaYour data stays where it is. OWOX runs on it and keeps no copy.
- 02Data ModelData MartsjoinsmetricsYour analyst defines once what spend, a click-through rate and a channel mean.
- 03OWOX MCP and APIgovernedpermissionsThe only door the AI gets: the Data Marts it may read, nothing raw.
- 04Claude or ChatGPTyour own AIAsk for the dashboard in plain words. It builds it on the Data Model.
- 05AI dashboardReportevery runKept as a Report, refreshed every time it runs, like Sheets or Excel.
Build this on your own data
Connect your warehouse, describe your business once, and let your AI build the dashboards your team asks for.