
Free Users vs. Paid: How Usage Patterns Reveal What Converts
Uncover which features turn free users into paying customers. Learn how to compare user behavior easily with OWOX BI's product analytics solution.


Why do some users upgrade while others don’t?
The answer often lies in how they use your product. Free users might just browse or test features, while paid users engage more, explore key tools, and stay longer. Comparing these patterns helps you spot what actually leads to conversions – and how to guide more users to upgrade.
Understanding these patterns can improve your product strategy. In this article, we’re covering the kind of usage insights that show what makes users convert, and how to track them without writing complex SQL or building custom dashboards from scratch.
Why Free-to-Paid Conversion Analysis Matters
Free-to-paid conversion is the process where users shift from using your product for free to becoming paying customers. The free-to-paid conversion rate tracks how many users make this transition and is a key metric for SaaS products that use freemium or trial-based models. It helps measure how well your product turns interest into revenue.
This rate matters because it shows if users see enough value to invest in your product. A strong conversion rate leads to better customer retention and long-term engagement. It also helps businesses spot what’s working, where users drop off, and how to improve their growth strategy.
Challenges of Relying on Ad Hoc Reporting for Conversion Pattern Analysis
Ad hoc reporting works well for quick checks, but when used too often, it can limit visibility, slow down teams, and cause confusion. Here are the key challenges that come up when relying on it too much.
- Isolated Reports Create Data Silos: Since ad hoc reports are built separately for specific needs, data often gets trapped in silos. This makes it hard to connect insights across teams or see how different parts of the product are performing together.
- Too Much Focus on One-Off Insights: These reports work well for short-term questions but can miss the bigger picture. Over-reliance makes it hard to spot long-term patterns or make strategic improvements across the product.
- Lack of Visuals Slows Down Decisions: Ad hoc reports usually lack clear visuals or dashboards. This makes them harder to interpret, especially for non-technical team members, and delays action on key insights.
- Inconsistent Metrics Across Teams: Without a shared framework, different people may define the same metrics in different ways. This misalignment creates confusion and can lead to poor decisions.
- Low Data Skills Limit Report Usefulness: Even with simple tools, teams need a basic understanding of data. Without it, they may misunderstand results or not use the reports at all, reducing the value of the insights gathered.
What a Prebuilt Product Analytics Model Can Solve
A prebuilt product analytics model takes the guesswork out of analysis. Instead of building everything from scratch, teams get ready-to-use reports and trusted metrics, making it easier to understand user behavior and improve decisions without extra effort.
Saving Time and Cutting Costs
Prebuilt product analytics models save teams from spending countless hours building data pipelines, structuring event data, and writing custom queries from scratch. Analysts no longer need to manually clean, transform, and structure data just to get started with basic reporting.
This reduces the time and cost usually spent on engineering and manual analysis. With ready-to-use models, businesses can start getting answers faster, with fewer errors and less back-and-forth. The time saved can then be spent on more strategic tasks, like improving user journeys or testing product changes.
Consistent Metrics Across Teams
When every team builds its reports, it’s easy for definitions and numbers to vary. Prebuilt models fix this by creating one trusted source of truth. Everyone, from product to marketing to leadership, sees the same consistent metrics.
This reduces confusion, prevents reporting mistakes, and builds alignment across teams. Since the model structures the data in the same way every time, it’s easier to understand insights and take action. With shared visibility, departments can collaborate better and make faster, more informed decisions based on unified data.
Reusing Models for Multiple Product Insights
A major benefit of prebuilt models is that they don’t have to be rebuilt for every analysis. The same model can be applied to different features, customer journeys, or lifecycle stages without starting over.
Whether you're looking at product usage by region, analyzing drop-off during onboarding, or measuring retention after a new release, a reusable model supports all of it. It saves time, ensures consistency, and helps scale analytics across different teams or brands without repeating setup work.
Revealing Deeper Patterns and Behaviors
Prebuilt models provide a reliable structure for ongoing analysis, which helps reveal long-term patterns. Since the data is tracked and measured in the same way over time, it becomes easier to spot important trends and behavioral insights.
You can detect which features drive upgrades, when users drop off, or what interactions lead to higher retention. These deeper patterns often get lost in ad hoc reports but become clear when using a consistent, structured model for all analysis.
Adapting to Changing Business Needs
Business needs can shift fast, new features launch, customer segments evolve, and growth priorities change. Prebuilt models can be updated to reflect these changes quickly, without needing to build new ones from scratch.
This flexibility makes it easier to stay aligned with business goals. Instead of starting over, teams can simply adjust the model and continue tracking the right data. It helps keep analytics useful and relevant, even as your product and strategy evolve.
Meeting Compliance and Data Security Standards
Prebuilt models are often developed with compliance in mind. This means they include safeguards for handling sensitive data, such as user IDs, email addresses, or other personal information, following industry rules like GDPR or CCPA.
Using a model built for security helps avoid mistakes in how data is shared or stored. It also ensures that reports stay within legal guidelines and your data team doesn’t need to check every report for compliance. That saves time and reduces legal risk.
Minimizing Project Risks
Starting from scratch every time increases the chances of mistakes, from incorrect data joins to missing filters or broken calculations. Prebuilt models reduce these risks by offering a tested framework that already works.
With fewer errors and more reliable outputs, data projects move faster and smoothly. Teams avoid delays caused by debugging or misalignment, and decision-makers can trust the insights they receive. It creates a safer, more efficient way to run analytics and grow with confidence.
How to Build a Free-to-Paid Conversion Strategy Around Feature Usage
To improve free-to-paid conversions, it’s important to focus on how users interact with your product. By tracking feature usage, you can design smarter onboarding, highlight high-value tools, and create a strategy that turns more free users into paying customers.
Identify and Highlight High-Impact Features
Before building your free trial strategy, it’s important to know which product features drive the most value. Analyze your current user data to identify what features your paying customers use the most; these are your high-impact features.
Once you’ve found them, include these in your trial offering, but don’t give them away entirely. You can restrict access by time, limit how often they’re used, or add a watermark. This allows users to experience value while still encouraging them to upgrade for full access.
Experiment with Trial Lengths Based on Usage Patterns
There’s no perfect trial length for every product; what works best depends on how users interact with your features. Start by testing different trial durations and monitoring how quickly users reach their Aha! moment.
Track how long it takes for users to understand the core value of your product and reach activation. If your trial is too short, users might not get there. If it’s too long, you delay monetization. Use the data from these experiments to find the sweet spot that maximizes conversion.
Design a Minimum Viable Onboarding (MVO) Experience
First impressions count; the initial onboarding experience is where users start to understand your product. Keep it simple and guide them to your most valuable features as early as possible.
Rather than showing everything at once, focus on the minimum set of actions that help users reach their Aha! moment. A clear, well-structured onboarding playbook makes this easier. Once users understand the basics and see value, you can introduce more advanced features later, improving their chances of converting to paid users.
Personalize Onboarding Based on User Personas
Different users have different goals. Some may be marketers, others developers, and each persona values different features. Personalizing onboarding helps users quickly see how your product fits their unique needs.
Use a short welcome prompt to collect information like their role, job to be done, or location. Then, tailor their onboarding journey accordingly. When users feel that your product “gets” them, they’re more likely to stay engaged, explore the right features, and eventually convert into paying customers.
Continuously Collect Feedback and Optimize
A strong free-to-paid conversion strategy is never done. It requires constant testing, feedback, and fine-tuning. Pay attention to user behavior and conversion data throughout the trial.
Once the trial ends, send out quick NPS surveys and ask follow-up questions to understand how users felt about the experience. Their answers give you real insights into what worked and what didn’t. Use this feedback to improve onboarding, trial timing, and messaging, and keep evolving your strategy for better results.
Comparing Free vs. Paid Feature Usage (With SQL Example)
Understanding which features influence upgrades starts with comparing how free and paid users use your product. This comparison shows you what features catch users’ interest early, and which ones keep them engaged after they become paying customers.
Using SQL, you can analyze your event or activity logs to see which features are most used by each group. This helps product managers and analysts spot which features lead to conversions and which ones improve retention over time.
Basic SQL Example: Comparing Free vs. Paid User Feature Usage
Suppose you have an events table with the following fields:
- user_id (unique user identifier)
- plan_type (e.g., 'Free', 'Paid')
- feature_name (the name of the feature used)
- event_timestamp (when the feature was used)
Here’s a basic SQL query:
1SELECT
2  s.plan_name,
3  f.name AS feature_name,
4  COUNT(e.id) AS usage_count
5FROM `owox-d-ikrasovytskyi-001.Product_Data_Model_v1.event` e
6JOIN `owox-d-ikrasovytskyi-001.Product_Data_Model_v1.feature` f
7  ON e.feature_id = f.id
8JOIN `owox-d-ikrasovytskyi-001.Product_Data_Model_v1.subscription` s
9  ON e.user_id = s.user_id
10WHERE f.name IS NOT NULL AND s.plan_name IN ('Free', 'Paid')
11GROUP BY s.plan_name, feature_name
12ORDER BY s.plan_name, usage_count DESC;
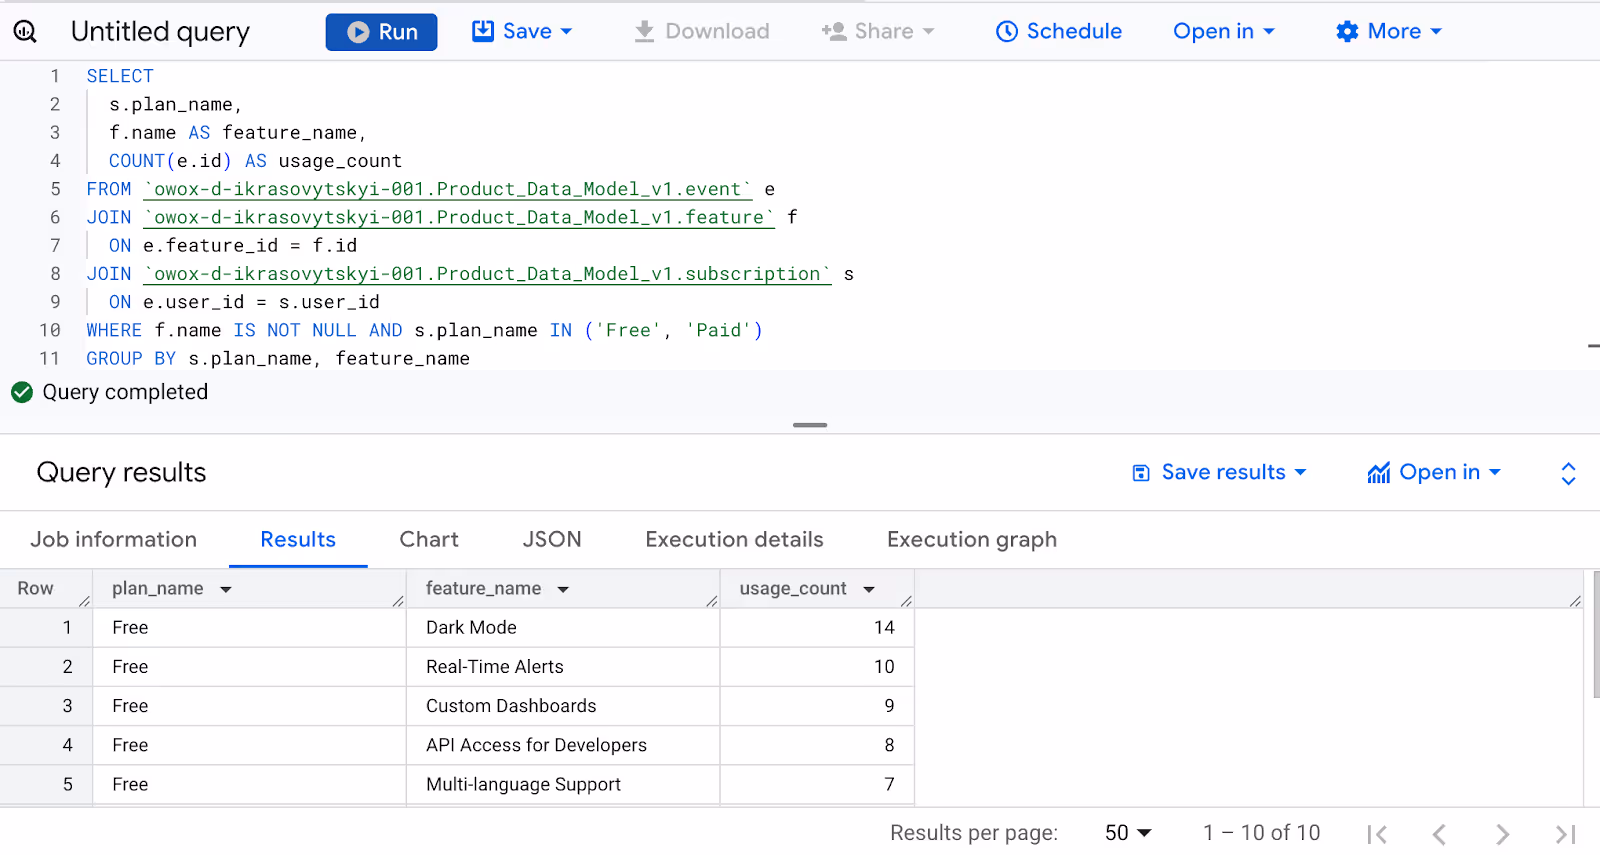
What This Query Does:
- Groups the data by plan_type and feature_name.
- Counts how many unique users used each feature during the selected time period.
- Orders the results to show the most-used features by free and paid users.
Insights You Can Find:
- Features mostly used by free users, these are great to highlight during onboarding or trial.
- Features popular among paid users, which you can promote earlier in the user journey.
- Identify “aha moments” and key feature interactions linked to higher upgrade rates.
How OWOX BI Chat Reporting Answers Free vs. Paid Usage Questions
OWOX BI’s Chat Reporting makes it easy to compare free vs. paid user behavior without writing SQL. Product teams can simply type a question and get instant, reliable answers, even if they don’t have any technical background.
Ask Questions in Plain English, Get Instant Answers
With OWOX BI Chat Reporting, anyone on your team can explore data without writing a single line of SQL. You can type natural questions like “Top features used by free users?” or “Which features drive upgrades?”, and OWOX BI instantly turns that into the correct SQL query behind the scenes.
This makes data accessible to everyone, not just analysts. Product managers, marketers, and other non-technical team members can get fast answers to important questions, helping them make better decisions without delays or back-and-forth with the data team.

Powered by a Trusted Product Analytics Model
OWOX BI answers your questions using a reliable, prebuilt product analytics model. This model is built from structured, verified data that connects key objects like users, events, features, subscriptions, and trials. You don’t have to create ad hoc reports or manually piece data together — the model does it for you.
Because every analysis runs on this trusted foundation, your insights are always consistent and accurate. Whether it’s comparing free vs. paid feature usage or tracking churn patterns, you get clean, ready-to-use data without the hassle of messy spreadsheets or one-off queries.
Example Questions You Can Ask in OWOX BI Chat
OWOX BI Chat understands simple, natural questions and gives back clear answers. Here are some real examples you can use:
- “Which features are used most by free users in the last 30 days?”
- “What features are most popular among paying users?”
- “Show feature usage comparison between free and paid users.”
These kinds of questions help you instantly explore usage patterns, spot trends, and understand what drives upgrades, all without needing to build charts or pull raw data.

No SQL Needed, but Full SQL Access If You Want It
Even though Chat Reporting is designed for simplicity, it doesn’t limit power users. Every answer can be traced back to the actual SQL used, and you can view, edit, or export it anytime you want.
This gives analysts full control when they need to go deeper or customize queries. It’s the best of both worlds: non-technical users can use chat to get what they need, and technical users still have full transparency and flexibility when digging into the data further.

Connect Your Data and Start Finding Conversion Insights
The final step is to connect your own product data to the OWOX BI analytics model. You don’t need to build anything from scratch or spend hours setting up reports. Once connected, your data is automatically organized and ready to use within the model.
From there, your team can immediately start asking questions through the Chat Reporting interface. Whether it’s comparing free vs. paid feature usage or tracking upgrade behavior, you can get insights without writing SQL or creating custom dashboards. It’s quick, accurate, and designed for everyone.
Discover What Drives Free Users to Upgrade with OWOX BI
Stop guessing what makes free users convert; find out with real data. OWOX BI’s ready-to-use product analytics model helps you compare feature usage, track upgrade patterns, and identify the actions that lead to paid subscriptions.
With Chat Reporting, anyone on your team can explore these insights without writing SQL. Just connect your data, start asking questions, and get instant answers. Try OWOX BI for free and discover what truly drives free-to-paid conversions in your product.
Frequently asked questions


Finally, a tool that doesn't ask business users to learn a new dashboarding UI. Our marketing team already knows Sheets. OWOX just delivers the right data.
Joinable data marts concept was the thing that sold us. We can now use the semantic layer without building one.
Self-hosted the OSS version on Digital Ocean. Zero vendor lock-in. Contributed a Shopify connector back in week two.