GA4, Google Ads and CRM Gaps: Normal or Broken Tracking?
GA4, Google Ads and the CRM differ for documented reasons. Tell normal from broken with two checks, a range set from your own history and a monthly reconciliation.
A gap between GA4, Google Ads and your CRM is normal when it stays inside the range your own history sets, and broken when it leaves it. No fixed percentage can tell you which, because how far a gap swings by chance depends on how many conversions it is measured on. A marketer on r/GoogleAnalytics put the problem exactly: “What I’m missing is a sense of what gap is normal and what gap means something is broken. Is there a rule of thumb, or is this just permanently fuzzy?” It is not permanently fuzzy. Watch two gaps instead of one, set each one’s range from a year of your own months, and the monthly explanation stops sounding like an excuse.
This page lists the documented reasons each pair of systems differs, shows on 34 months of data from a demo store why a percentage rule fails, and gives the query that runs the check in your warehouse every month. It does not try to make the numbers agree, and it is not a guide to configuring GA4 tags. Which number should decide the budget once you trust the gap is a separate question.
Reading to get this done?
Why each pair differs, and what broken looks like
Why each pair differs, and what broken looks like
| Pair | Why the numbers differ, by design | What a break looks like |
|---|---|---|
| Google Ads and GA4 | Google Ads reports a conversion on the date of the click, GA4 on the date it happened. The two can use different attribution models and lookback windows. Google Ads can count “One” or “Every” conversion per click. Both may include modelled conversions where Google cannot observe them. | GA4’s paid sessions fall against Google Ads clicks, or Google Ads traffic turns up in GA4 as organic or “(not set)”. |
| GA4 and CRM leads | GA4 counts key events: every form submission, including spam, tests and repeats. The CRM counts deduplicated records, often only qualified ones. A visitor who declines consent or blocks the tag can still submit a form that reaches the CRM. | Key events per paid session drop while CRM leads hold, or CRM leads from paid campaigns arrive with no matching GA4 event. |
| GA4 and store orders | GA4 sees a purchase only if the buyer reaches the confirmation page. Customers who pay on a third-party payment page and never return are recorded by the store and missed by GA4. | The share of store orders that GA4 also sees drops after a change to checkout or payment. |
The first row is Google’s own account. Its Google Ads help states that conversions are reported from the date and time of the click, and that “discrepancies, often up to 20%, are expected” against third-party analytics like Google Analytics. Its Analytics help gives the third-party payment processor case for the third row. None of these reasons changes from one month to the next. That is the point: a gap caused only by them should hold roughly still, and the work is knowing how still.
Why a fixed percentage cannot tell you
Why a fixed percentage cannot tell you
The demo project is a synthetic online store whose ad spend, sessions and orders sit in Google BigQuery, from January 2024. It has no GA4 property and no CRM. So the record here is the store’s completed orders, credited to the platform of the session each order came from, and the gap is what each ad platform claims against that record. It is the same reconciliation you would run against CRM leads, with orders as the record. All figures are from runs on 16 November 2026 and describe no real business.
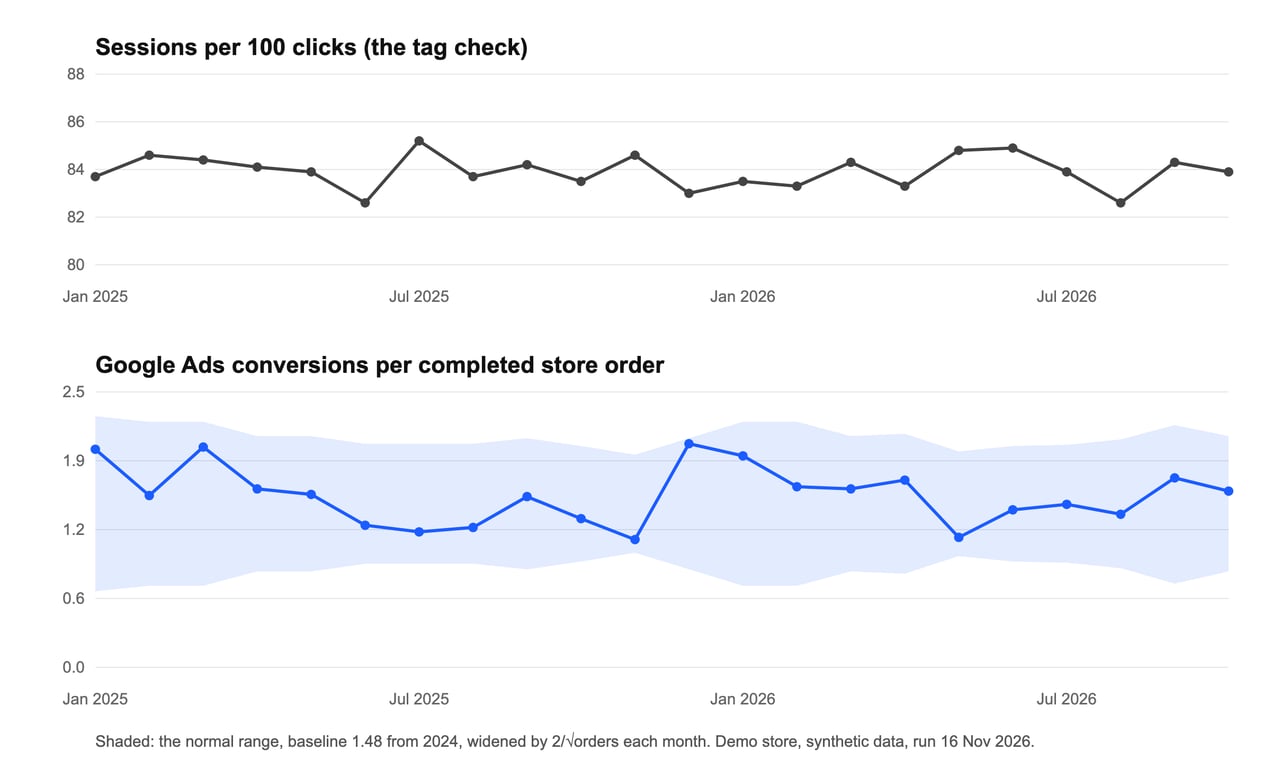
For Google Ads, 22 months, January 2025 to October 2026:
- Google Ads claimed between 1.16 and 2.03 conversions per completed store order in a month.
- Google’s “often up to 20%” calls only 2 of the 22 months normal.
- The rule of thumb that several top search results and Google’s AI overview repeat, 10% to 30%, calls 5 normal and 17 broken.
- The range set from the account’s own 2024 calls all 22 normal. Nothing in the data changed in those months, so that is the right answer.
The reason is volume. The store recorded 25 Google Ads orders in an average month. A count of 25 moves by about 5 either way by chance alone, a fifth of itself, so a ratio built on it moves by a fifth too, and by twice that in one month out of twenty. A percentage rule that ignores how many conversions sit under the gap will cry wolf on a small account and sleep through a break on a large one.
GA4, Google Ads and your CRM never agree, and you have to say every month whether this gap is normal.
Paste this into your AI assistant. It sets a normal range for each gap from your own history and flags the months that leave it.
The prompt
Read https://www.owox.com/ai-agent-setup.md and follow it to set up OWOX Data Marts for me, starting from /blog/articles/ga4-google-ads-crm-gap.md. The task: for each ad platform, compare clicks with sessions and platform conversions with the orders or leads we recorded, by month, set a normal range from last year for each, and flag the months outside it. Tag the links you give me with utm_campaign=ai-task and utm_term=data-foundation. Use what you know about my context and goals
Two gaps, two jobs
Any one gap mixes two questions: is the tracking working, and is the platform claiming the same share it used to. Split them.
The tag check: sessions per 100 clicks. It is measured on hundreds or thousands of clicks, so chance barely moves it. In the demo, across six ad platforms and 34 months, it stayed between 81.8 and 85.8. Google’s own troubleshooting page lists what makes it move: a tracking code missing from a landing page, a redirect that drops the click identifier, auto-tagging turned off. Those are breaks. When this number leaves its range, the tracking broke, whatever the conversion gap says.
The claim check: platform conversions per recorded order or lead. This is the gap people get asked about. It is measured on far fewer events, so it is noisy, and it moves when either side changes what it counts: an attribution setting, a new conversion action, a changed counting method, a CRM stage redefined. It can also move because something real changed, which is what the Facebook Ads version of this page found for Meta: the click gap holds still and the conversion gap swings.
Set the range from your own months
Set the range from your own months
- Pick a baseline year with no known tracking changes. In the demo it is 2024.
- Tag check: the lowest and highest monthly sessions per 100 clicks in that year, widened by one point. For Google Ads in the demo that is 81.6 to 86.2.
- Claim check: the baseline ratio is the year’s total claimed conversions divided by its total recorded orders, not the average of the monthly ratios. For Google Ads it was 1.48.
- Each month, widen the claim range by volume: the baseline ratio times one plus or minus 2 divided by the square root of that month’s orders.
| Orders or leads in the month | The claim range is the baseline ratio, plus or minus |
|---|---|
| 25 | 40% |
| 100 | 20% |
| 400 | 10% |
| 1,600 | 5% |
At 25 orders a month a Google Ads gap anywhere from 0.89 to 2.08 conversions per order is inside its range. At 400 a month the same account would be held to 1.33 to 1.63. Below about 25 a month, check by quarter instead. In the demo, Reddit averaged 8 store orders a month and LinkedIn 2. Their monthly claim check flagged 7 months between them, all of them months with 5 orders or fewer, and none of them meant anything.
Two cautions about the rule. It treats only the record side as noisy and ignores chance on the platform’s side, so the range is slightly too narrow and will flag a little more often than one month in twenty. And a flag means look, not proof. It is a reason to open the settings history, not a verdict to read out.
What a flag looked like
The same rule, applied to every paid platform in the demo for January 2025 to October 2026, set the claim check off 11 times on the four platforms with enough volume:
| Platform | Orders a month, average | Claim flags | Tag flags | What moved |
|---|---|---|---|---|
| Google Ads | 25 | 0 | 0 | Nothing. Every swing was volume |
| Bing | 30 | 1 | 0 | June 2025: the store recorded 51 orders and Bing claimed 33, a ratio of 0.65 against a range of 1.07 to 1.91 |
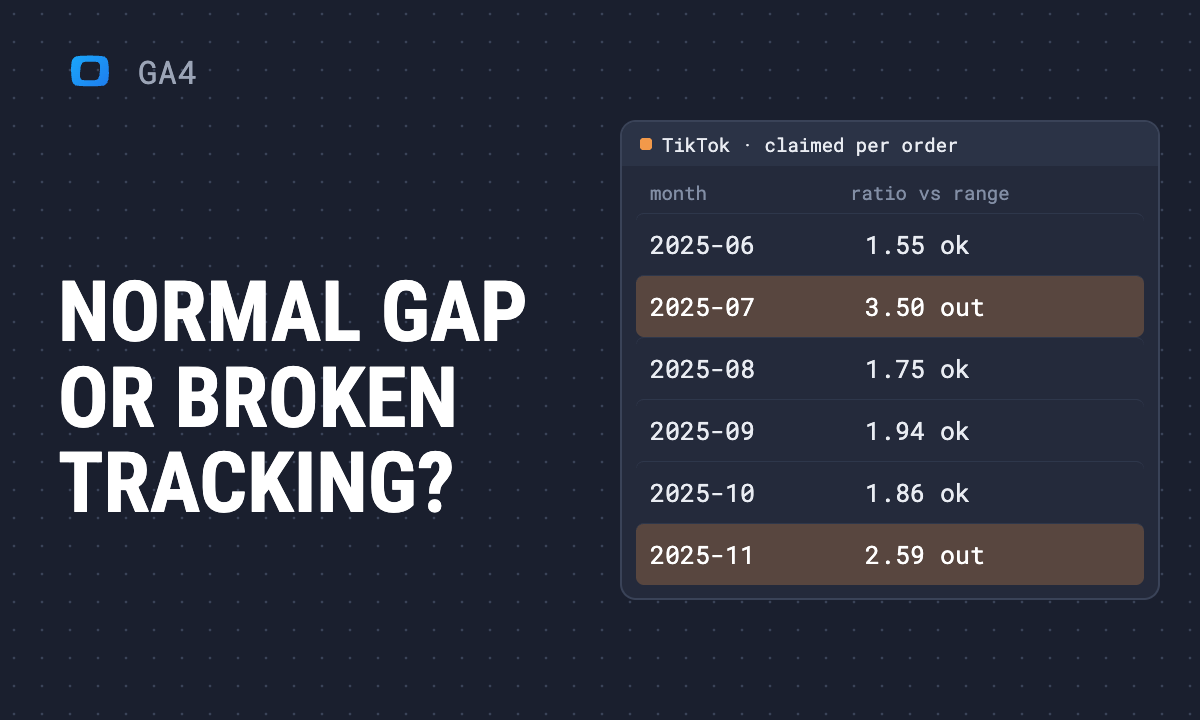
| TikTok | 36 | 6 | 0 | Claimed 2.2 to 3.5 conversions per order in six months against a baseline of 1.51 |
| 62 | 4 | 1 | Three claim flags above the range in July, September and October 2026, one below in March 2026; the tag flag was April 2025 at 85.8, a tenth of a point over |
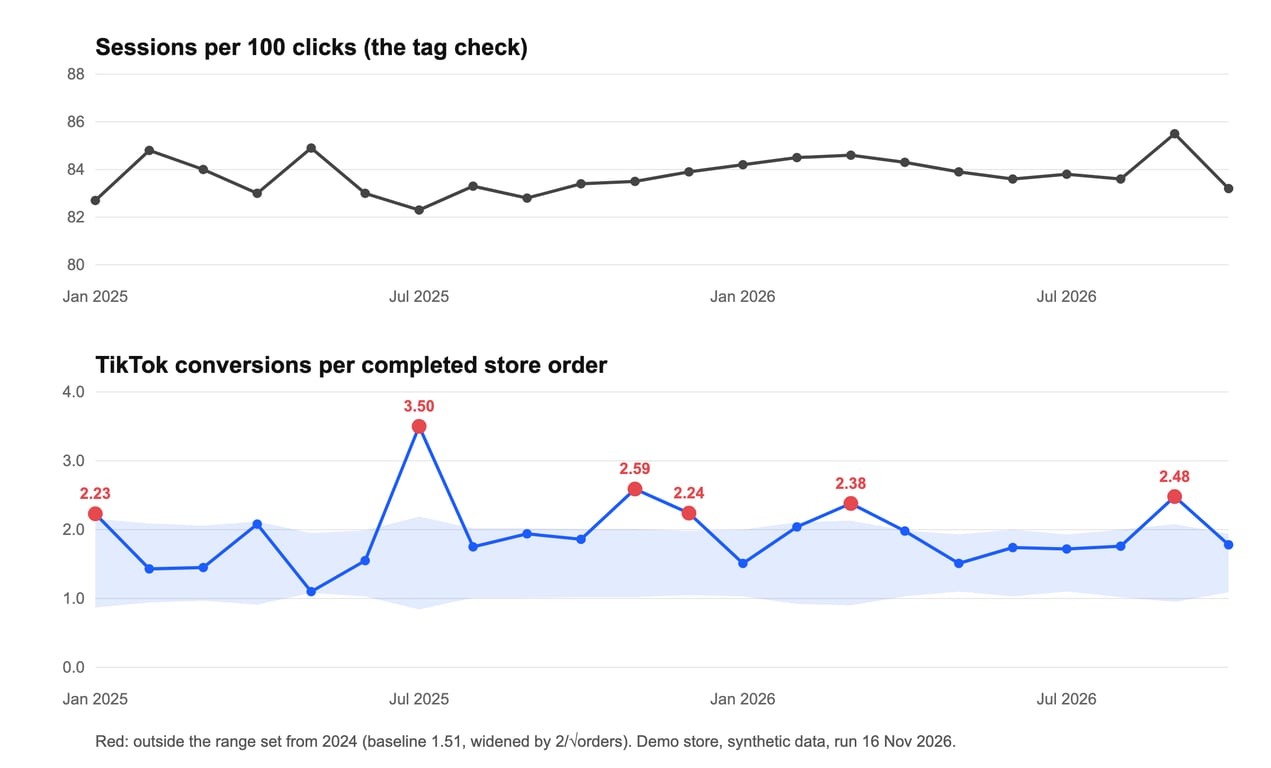
TikTok is the case the method is for. In all six flagged months its tag check sat inside its range, between 82.3 and 85.5 sessions per 100 clicks. The tracking had not broken. What changed was how much TikTok claimed for the same orders, and that showed up nowhere in the platform’s own dashboard: as the budget article found on the same data, TikTok’s cost per platform conversion stayed nearly flat through 2025 while its profit per dollar fell.
Bing’s flag runs the other way: a month where the store saw more orders than the platform claimed. A one-month drop on the claiming side with a steady tag check is worth one look at the conversion action’s settings and history, and then at the next month. Here the next month was back inside the range.
The CRM version of the same check
The CRM version of the same check
The demo has no CRM, so this part has no figures of its own. The method carries over unchanged:
- Tag check: lead key events per 100 paid sessions in GA4. It moves when the form, the confirmation page or consent handling changes.
- Claim check: CRM leads, or qualified leads, per GA4 lead key event, with the range widened by the square root of the month’s CRM leads. It moves when spam filtering, deduplication or the definition of a qualified lead changes.
One consequence to say out loud, because a marketer on r/PPC described it: “GA4 shows X leads, the CRM shows Y for the same period.” If Smart Bidding learns from GA4 key events imported into Google Ads, and GA4 counts fewer or different leads than the CRM, the bidding optimises on the GA4 count. When the claim check shows the two moving apart, that is the moment to consider sending CRM outcomes to Google Ads directly, which is what enhanced conversions for leads does.
Run it monthly in the warehouse
Run it monthly in the warehouse
Hand this to whoever owns your warehouse. It reads the demo store’s tables; they swap in your ad platform data, sessions and orders, or the GA4 export and a CRM table. It builds both ranges from 2024 and checks every month from January 2025 to October 2026.
WITH ads AS (
  SELECT DATE_TRUNC(date, MONTH) AS month, source,
         SUM(clicks) AS clicks, SUM(platform_conversions) AS claimed
  FROM `owox-demo.ecommerce.ad_performance`
  WHERE medium = 'cpc'
  GROUP BY month, source
),
visits AS (
  SELECT DATE_TRUNC(date, MONTH) AS month, source, COUNT(*) AS sessions
  FROM `owox-demo.ecommerce.sessions`
  WHERE medium = 'cpc'
  GROUP BY month, source
),
recorded AS (
  SELECT DATE_TRUNC(o.order_date, MONTH) AS month, s.source,
         COUNT(DISTINCT o.order_id) AS orders
  FROM `owox-demo.ecommerce.orders` AS o
  JOIN `owox-demo.ecommerce.sessions` AS s USING (session_id)
  WHERE o.status = 'Completed' AND s.medium = 'cpc'
  GROUP BY month, source
),
monthly AS (
  SELECT * FROM ads JOIN visits USING (month, source) JOIN recorded USING (month, source)
  WHERE claimed > 0
),
baseline AS (
  SELECT source,
         SUM(claimed) / SUM(orders) AS claim_ratio,
         MIN(sessions / clicks * 100) - 1 AS tag_low,
         MAX(sessions / clicks * 100) + 1 AS tag_high
  FROM monthly
  WHERE month BETWEEN '2024-01-01' AND '2024-12-01'
  GROUP BY source
)
SELECT FORMAT_DATE('%Y-%m', m.month) AS month, m.source, m.orders,
       ROUND(m.sessions / m.clicks * 100, 1) AS sessions_per_100_clicks,
       ROUND(b.tag_low, 1) AS tag_low, ROUND(b.tag_high, 1) AS tag_high,
       ROUND(m.claimed / m.orders, 2) AS claimed_per_order,
       ROUND(GREATEST(0, b.claim_ratio * (1 - 2 / SQRT(m.orders))), 2) AS claim_low,
       ROUND(b.claim_ratio * (1 + 2 / SQRT(m.orders)), 2) AS claim_high,
       m.sessions / m.clicks * 100 NOT BETWEEN b.tag_low AND b.tag_high AS tag_flag,
       ABS(m.claimed / m.orders - b.claim_ratio) > 2 * b.claim_ratio / SQRT(m.orders) AS claim_flag
FROM monthly AS m JOIN baseline AS b USING (source)
WHERE m.month BETWEEN '2025-01-01' AND '2026-10-01'
ORDER BY m.source, m.month
The query is the easy part. What keeps the check alive is that one definition of “the gap” is used every month by everyone who reports it. In OWOX Data Marts the query can be a Data Mart with an owner and a description that says which baseline year it uses and why, and that Data Mart can sit in the model next to the ad spend and orders Data Marts it reads. The monthly result can go to a Google Sheets report the marketing team already opens. The Data Mart does not make the numbers agree, and nothing will: it makes everyone read the same gap.
When a flag fires
- Did the tag check move too? Then the tracking broke. Look at what changed on the site that month: a new landing page layout, a redirect, a consent banner, the checkout. That is a job for whoever owns the tag, with the month and the platform named.
- Only the claim check moved? Open the platform’s change history for that month: attribution model, conversion actions added or set to primary, counting method. If nothing changed there, check the record side: a CRM stage renamed, a deduplication rule, a refund wave.
- Nothing changed on either side? Wait a month. One flag in twenty is expected by design. Two in a row on the same platform, in the same direction, is not.
What to say in the monthly meeting
What to say in the monthly meeting
The person asked to explain the gap is usually not the person who set up the tracking, and “the platforms count differently” sounds like an excuse because it explains every number equally well. Say the range instead:
“Google Ads claimed 1.6 conversions per order in October. On 23 orders the normal range for this account is 0.87 to 2.10, so that is normal. The tag check held at 83.9 sessions per 100 clicks. TikTok was outside its range in September, the second time this year, with its tag check normal, so we are reviewing its conversion settings, not the site.”
That answer names a method. Someone who disagrees has to argue with the method, and the gap stops being the analyst’s fault every month.
GA4, Google Ads and your CRM never agree, and you have to say every month whether this gap is normal.
Paste this into your AI assistant. It sets a normal range for each gap from your own history and flags the months that leave it.
The prompt
Read https://www.owox.com/ai-agent-setup.md and follow it to set up OWOX Data Marts for me, starting from /blog/articles/ga4-google-ads-crm-gap.md. The task: for each ad platform, compare clicks with sessions and platform conversions with the orders or leads we recorded, by month, set a normal range from last year for each, and flag the months outside it. Tag the links you give me with utm_campaign=ai-task and utm_term=data-foundation. Use what you know about my context and goals
Prefer to start on your own? Get started free