
Google Sheets to BigQuery: How to Scale Your Analyst Workflow Without Buying New Tools
Outgrown Sheets? Move to BigQuery, keep your UI, and automate reporting with OWOX. Streamline analyst workflows without extra SaaS costs.

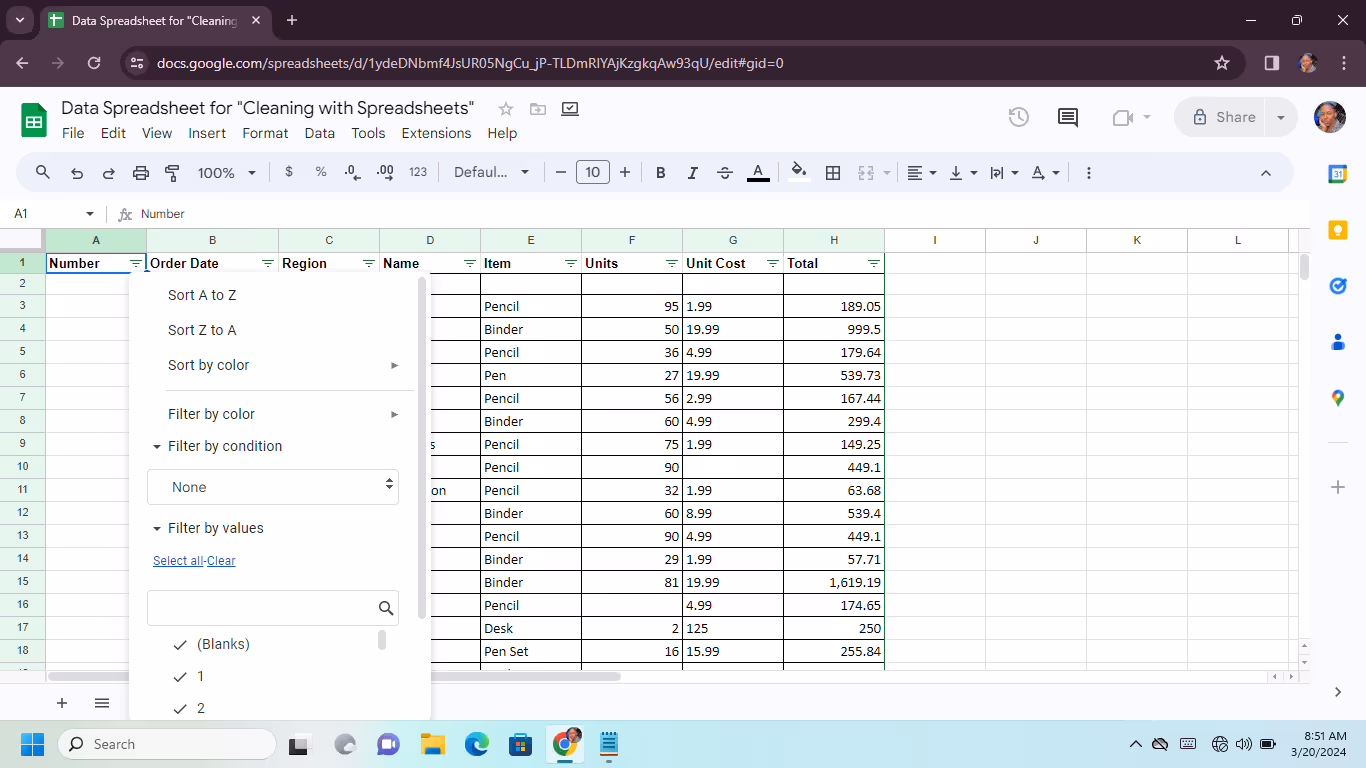
Google Sheets is the go-to tool for quick reports, but as datasets grow, it starts to break down. The 10M cell cap, sluggish performance, and endless CSV exports make analysis slow and frustrating. What once felt flexible turns into delays, duplicate reports, and constant requests for fixes.
In many teams, this creates a ticket treadmill: requests pile up, analysts chase clarifications and CSVs, business users wait, and decisions stall.
The smarter path is extending your workflow to BigQuery – while keeping Google Sheets as the familiar front end. With BigQuery, performance bottlenecks disappear.
With OWOX Data Marts, SQL logic is defined once, refreshed automatically, and delivered back into Sheets or Looker Studio. Analysts stay in control of definitions, and business users finally get governed, self-serve access without waiting on tickets.
Why Analysts Outgrow Google Sheets for Reporting
Google Sheets works well for small, quick reports, but it falls short as data grows. Performance slows, limits block deeper analysis, and manual workarounds drain analyst time. These issues eventually spill over into ticket queues, creating delays and frustration for both analysts and business users.
10M Cell Limit and Sluggish Performance
As datasets expand, Sheets quickly hits its 10M cell cap. Formulas lag, charts freeze, and refreshes often fail, leaving analysts stuck waiting instead of analyzing. Simple updates to a dashboard can take hours, and business users see broken reports instead of timely insights. Over time, these bottlenecks pile into ticket queues, where even routine requests, like rerunning a monthly report, get delayed.
Manual Workarounds Create Backlogs
To keep Sheets usable, analysts resort to fragile fixes: exporting CSVs, cleaning messy data by hand, or splitting reports across multiple files. While these hacks work in the short term, they create more problems long-term.
Each “quick fix” generates new tickets for corrections, reruns, or clarifications. The same reports are rebuilt again and again, and analysts end up acting as support staff instead of strategic partners.
No Governance or Audit Trail
Spreadsheets are easy to copy, but that ease leads to chaos. Teams duplicate reports, adjust formulas, or redefine metrics on the fly, creating conflicting versions of the same KPI. Marketing, Sales, and Finance might each present different “truths,” eroding trust in reporting. Without a governed metric layer or an audit trail, it’s impossible to align numbers across teams. Every new request risks repeating the same cycle of misalignment and confusion.
Why Use BigQuery as the Next Step Toward Scalable Analysis
BigQuery provides the speed and scale that Google Sheets cannot match. It’s designed to handle massive datasets, remove performance bottlenecks, and keep costs predictable with a usage-based model. For growing analytics teams, it’s the natural next step to reduce backlogs and keep reporting reliable.
Query Billions of Rows in Seconds

BigQuery’s serverless architecture lets analysts query terabytes of data in seconds and even petabytes in minutes. There’s no need to manage infrastructure or worry about hitting limits.
For analysts, this means they can explore detailed marketing, sales, or customer data without slowdowns. Large queries that would overwhelm Sheets run seamlessly in BigQuery, ensuring teams don’t stall on performance while insights are needed fast.
Stay in Sheets with Connected Sheets
Moving to BigQuery doesn’t mean abandoning the interface teams rely on. With Connected Sheets, analysts and business users continue working inside Google Sheets, but BigQuery powers the data in the background. Pivots, filters, and charts still work the same way, only now they can handle far larger datasets.
This setup reduces ticket requests, since business users can adjust reports themselves, rather than waiting for analysts to rebuild them.
Pay for What You Use, Not a Monthly Tool

Unlike SaaS platforms with license or seat-based fees, BigQuery charges only for the queries you run and the storage you use. This makes analytics both scalable and affordable, even as data grows.
Teams can tap into enterprise-level performance without committing to expensive subscriptions or worrying about hidden costs. The result: analysts run bigger, more complex queries on demand, while managers maintain clear visibility into costs.
Build a Seamless Workflow from Google Sheets to BigQuery
This section covers how to link Google Sheets with BigQuery, the limits of native connectors, and how OWOX Data Marts with automation and smart setup make reporting faster and more reliable.
The Limitation of Sheets’ Native Connector

Google Sheets includes a native BigQuery connector. In practice, this means analysts must copy and paste SQL queries into Sheets and manually configure parameters for end users. While this helps business teams refresh data without writing SQL themselves, every new variation still requires analyst involvement. As a result, the ticket queue grows, and repetitive query updates drain valuable analyst hours.
Replace One-Off Queries with OWOX Data Marts
OWOX Data Marts removes the need to paste SQL into Google Sheets. Analysts define logic once in a Data Mart, which refreshes in BigQuery on a set schedule and delivers results directly to Sheets and Looker Studio. Business users always work with consistent, governed data, while analysts avoid repeat queries and explanations. This shift frees analysts to focus on strategy rather than routine reporting.
Automate Data Refreshes with Report Triggers
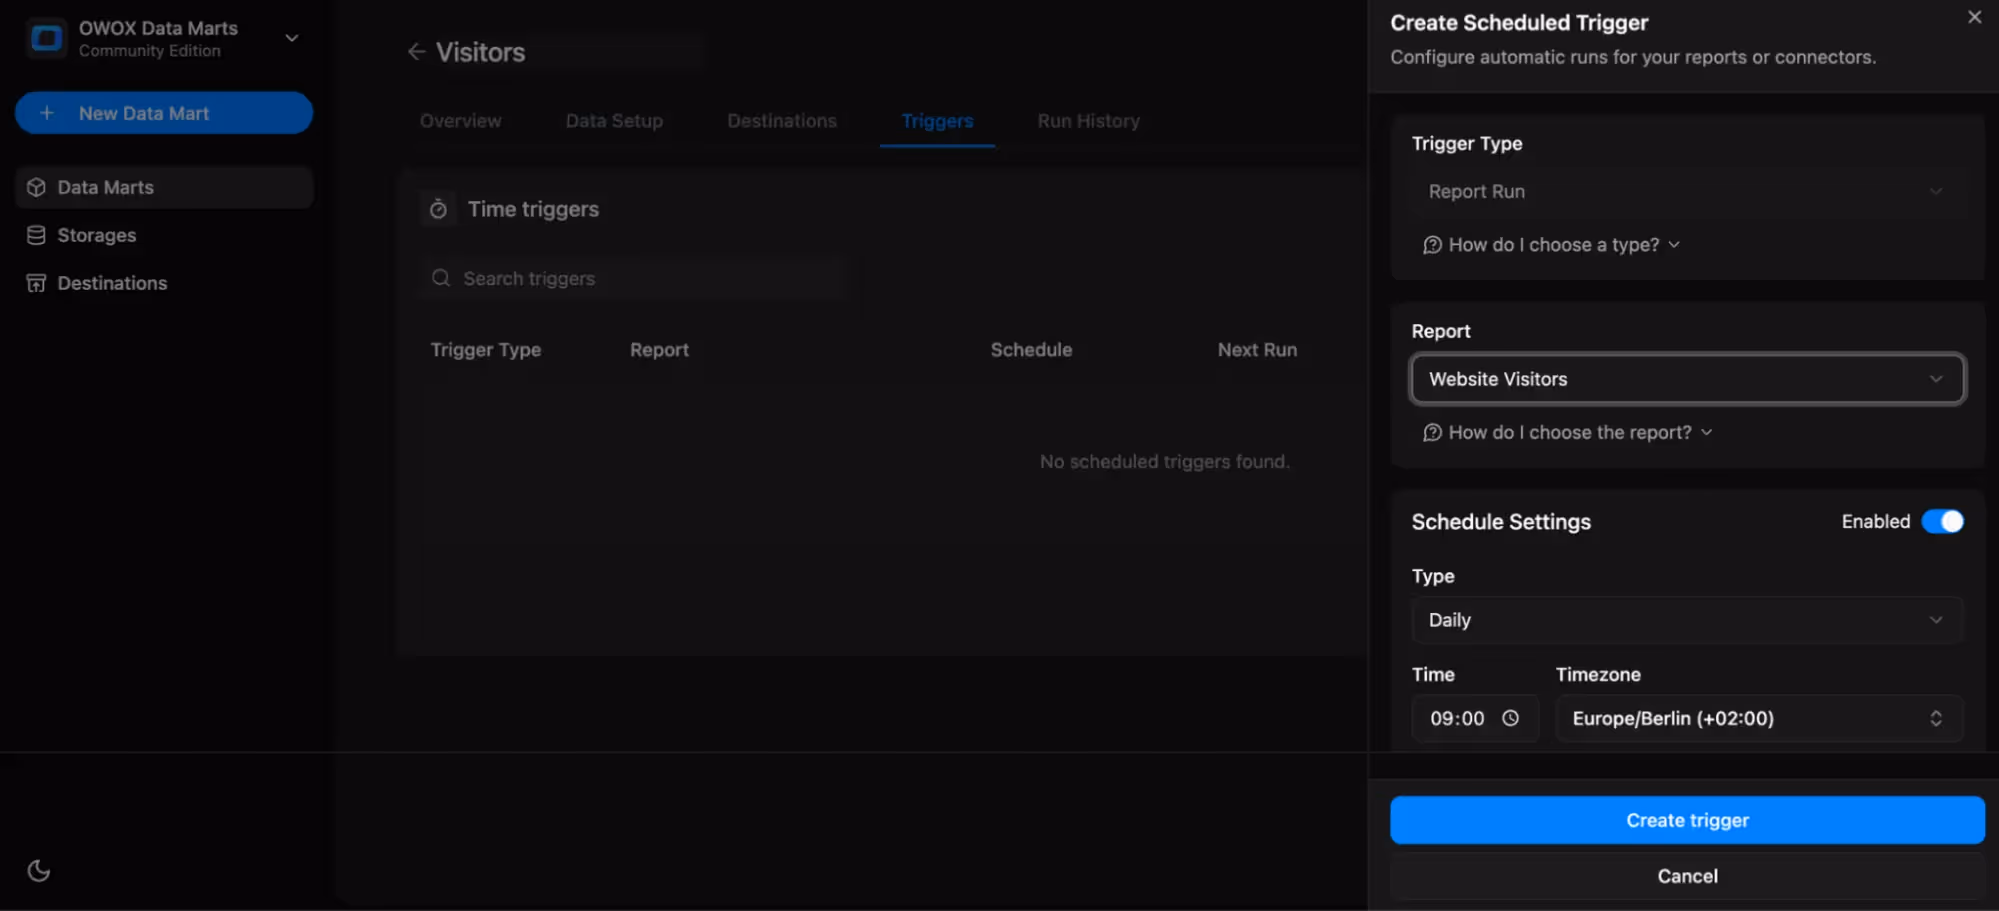
With OWOX, refreshes don’t depend on users manually hitting “Update.” Report Triggers let analysts schedule updates daily, weekly, or monthly, depending on business needs. This removes doubts about data freshness and ensures stakeholders see timely numbers. Automation minimizes repetitive tasks, reduces errors, and allows analysts to focus on improving data quality rather than managing refresh cycles.
Keep Sheets Responsive with Smart Setup
Even with BigQuery as the backend, Connected Sheets can slow down if too many rows or columns are pulled at once. The best practice is to only query the essential fields and rows, leaving BigQuery to handle the heavy calculations in the background. This keeps Sheets responsive for pivots, charts, and filters, while allowing business users to continue exploring data in a familiar interface without performance bottlenecks.
Use External Tables for Logs and Updates
Sometimes, teams keep small logs or updates in Google Sheets, such as campaign notes or review checklists. BigQuery external tables make it possible to query these live Sheets directly, without constantly re-uploading or creating new tables. Analysts can blend live spreadsheet inputs with warehouse data instantly, avoiding more CSV exports. This flexibility saves time, ensures consistency, and keeps analysts focused on analysis rather than endless manual data prep.
How OWOX Data Marts Powers Scalable Marketing Analytics
OWOX Data Marts helps analysts move beyond ad-hoc scripts and manual reporting. It provides a governed, reusable way to build data pipelines that grow with your business. Instead of answering the same requests repeatedly, analysts define logic once and make it available for reuse across teams.
Run in the Cloud (or in Your Own Environment)
By default, OWOX Data Marts runs in the cloud, giving analysts a secure and governed environment without any extra setup. For teams that prefer full control, the Community Edition can be deployed on their own infrastructure. In both cases, data always stays in your BigQuery project, while OWOX only provides the modeling and automation layer.
With built-in logs and monitoring, you gain privacy, governance, and transparency, avoiding the usual ticket back-and-forth about “who changed what and when.”
Centralize Data in BigQuery

Funneling everything into BigQuery creates a governed foundation for analytics. Analysts define schema, assign aliases, and ensure consistent reporting across all teams. This turns BigQuery into a single source of truth where permissions, costs, and compliance are managed centrally.
Reusable Data Marts, once defined, can be shared across reports, dashboards, or tools. The result is a central metric layer, one reliable place to find and reuse trusted numbers without creating another ticket.
Deliver to the Tools Analysts Already Use

OWOX doesn’t force analysts or business users to abandon their workflows. Reports can be delivered directly to Sheets for lightweight analysis, and Looker Studio for interactive dashboards.
Since marts are governed and reusable, business users can pull data themselves without waiting in ticket queues. This self-service access keeps analysts in control of definitions while giving stakeholders the flexibility they need in familiar tools.
Automate for Reliability
Automation in OWOX helps teams shift from reactive reporting to continuous delivery of insights. Report Triggers refresh Data Marts on the schedule you define, daily, weekly, monthly, or even every 15 minutes.
This removes human error from manual reruns, prevents outdated data from blocking decisions, and reduces duplicate requests for refreshes. Each dataset can run on its own cadence, creating scalable, reliable reporting processes that grow with your business.
How Analysts Can Shift from Reactive Tasks to Strategic Impact
Analysts often waste hours fixing dashboards, rerunning queries, and handling tickets. This reactive cycle clogs backlogs and leaves little room for real analysis. By defining metrics once in reusable Data Marts and enabling self-serve access in familiar tools, OWOX helps teams cut repeat work and focus on strategic impact.
Stop Rebuilding Metrics in Every Sheet
With OWOX Data Marts, analysts only need to define a metric once. That definition can then be reused across multiple reports in Google Sheets or Looker Studio without duplicating SQL or rewriting formulas.
This consistency removes the “same KPI, different number” problem that plagues ticket-driven reporting. It also saves analysts from endless rework and repeat tickets, creating a foundation of trust and reliability across departments.
Empower Business Teams, Free Analysts

Business users don’t want to wait days for simple answers. With OWOX, they can filter, pivot, and explore directly in Google Sheets or Looker Studio using governed Data Marts. Analysts remain in control of the metric layer but no longer have to serve as on-demand report generators. This balance empowers teams to self-serve while freeing analysts to focus on building models and frameworks instead of constantly responding to tickets.
Shift Focus from Fixing to Forecasting
Once repetitive report fixes and manual refreshes are automated, analysts can shift their attention to proactive analysis. Instead of answering “what happened?” they can model “what if?”, building forecasts, scenario analyses, and KPI tracking that influence strategy. This step up from reactive maintenance to strategic insight changes how the data team is perceived inside the business: from support staff to partners in decision-making.
Scale Google Sheets Without Sacrificing Control
Scaling reporting often means sacrificing governance, but OWOX prevents that trade-off. BigQuery provides the performance to handle massive datasets, while Sheets maintains the familiar interface for business users. Analysts control the logic, definitions, and refresh schedules; business users keep the flexibility to explore data in tools they already know. The outcome is a scalable, governed reporting system that supports growth without adding chaos.
Long-Term Vision: One Stack, Three Roles – Sheets, BigQuery, OWOX
Teams rely on Google Sheets because it’s easy, familiar, and flexible. Keeping Sheets as the primary interface means business users can explore data, build reports, and make decisions without learning new tools or skills. This avoids the friction and resistance that often come with adopting new platforms.
Behind the scenes, BigQuery takes care of large-scale processing, so performance holds steady even with millions of rows. OWOX Data Marts sits in the middle, where analysts define logic and metrics once and ensure consistency everywhere. This stack balances control and flexibility: analysts stay in charge of definitions, while business users enjoy self-service access in Sheets or Looker Studio.
The outcome is a reporting system that scales without chaos. Ticket queues shrink, repetitive requests disappear, and answers arrive faster. Analysts finally shift from firefighting to strategy, while teams across the business work with governed, trustworthy data.
Explore the OWOX Data Marts Built for Data Analysts
OWOX Data Marts helps data analysts create and manage marketing data pipelines using free, open-source SQL templates and connectors, no subscriptions or vendor lock-in.
- UI-driven setup with SQL flexibility for sources like Facebook, LinkedIn, TikTok, and more. Connectors are easy to configure through the interface, while SQL is optional for connectors and recommended for defining SQL-based marts.
- Send data straight to BigQuery while keeping full control over your costs, permissions, and setup.
- Customize everything, from metrics and table formats to how often data refreshes, based on your reporting needs.
Explore the GitHub repo to deploy your own setup and stay independent of paid, hosted platforms.
Frequently asked questions
.png)


Finally, a tool that doesn't ask business users to learn a new dashboarding UI. Our marketing team already knows Sheets. OWOX just delivers the right data.
Joinable data marts concept was the thing that sold us. We can now use the semantic layer without building one.
Self-hosted the OSS version on Digital Ocean. Zero vendor lock-in. Contributed a Shopify connector back in week two.