
Governed Metrics Without a Full Semantic Layer: Mastering Output Schemas
Discover how Output Schemas let analysts define consistent metrics and governance at the source – no full semantic layer required for reliable reporting.


Getting every report to show the same “truth” often feels impossible. Different SQL queries, naming styles, and dashboard filters lead to confusion about which number to trust. That’s where governed metrics come in, ensuring consistency without the need for a complex data architecture.
.png)
This article explains how Output Schemas inside OWOX Data Marts help teams standardize metric names, keys, and descriptions directly at the source. You’ll see how analysts can deliver governed, documented, and reusable data without building a full semantic layer.
Why Teams Struggle to Keep Metrics Consistent Across Reports
Many teams face confusion when the same metric shows different results across reports. This section explains why such inconsistencies happen, from scattered SQL queries to unclear definitions, and how the absence of a unified semantic layer makes the problem worse.
Fragmented SQL and Duplicate Logic Across Reports
Analysts often write separate SQL queries for each dashboard or ad-hoc request. Each version may include small differences in filters, joins, or field names. These inconsistencies build up over time, leading to confusion when reports don’t match or when KPIs show conflicting results.
Without a single source of truth, business users struggle to know which number is right or reliable. This fragmentation also increases maintenance work for analysts, who end up troubleshooting repetitive queries instead of focusing on deeper insights or improving overall data quality.
Inconsistent Definitions Undermine Trust
When teams define metrics separately in every report, they lose a common understanding of what each number truly means. For example, “Revenue” in one dashboard might include discounts, while another excludes them, creating unnecessary discrepancies in shared reporting.
Such mismatches cause constant questioning and erode confidence in dashboards. Over time, even accurate reports face skepticism because users no longer trust the definitions, the results, or the analysts who built them, weakening data-driven decision-making.
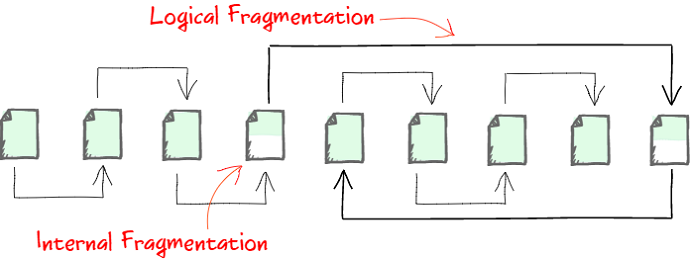
The Absence of a Semantic Layer Creates Fragmentation
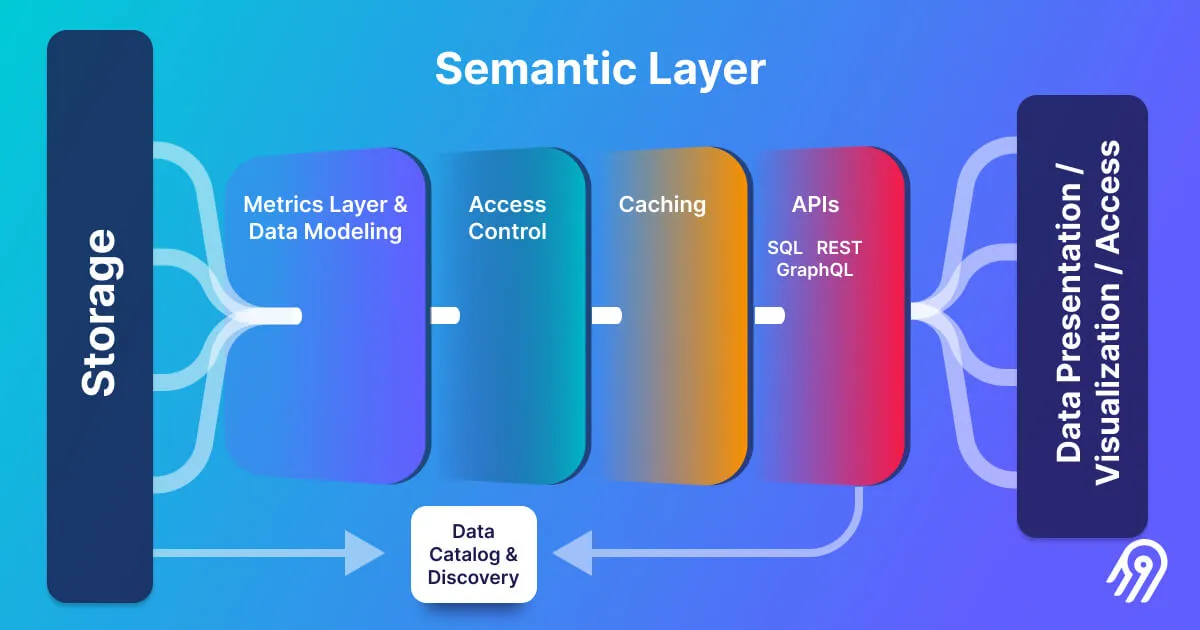
A semantic layer acts as a single framework where metrics are defined once and reused everywhere across tools. Without it, every analyst and reporting system manages logic independently, creating discrepancies across SQL scripts, data sources, and dashboards.
Even a small change, like renaming a field or adjusting a join, can break alignment across reports and dashboards. As a result, organizations spend more time reconciling numbers, fixing inconsistencies, and validating definitions instead of analyzing performance and uncovering insights.
How Teams Can Achieve Governance Without a Full Semantic Layer
Teams don’t always need a complex semantic layer to maintain consistency. This section explains practical ways to achieve governance using Output Schemas, helping analysts define clear, documented metrics directly at the source without adding technical overhead or heavy infrastructure.
Why Full Semantic Layers Are Hard to Implement
Building a complete semantic layer takes time, resources, and cross-team coordination. Different departments must align on metric definitions, while engineers handle complex setup, integration, and long-term maintenance. Every new data field or rule requires revisiting the shared model and updating dashboards to prevent mismatched logic.
For most organizations, this becomes a continuous and time-consuming effort. Standing up a full semantic layer means negotiating definitions across Marketing, Finance, and Product, then maintaining one unified data model. Even a minor schema change can ripple through reports and break alignment if not updated everywhere.
Introducing Output Schemas as a Practical Alternative
Instead of creating a large-scale, centralized semantic layer, teams can define governance directly inside each Data Mart. Output Schemas let analysts manage aliases, add clear field descriptions, and set primary or join keys right where the data lives, ensuring consistency and context.
Think of it as lightweight governance that fits easily into existing workflows. Analysts define the meaning and naming conventions at the source, while business users consume governed data confidently without needing an expensive or full-blown semantic layer project to maintain alignment across tools.
Establishing Governance at the Source Level
Applying governance at the source ensures data clarity from the moment it’s created. By using Output Schemas, analysts can standardize field names, apply consistent data types, and include business-friendly explanations that make every dataset easier to understand and reuse across the company.
This approach ensures that each Data Mart is not only consistent but also transparent and well-documented. It helps maintain accuracy, reduces repetitive work, and supports self-service analytics, allowing every BI tool and dashboard to rely on the same trusted, reusable logic without manual rework or confusion.
Define Aliases, Keys, and Descriptions Where the Data Lives
Defining details like aliases, keys, and descriptions directly within the Data Mart ensures that every field has a clear meaning and purpose. It helps analysts maintain consistency at the source and gives business users a dataset they can easily understand and trust.
Here’s how each element contributes to well-governed data:
- Field aliases: Rename technical field names like total_spend_usd to clear, readable labels such as “Campaign Cost (USD)” so users instantly recognize what the value represents.
- Primary keys / join keys: Document which columns uniquely identify each record and how they connect to other Data Marts for accurate joins and relationships.
- Descriptions: Add a one-line, business-friendly explanation for every metric, for example, “Customer Acquisition Cost (CAC): Total cost to acquire a new customer during the selected period.”
- Data types: Specify whether each field is numeric, date-based, or categorical so users know how to group, filter, or pivot data confidently in Sheets or Looker Studio.
How OWOX Data Marts Make Metric Governance Easy
OWOX Data Marts make it simple to manage and trust your metrics. This section explains how built-in Output Schemas, field descriptions, and reusable logic help analysts maintain consistency while giving business users clear, governed data across all reporting tools.
Inline Schema Governance in Every Data Mart
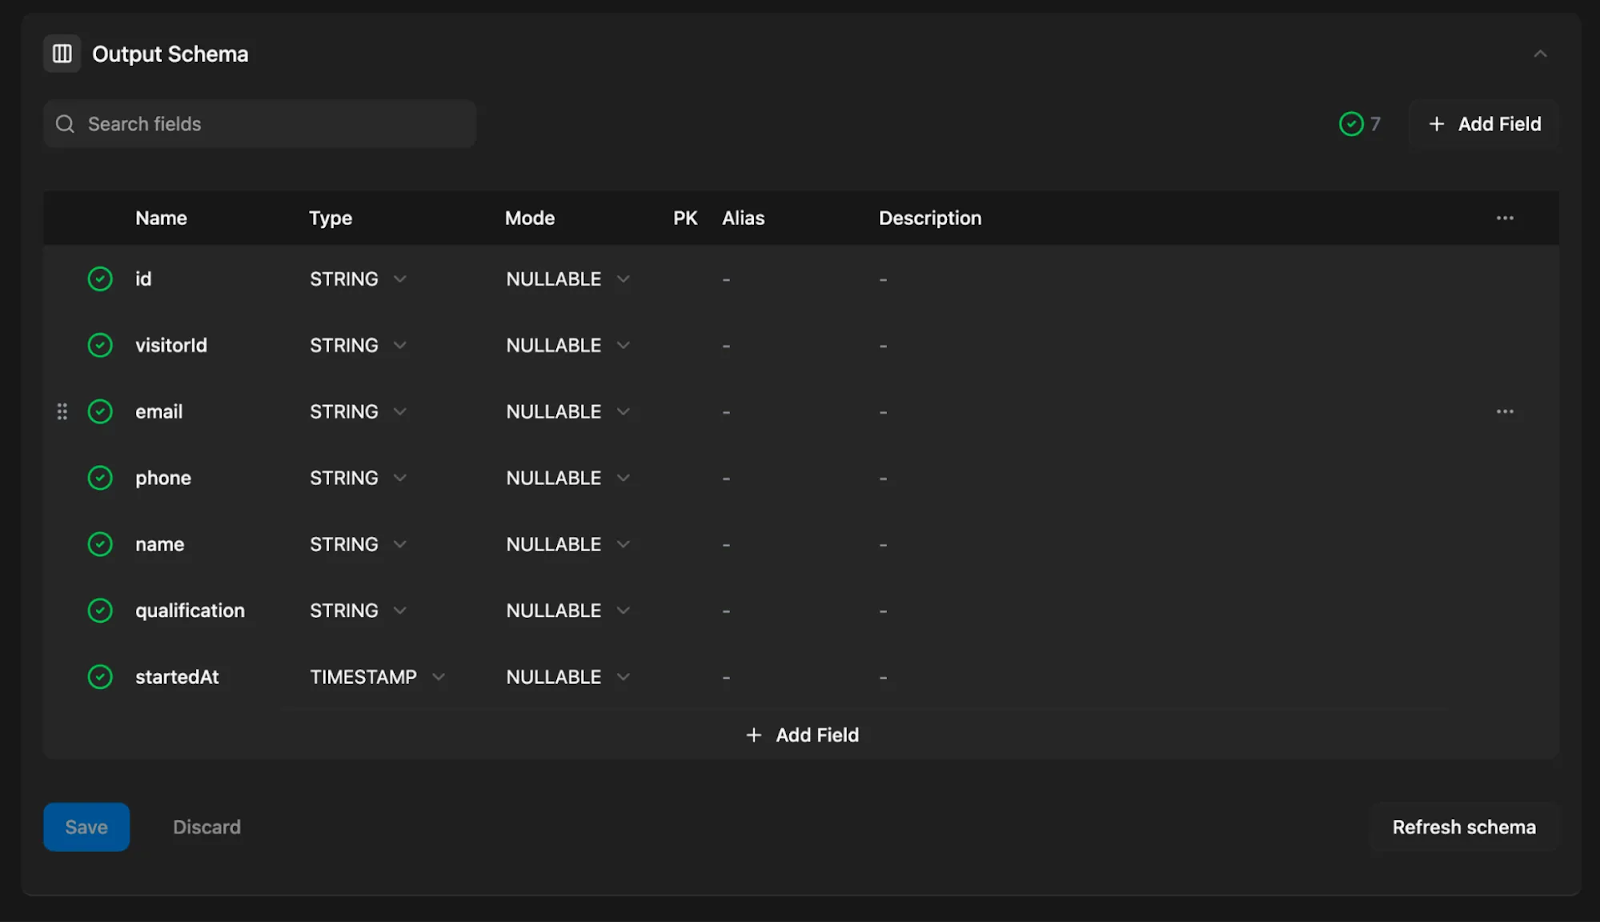
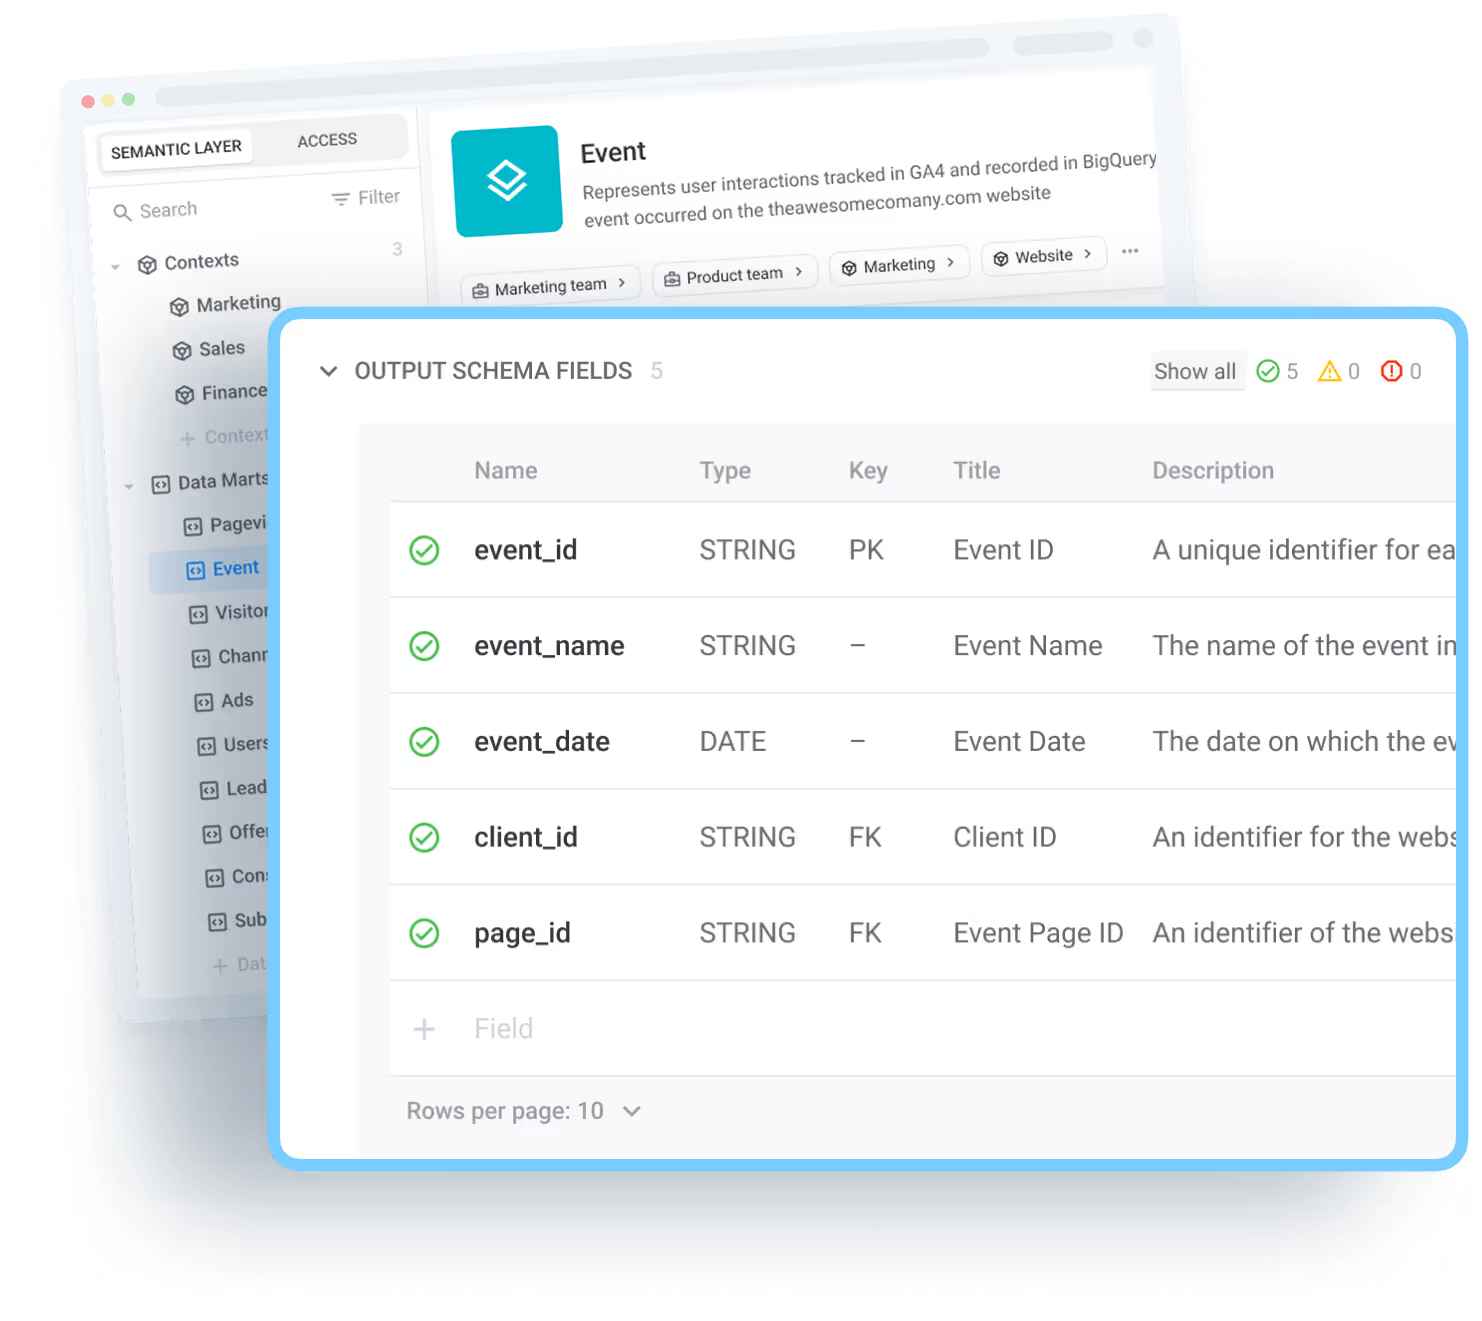
Every Data Mart in OWOX comes with an Output Schema editor where analysts can define field aliases, data types, and primary or join keys. This setup creates a governed schema right inside the Data Mart, removing the need for a separate semantic layer or external governance tools.
By maintaining structure and rules directly within OWOX, analysts stay in full control of how metrics are named and understood. Business users always see clean, consistent, and easy-to-read data in Google Sheets, Looker Studio, or any other connected tool. This approach ensures clarity across all reports while reducing the chance of misaligned metrics.
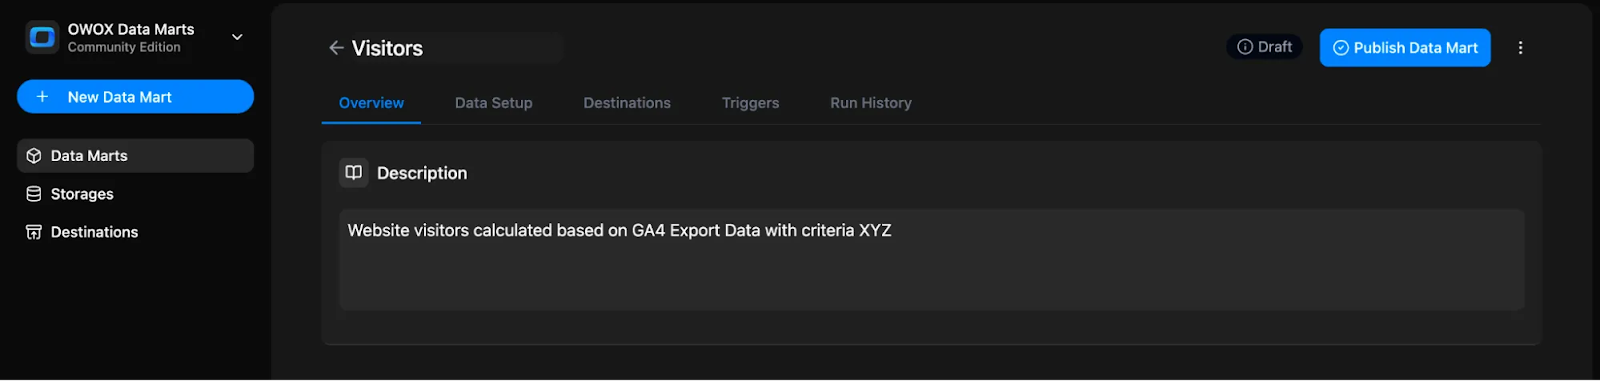
Descriptive Metadata for Better Understanding
Every field inside an OWOX Data Mart can include descriptive metadata such as friendly names and clear explanations. These descriptions act as inline documentation visible in tools like Sheets or Looker Studio, helping business users instantly understand what each metric means without asking analysts for clarification.
This transparency reduces confusion and makes collaboration smoother between technical and non-technical teams. Analysts define once, and everyone benefits from a shared understanding of the data’s purpose, scope, and context, ensuring every field reflects the same meaning across all reports.
Reusable Logic That Powers Multiple Reports
Once an Output Schema is defined and published, the same governed Data Mart can power multiple dashboards, spreadsheets, and BI tools at once. Any future change to field names, descriptions, or logic automatically applies across every destination, ensuring full alignment and consistency.
This reuse eliminates repetitive work and guarantees that updates propagate everywhere without manual intervention. Analysts spend less time maintaining SQL queries and more time analyzing insights, while business users rely on the same, trusted metrics across Sheets, Looker Studio, and beyond.
Limitations of Output Schemas Compared to a Full Semantic Layer
While Output Schemas bring strong governance within each Data Mart, they don’t fully replace a complete semantic layer. This section explains their main limitations, where consistency depends on analyst discipline, and why global alignment across all Data Marts still requires coordination.
Not a Global Semantic Layer
Output Schemas bring consistency within each Data Mart, but don’t enforce global definitions across all marts. Each mart remains self-contained, meaning analysts must manually align naming conventions, joins, and logic when creating or updating new marts.
In simpler terms, Output Schemas don’t act as a universal layer that updates everywhere when a change is made. They help standardize each Data Mart individually but don’t synchronize definitions company-wide, so collaboration and communication among analysts remain essential.
Requires Analyst Discipline to Maintain Standards
The reliability of Output Schemas depends on how carefully analysts maintain them. Consistency comes from following naming conventions, documenting fields clearly, and reviewing schemas regularly to ensure logic stays aligned across all projects.
If these standards aren’t followed, definitions can drift, and discrepancies may return over time. Regular upkeep, collaboration, and attention to detail are key to keeping Output Schemas consistent, governed, and valuable for the entire organization.
Main Insights for Analysts and Teams Using Output Schemas
Output Schemas offer a practical way to bring governance and consistency to data without heavy systems. This section highlights the key takeaways for analysts and teams, how Output Schemas bridge gaps, improve transparency, and ensure reusable, trusted metrics across tools.
Output Schemas Bridge the Gap
Output Schemas act as a practical bridge between SQL logic and a full semantic layer. They give teams a governed framework to manage data structure and consistency right now, without waiting for complex, long-term architectural changes.
This middle layer helps analysts define clear naming conventions and standardized logic within each Data Mart. It allows business users to access accurate, reliable metrics across tools while keeping governance simple and under control.
Field-Level Documentation Builds Transparency
Adding aliases, descriptions, and keys to each field makes metrics clear for everyone, both analysts and non-technical users. It turns complex datasets into easy-to-understand information that anyone can trust when analyzing results.
This level of documentation improves communication, reduces confusion, and ensures every number carries a clear meaning. Users can interpret data confidently, knowing exactly what each field represents and how it’s calculated.
Reusable, Governed Marts Support All Tools
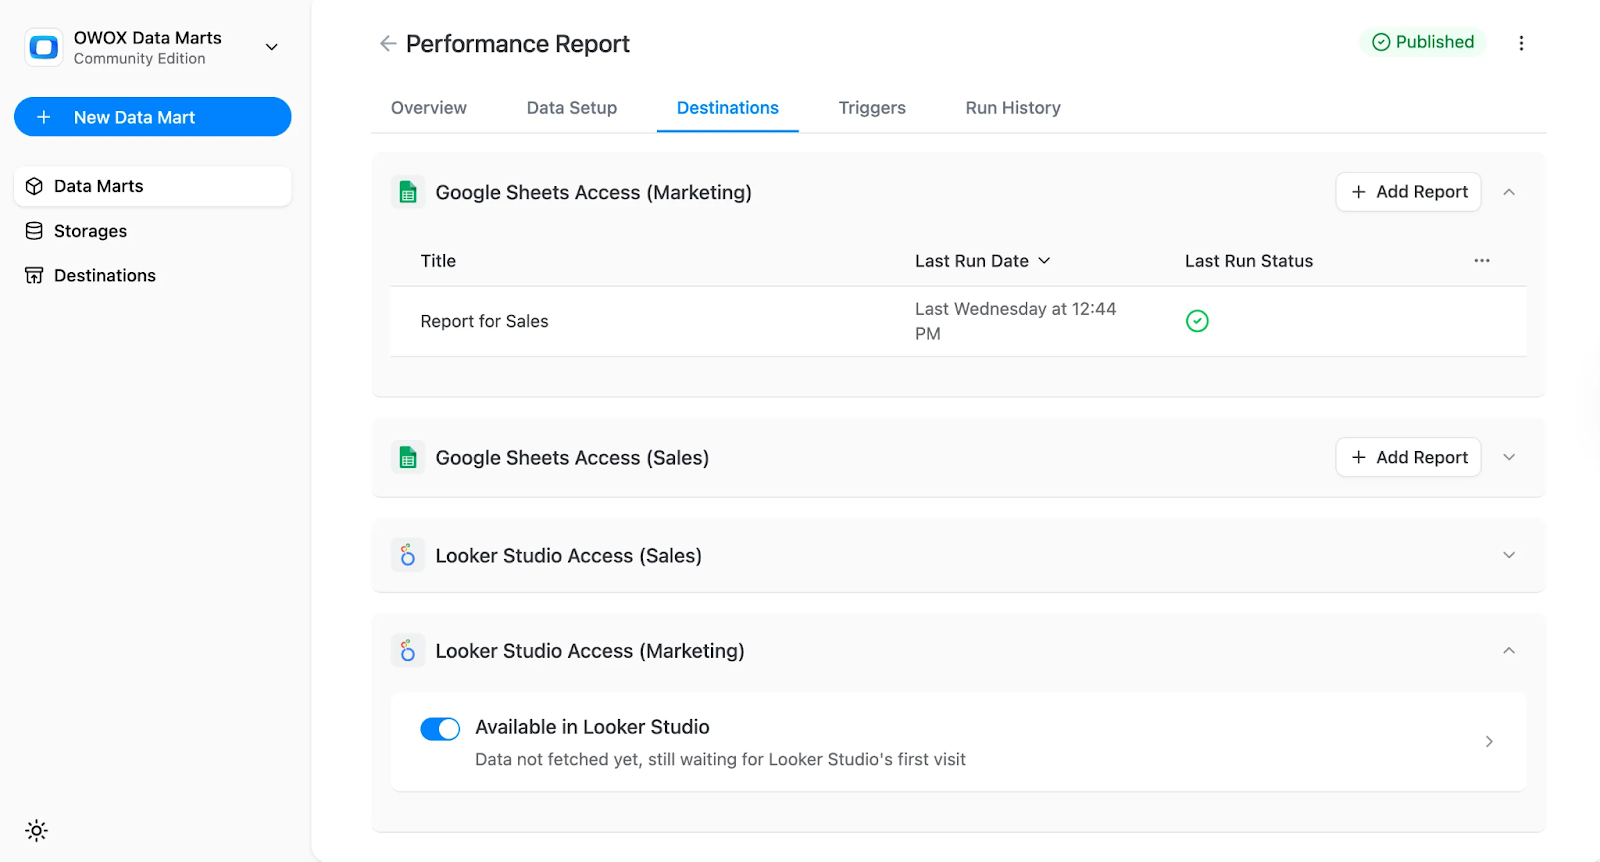
Once defined, each governed Data Mart provides consistent, business-ready data that can feed tools like Google Sheets and Looker Studio. It eliminates the need for duplicate queries or manual adjustments between platforms.
Analysts can make one update, and all connected reports automatically stay aligned. This reusability simplifies maintenance and ensures the same definitions power dashboards, spreadsheets, and analytics tools without confusion or extra work.
Achieve Governance Without Complexity
OWOX makes it simple to achieve governance without introducing complex systems or extra layers of maintenance. The platform embeds schema editing, metadata, and consistent logic directly into each Data Mart.
By centralizing these controls, analysts maintain accuracy and structure while avoiding unnecessary setup or overhead. Teams get governed, trusted data with minimal effort, no external semantic layer required.
Start Building Governed Metrics with OWOX Data Marts
Start defining clear, governed metrics right where your data lives. With OWOX Data Marts, you can create Output Schemas, add field aliases, and document every metric, all without extra tools or complexity. Analysts stay in control of definitions, while business users work confidently with transparent, consistent data in Sheets or Looker Studio.
Build once, trust everywhere. Begin your journey toward consistent, reliable reporting today with OWOX Data Marts.
Frequently asked questions
.png)
.png)
.png)
.png)


Finally, a tool that doesn't ask business users to learn a new dashboarding UI. Our marketing team already knows Sheets. OWOX just delivers the right data.
Joinable data marts concept was the thing that sold us. We can now use the semantic layer without building one.
Self-hosted the OSS version on Digital Ocean. Zero vendor lock-in. Contributed a Shopify connector back in week two.