
From Analyst Bottleneck to Scalable Reporting: Packaging Data for Non-SQL Users
Discover how teams can scale reporting, reduce analyst dependency, and give non-SQL users instant access to trusted business data using OWOX Data Marts.

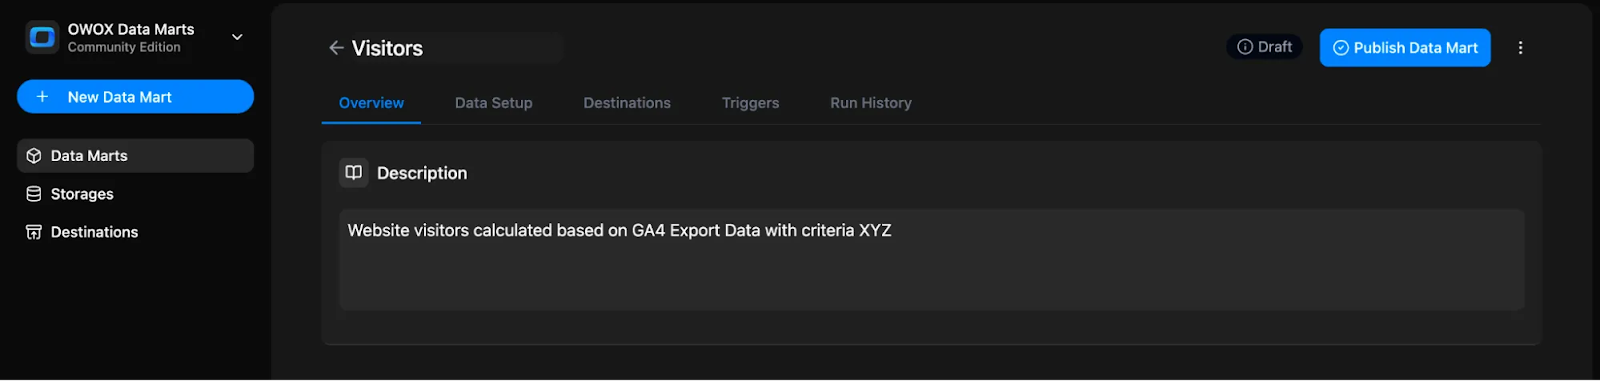
Analysts often become bottlenecks when every report depends on their SQL skills. Teams wait for updates, metrics differ across dashboards, and decision-making slows down. The real solution isn’t hiring more analysts; it’s defining logic once, governing it properly, and making it reusable for everyone.
This article explains how analysts can package data into ready-to-use, governed datasets that non-SQL users can explore independently. You’ll learn how OWOX Data Marts helps turn manual, repetitive reporting into a scalable, self-service system trusted across teams.
Why Reporting Doesn’t Scale When Analysts Handle Every Request
Reporting struggles to scale when every data request depends on analysts. This section covers how repetitive SQL work, long wait times, and ad hoc reporting slow teams and create inconsistent results.
Repetitive SQL Work Slows Down the Entire Team
Analysts often spend a large part of their day writing and running the same SQL queries repeatedly. Whether it’s weekly performance reports or campaign summaries, these tasks eat up hours that could be spent improving data quality or building strategic insights. As these repetitive requests pile up, the workload becomes overwhelming and slows overall productivity.
This constant cycle of manual query execution also increases the risk of performance issues and errors. When analysts focus on short-term data pulls instead of long-term optimization, teams face backlogs, slower decision-making, and inefficient use of resources.
Business Teams Wait Too Long for Answers
Most marketing, sales, and finance teams rely entirely on analysts for even basic data access. This dependency creates unnecessary delays, as every new request joins a growing queue of pending reports. By the time the data reaches decision-makers, it’s often outdated, reducing its value and impact.
These long wait times lead to frustration and missed opportunities. When teams can’t explore data independently, quick decisions become impossible. Without a way to self-serve insights, organizations lose both agility and confidence in their reporting process.
Ad Hoc Reporting Leads to Inconsistent Results

When different departments build their own ad hoc reports, they often redefine metrics inconsistently. Without a shared source of truth, teams end up using inconsistent SQL logic and duplicated datasets. Over time, this results in conflicting dashboards that erode trust in company-wide data accuracy.
The lack of governance also means no one owns the final version of a metric or formula. This creates confusion and wastes time reconciling numbers between departments. Instead of clear answers, teams debate whose report is right, slowing down decisions and hurting collaboration.
How to Package and Prepare Data for Non-SQL Users to Enable Scalable, Self-Service Reporting
Packaging data means turning complex SQL logic into easy, reusable datasets that anyone can explore. This section explains how analysts can structure, document, and share governed data for scalable, self-service reporting.
Define Business Logic Once in SQL or Views
Start by centralizing all key metrics in a single SQL query or view that reflects important business questions, like “What’s our campaign ROI?” or “How many new customers joined this month?”. This ensures that everyone works from the same logic and avoids repeated query rewrites for similar requests, which often waste time.
By defining logic once, analysts can reuse it across multiple reports, dashboards, or departments. This not only saves time but also keeps every team aligned on a single version of truth for performance metrics, reducing errors and improving reporting consistency across the organization.
Ensure Data Quality Before Packaging
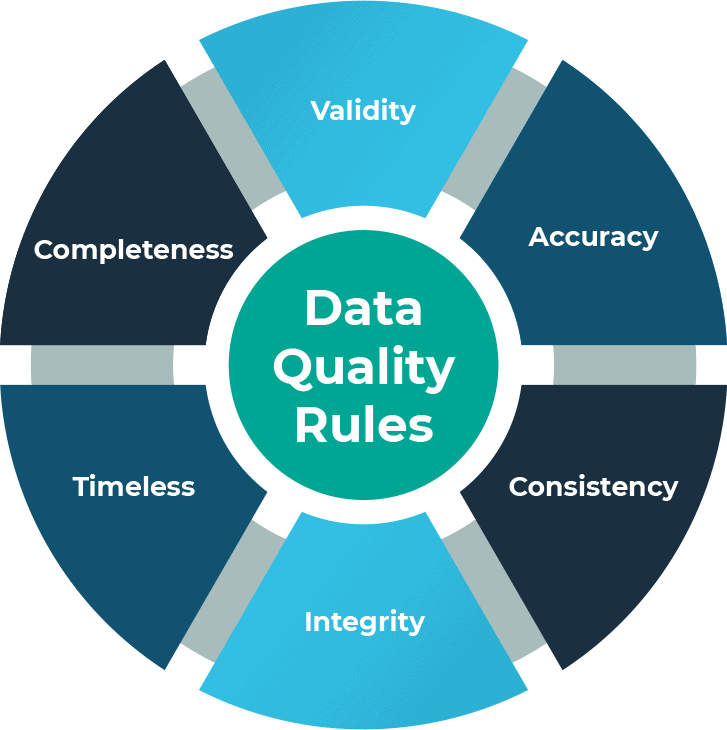
Good reporting starts with clean, consistent data. Before packaging, verify that IDs are unified, currencies standardized, and timestamps aligned across all sources. These small adjustments prevent errors, mismatched joins, and inconsistencies when reports are used by non-SQL users in their tools.
When data is properly validated, business teams can trust what they see in Sheets or dashboards without second-guessing. Consistent data quality builds long-term confidence in self-service reporting, minimizes troubleshooting, and keeps the focus on insights and decision-making instead of manual error correction or rework.
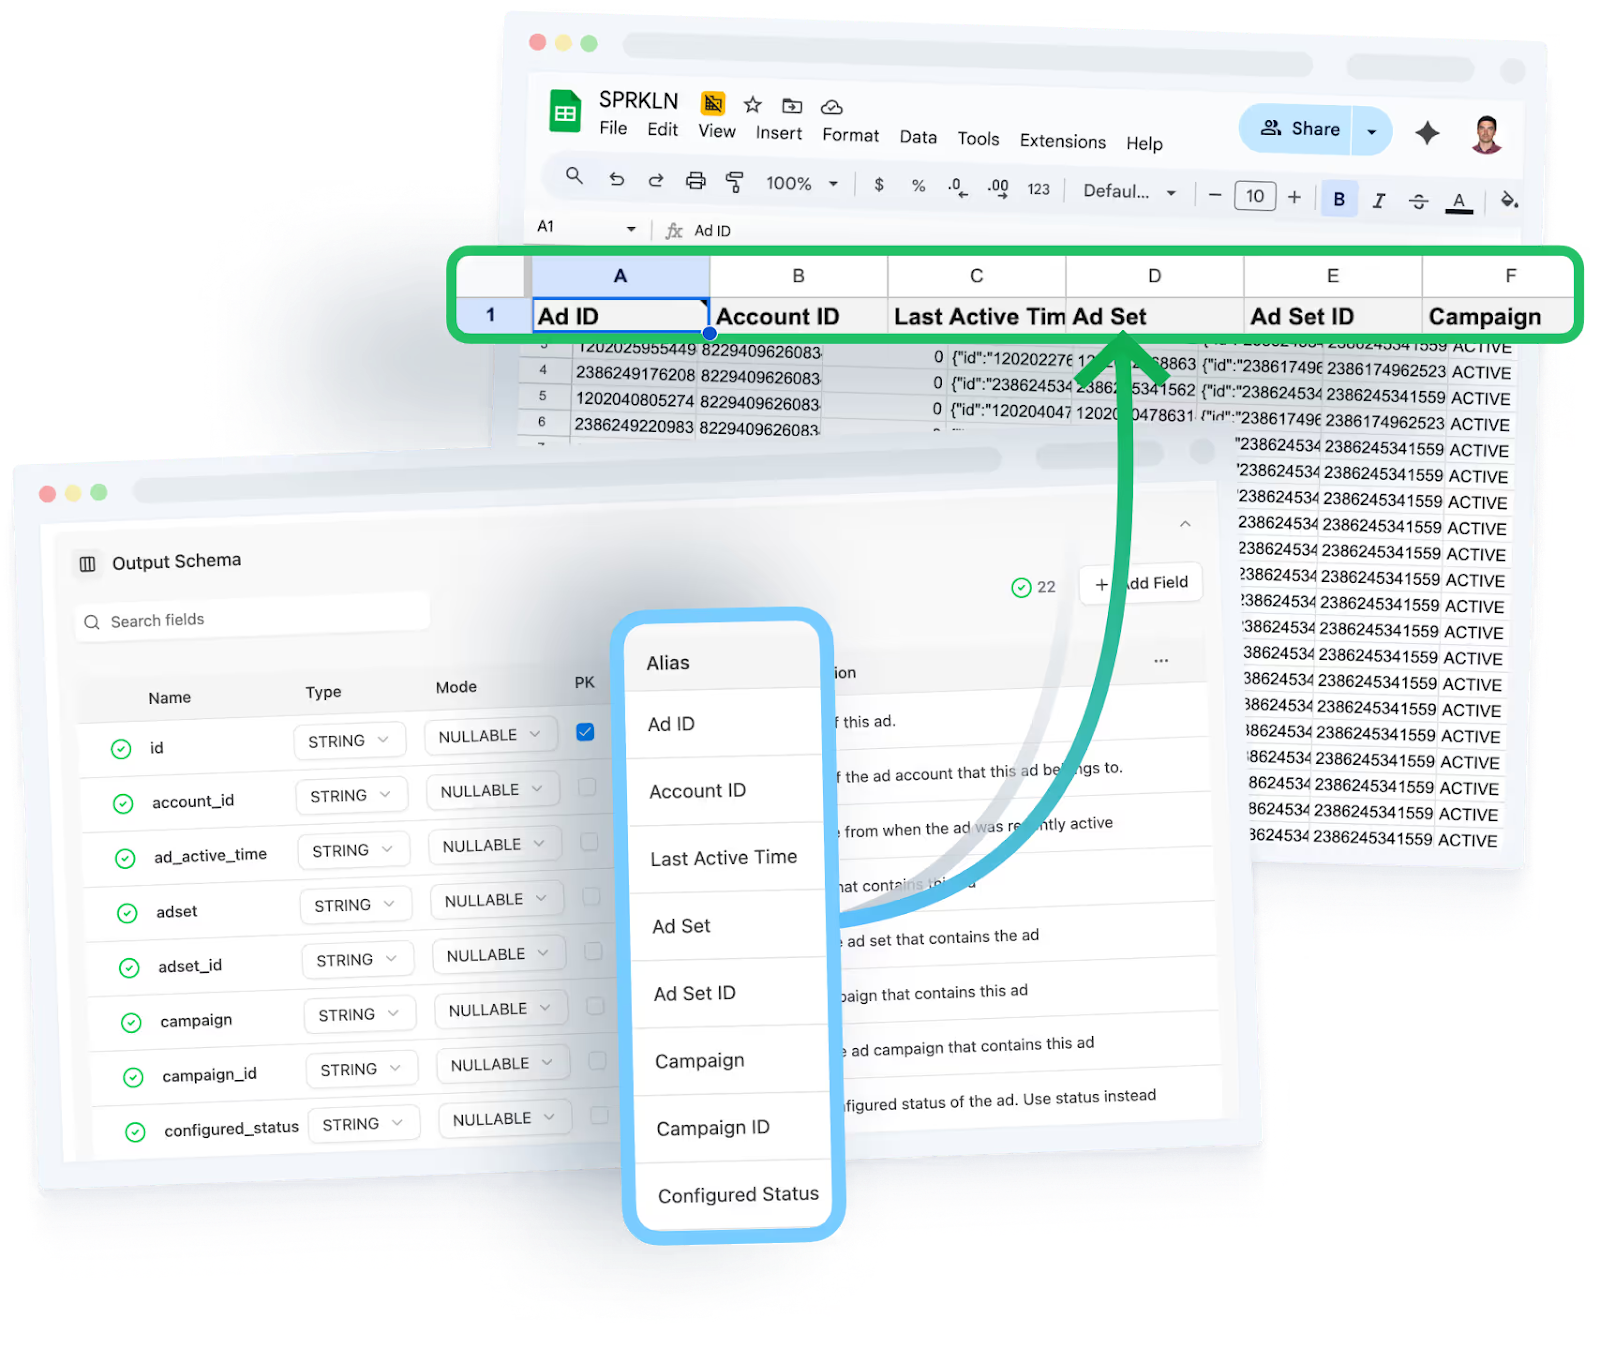
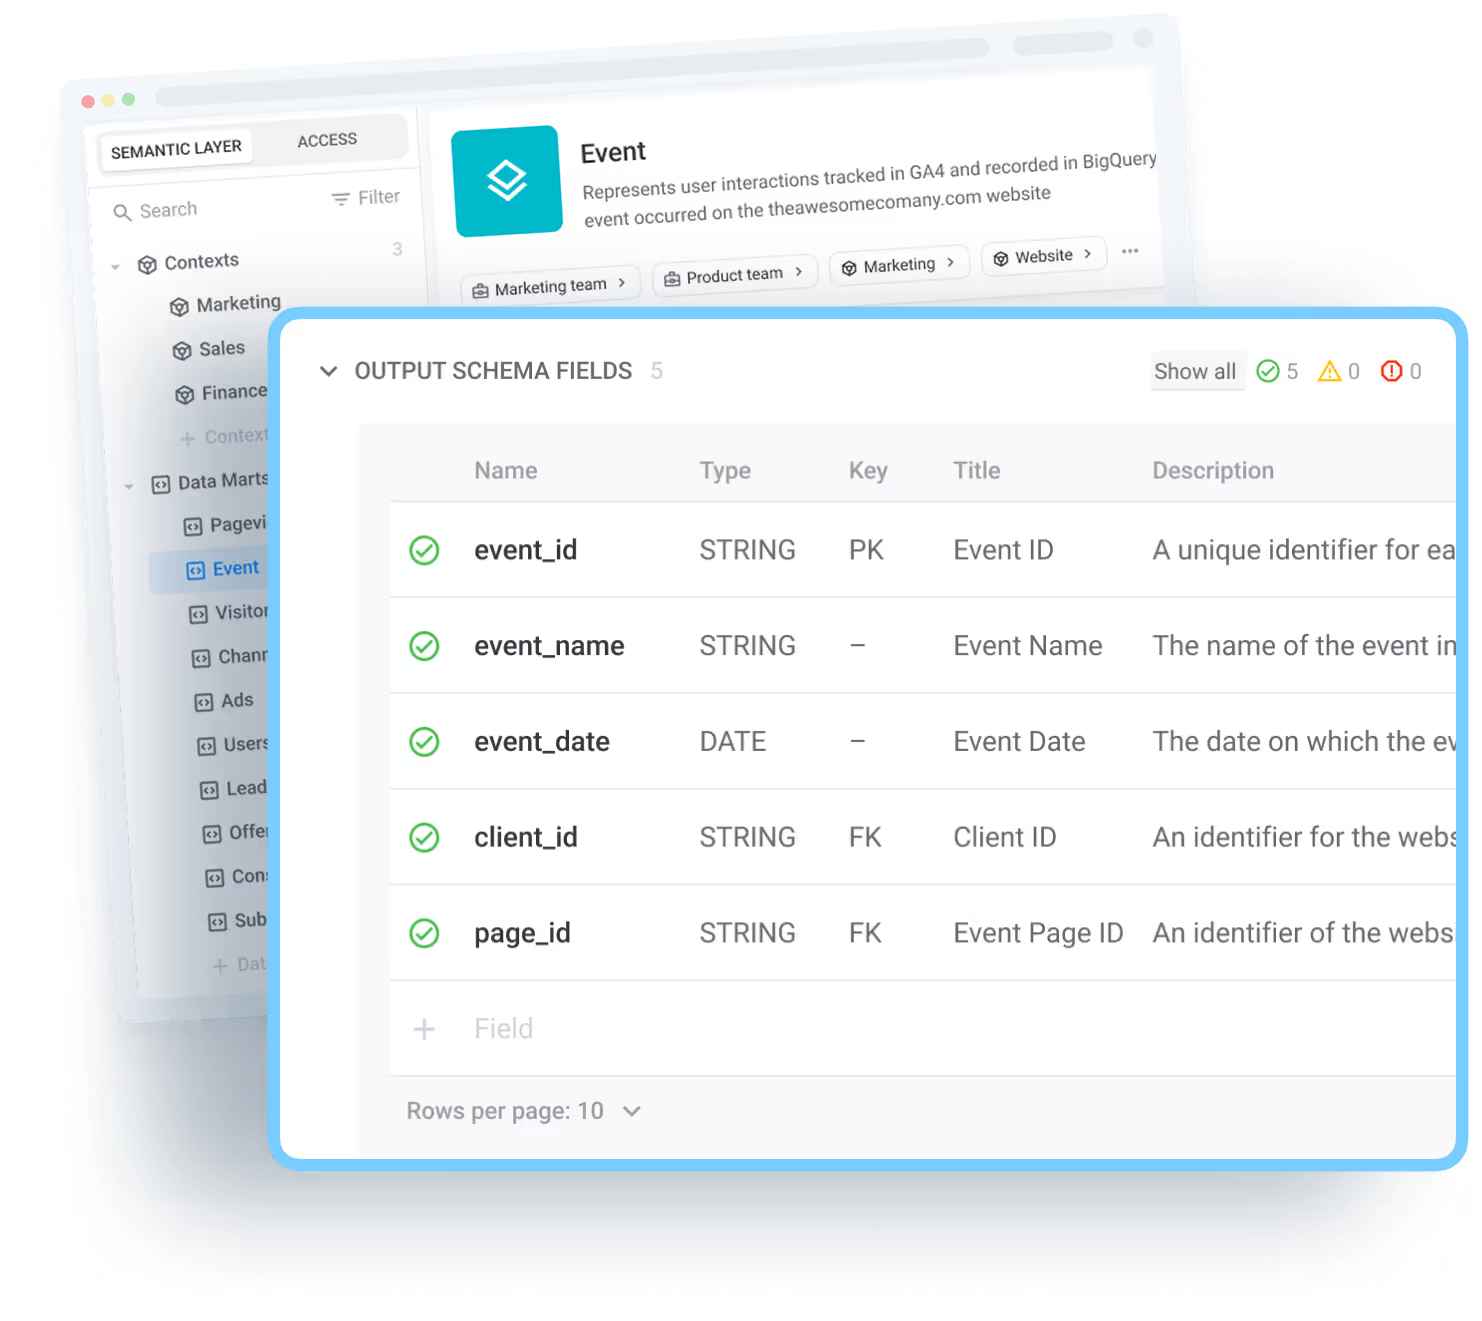
Add Friendly Field Names and Descriptions
Complex or technical column names make it hard for non-SQL users to understand data effectively. Replace them with clear, business-friendly labels like “Customer Count” or “Campaign Cost.” Add concise descriptions explaining what each metric represents, how it’s calculated, and its purpose in reports.
This approach makes datasets approachable for everyone, reducing dependency on analysts for interpretation or clarification. With readable names, structured descriptions, and consistent terminology, users can explore data confidently and turn numbers into meaningful insights without needing to understand SQL or backend schema details.
Document Datasets for Reusability
Every packaged dataset should come with built-in documentation for context and reusability. Include metadata like source details, business rules, update frequency, and calculation notes so other teams can confidently reuse the dataset without asking analysts for explanations or recalculations.
When documentation is standardized and visible, teams gain independence while maintaining data accuracy. They can use the same dataset for campaign analysis, revenue tracking, or forecasting, without worrying about duplicating work or misinterpreting logic. This encourages consistency and transparency across reports and departments.
Version and Document Your Packaged Data
As datasets evolve, version control ensures clarity and accountability. Maintain a short change log noting updates like “v1.1 – Added ROAS metric” or “v1.2 – Introduced region dimension.” This practice helps everyone understand when and why changes were made, improving collaboration and trust.
OWOX Data Marts simplifies version tracking by automatically logging schema and logic updates. Analysts can easily review prior versions, while business users always work with the latest data definitions. This transparency supports governance and avoids confusion over outdated or duplicate datasets.
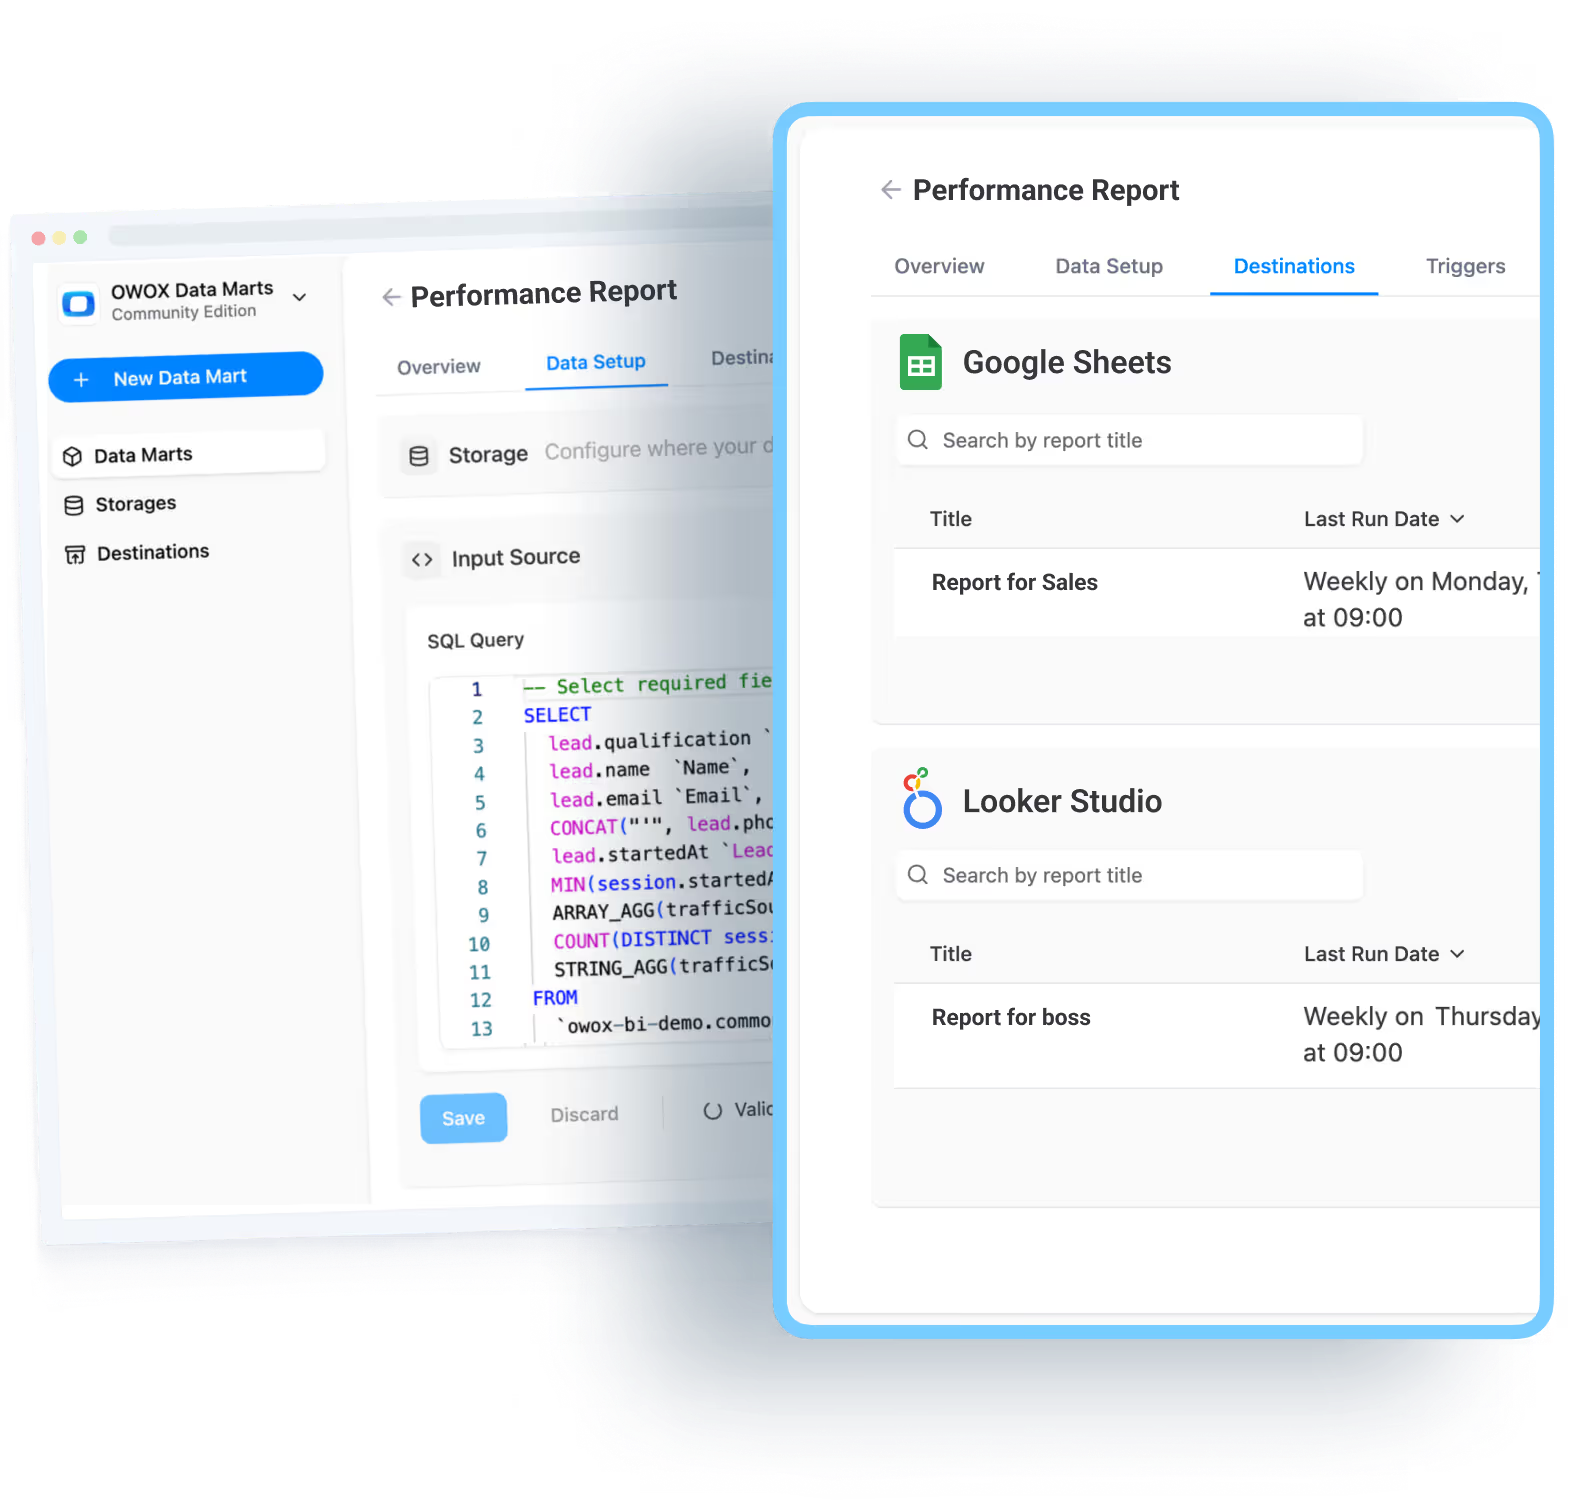
Connect Outputs to Familiar Tools
Once your data is packaged, publish it directly into familiar tools like Google Sheets, Looker Studio, or BI dashboards. This enables non-SQL users to analyze governed data instantly, no manual exports, no SQL, just seamless access. These integrations pull live, verified data directly from the warehouse, ensuring freshness and reliability at all times.
Teams can filter, pivot, or visualize insights on their own, creating a smooth self-service experience. It also ensures everyone works from the same governed dataset, keeping metrics consistent across every tool and report.
How OWOX Data Marts Turn Packaged Data into Governed, Reusable Assets
OWOX Data Marts make it easy to structure and distribute trusted data without losing control. Here’s how analysts use it to move from manual work to scalable reporting.
Define Once, Reuse Everywhere

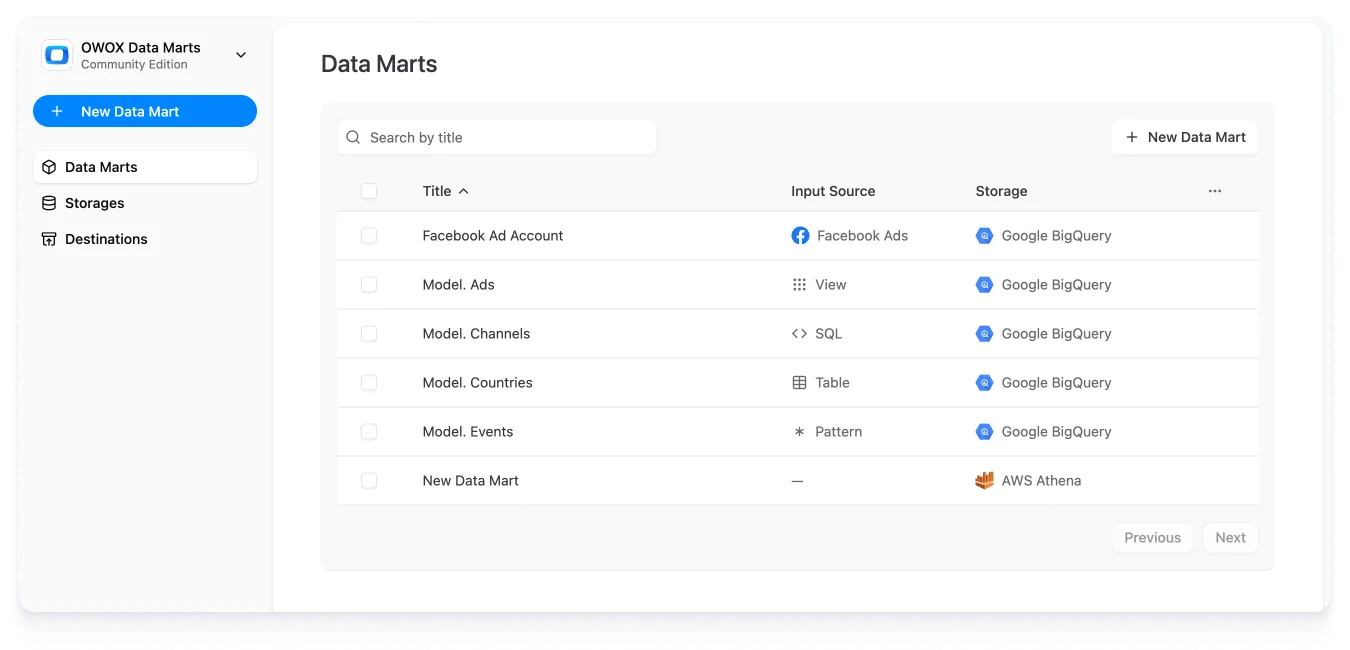
In OWOX, analysts create SQL-based Data Marts once and reuse them across all tools, like Google Sheets, Looker Studio. This eliminates the need to rewrite queries for each new report or team request. The same logic applies everywhere, ensuring consistency across metrics and dashboards.
By defining logic once, analysts can maintain a single version of truth that supports scalable reporting. This not only saves time but also removes the confusion caused by multiple versions of the same data existing across different reports or departments.
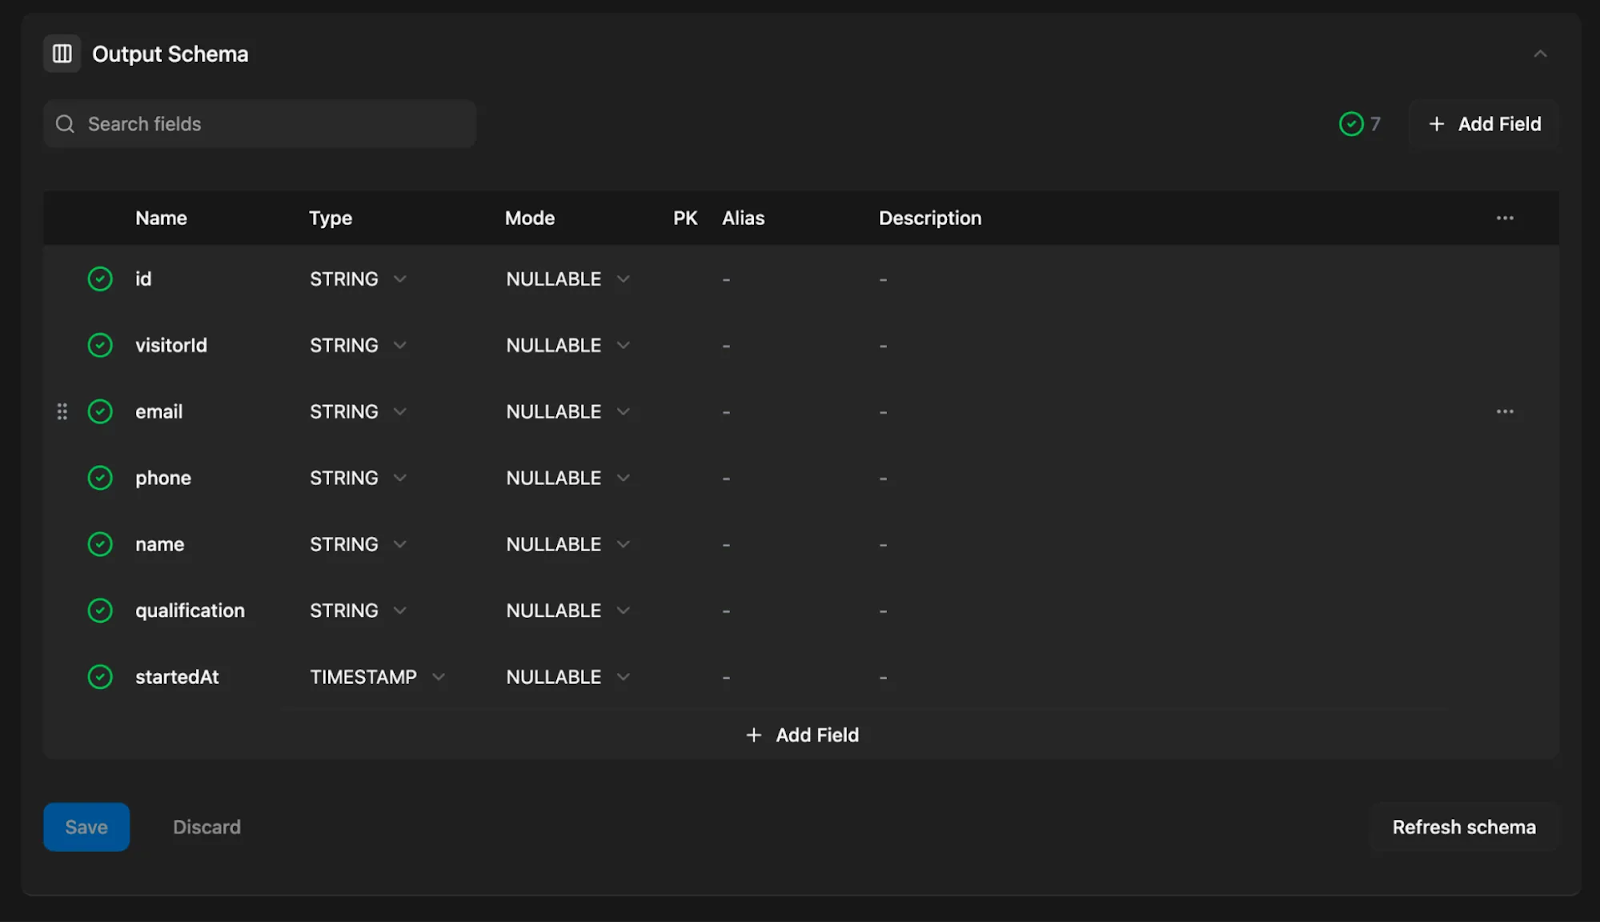
Simplify Schema with Business-Friendly Field Setup
OWOX Data Marts allows analysts to rename technical fields using clear business-friendly aliases such as “Total Revenue” or “Customer ID.” Each field can include short descriptions explaining its purpose and calculation. This makes datasets easy to understand, even for non-SQL users exploring them for the first time.
With descriptive field names and documentation built into the schema, business teams no longer rely on analysts for interpretation. They can confidently use the same governed dataset for reports and analysis without risking confusion or misinterpretation of metrics.
Automated Refresh and Scheduling
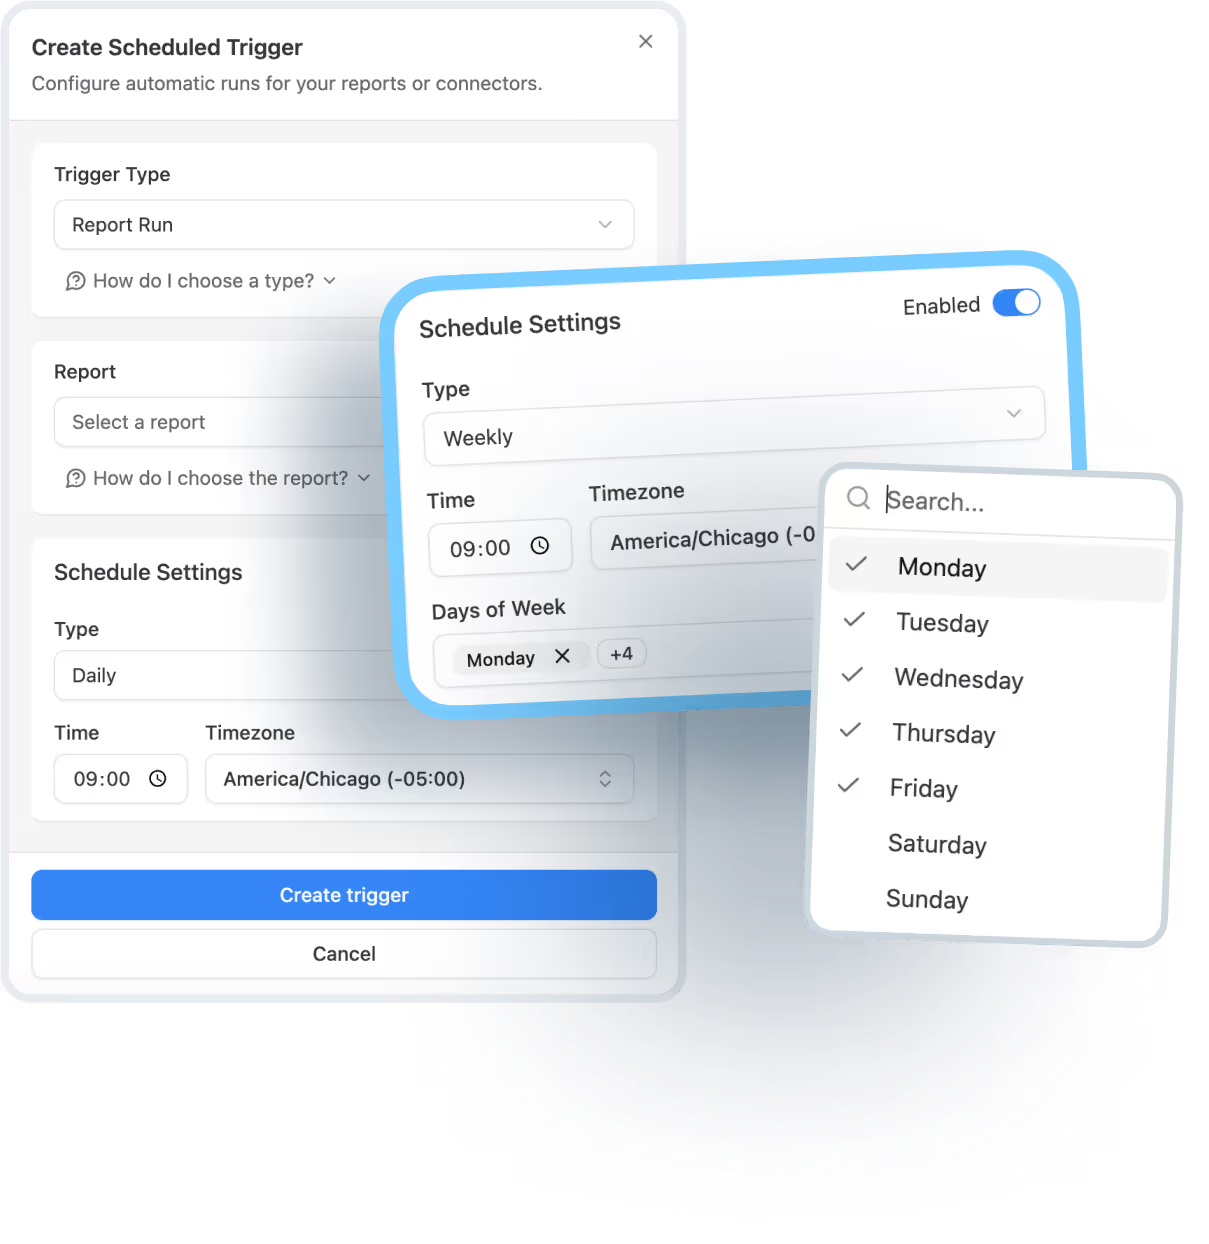
With OWOX report triggers, analysts can automate data refreshes on flexible schedules, daily, weekly, or even at custom intervals. This ensures that every connected report, whether in Google Sheets or Looker Studio, stays up to date without manual intervention.
OWOX lets you automate Data Mart refreshes with two trigger types, keeping reports up to date without manual effort. Here's how each one works:
- Connector Triggers: These triggers refresh the source data from your connected platforms (like Facebook Ads or TikTok). You can schedule them to run hourly, daily, or on custom intervals.

- Report Triggers: Once the source data is refreshed, report triggers update the Data Marts and destinations. This ensures the latest data flows into Google Sheets or Looker Studio without needing analyst intervention.
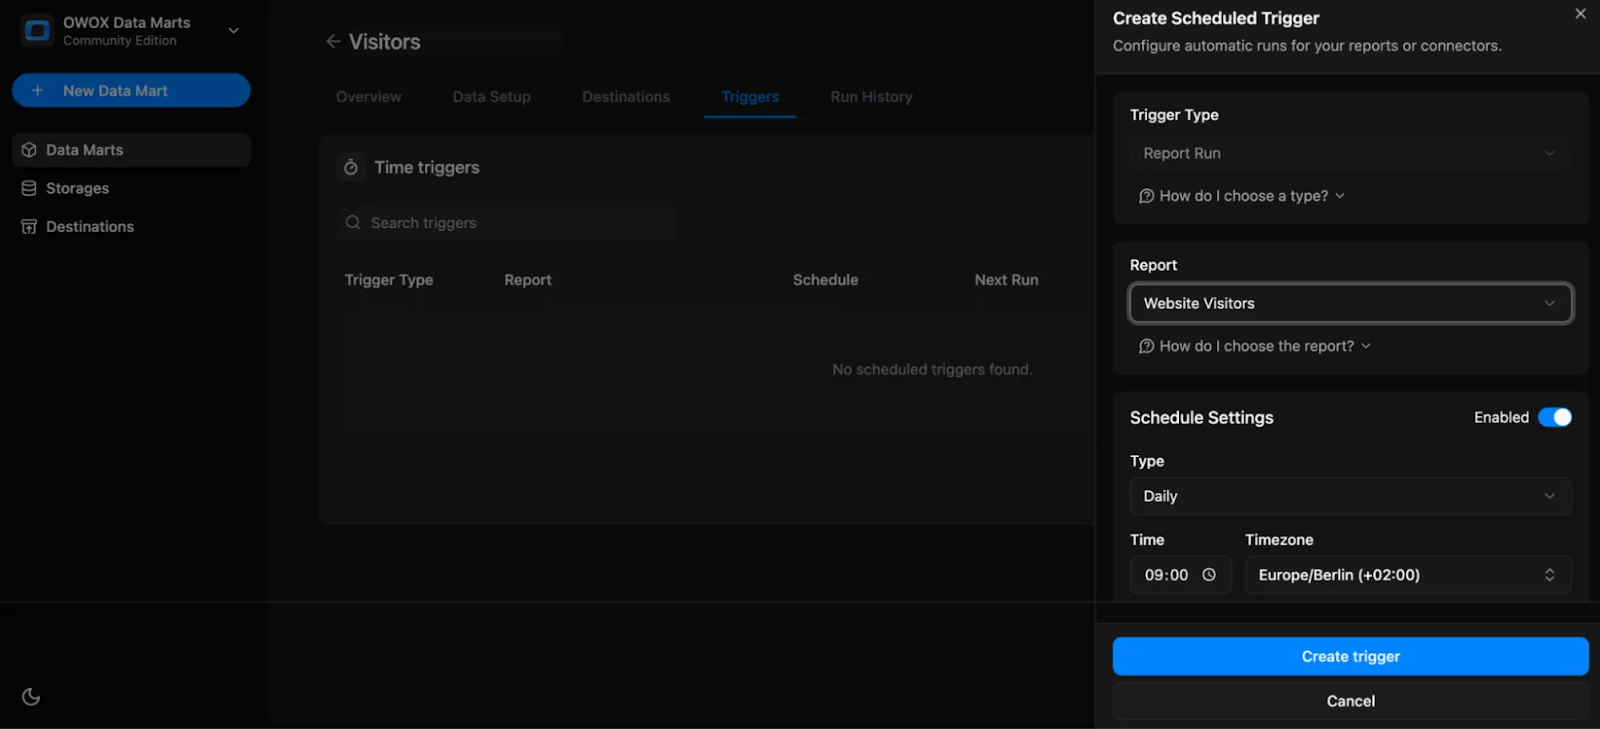
Once triggers are in place, the workload for analysts drops significantly, as most teams report up to 80% fewer “Can you refresh this?” requests. Data stays fresh automatically, giving decision-makers access to reliable numbers without waiting for manual updates or reruns.
Governed Access Control and Transparency
Every OWOX Data Mart comes with built-in access controls, metadata, and audit trails. Analysts can define who sees what, ensuring sensitive metrics are accessible only to authorized users while keeping full transparency into how data flows and transforms.
Each Data Mart also maintains a version history of schema and metric changes. This provides complete traceability, helping teams track updates over time and understand how definitions have evolved, all while maintaining confidence in the integrity of shared data.
Deliver Scalable Reporting Across Tools
Governed Data Marts in OWOX seamlessly connect to BI tools and spreadsheets, delivering consistent, trusted data wherever it’s needed. Teams in marketing, finance, and operations can explore governed datasets independently without relying on SQL queries or analyst support.
By enabling this direct connection, OWOX eliminates duplication and manual exports. Everyone works from the same reliable source of truth, ensuring reports across Sheets, Looker Studio, or other BI tools reflect identical numbers, improving trust, speed, and collaboration across departments.
Before and After – From Manual Reporting to Scalable Workflows
Reporting transforms completely when analysts move from manual SQL work to governed Data Marts. This section shows how OWOX replaces repetitive, error-prone reporting with automated, scalable workflows that teams can trust.
The Manual Reporting Trap
In traditional reporting setups, analysts spend countless hours rerunning the same SQL queries, exporting data, and updating spreadsheets by hand. Each small change requires manual edits, increasing the chances of errors and version mismatches across reports. When dashboards break, analysts must stop strategic work to fix them, a cycle that drains time and focus.
Meanwhile, different departments often create their own versions of the same report, each with slight variations in logic or filters. This duplication leads to inconsistent numbers, confusion, and delays in decision-making, making reporting a constant uphill battle.
Scalable Reporting with OWOX Data Marts
With OWOX Data Marts, analysts only need to define SQL logic once and publish it as a reusable Data Mart. These packaged datasets automatically feed into dashboards and reports, eliminating the need to re-query or manually refresh data. Scheduled triggers ensure that every report stays up to date without analyst intervention.
Business users can directly explore trusted data in Google Sheets or Looker Studio without writing SQL or waiting for updates. This shift frees analysts from repetitive work, improves accuracy, and gives every department reliable access to governed, real-time insights.
From Bottlenecks to Empowerment: What Teams Gain with OWOX
When reporting becomes automated and governed through OWOX Data Marts, both analysts and business users benefit. This section highlights how teams gain efficiency, trust, and autonomy while working with reliable, self-service data.
Analysts Shift from Reactive to Strategic
Once reporting is automated through OWOX Data Marts, analysts no longer spend hours fixing dashboards or rerunning SQL queries for repetitive requests. Their time shifts from maintenance to meaningful analysis, forecasting, and long-term planning that adds real value.
With fewer manual tasks, analysts can identify growth opportunities, optimize models, and guide business strategy. Instead of being reactive executors, they become proactive problem solvers, using data to shape decisions, not just report them. This transformation elevates analytics from a support function to a strategic advantage.
Teams Gain Trust and Autonomy in Data
When teams access governed datasets in familiar tools like Google Sheets or Looker Studio, they gain the confidence to explore data independently. Every metric follows the same definition and logic, ensuring consistent numbers across all reports.
This transparency builds trust and removes the need for constant analyst involvement. Marketing, finance, and operations teams can answer their own questions quickly without worrying about accuracy. The result is faster decisions, fewer dependencies, and a stronger culture of accountability around data-driven insights.
OWOX Makes It All Possible
OWOX Data Marts unifies data management, automation, and governance within one seamless system. Analysts can define SQL logic once, automate refreshes, and make reliable data available across all departments and tools. This structure removes the guesswork and friction from reporting.
By combining governance and accessibility, OWOX turns scattered data processes into a consistent, scalable ecosystem. Analysts maintain control over definitions and updates, while business users get accurate, always-fresh data, empowering both sides to focus on insights instead of maintenance.
From SQL Bottleneck to Self-Service Ecosystem
Before adopting OWOX, analysts juggled endless SQL queries, manual exports, and dashboard fixes, leaving no time for strategic work. Now, with governed, automated Data Marts, the same logic powers every report effortlessly.
For example, instead of pulling campaign spend manually, analysts define it once, and marketing sees live, daily refreshed numbers in Google Sheets. This shift from firefighting to self-service turns data chaos into clarity, freeing teams to explore insights independently while ensuring analysts retain full governance and control.
Turn Bottlenecks into Scalable Reporting with OWOX Data Marts
Stop wasting analyst time on repetitive SQL requests and manual report updates. With OWOX Data Marts, you can define logic once, automate refreshes, and deliver governed datasets to Google Sheets and Looker Studio. Empower business users with self-service access to accurate, always-fresh data, without losing control or consistency.
Build a scalable reporting system where analysts focus on insights, not maintenance, and every team works confidently with trusted, reusable data.
Frequently asked questions


Finally, a tool that doesn't ask business users to learn a new dashboarding UI. Our marketing team already knows Sheets. OWOX just delivers the right data.
Joinable data marts concept was the thing that sold us. We can now use the semantic layer without building one.
Self-hosted the OSS version on Digital Ocean. Zero vendor lock-in. Contributed a Shopify connector back in week two.