Why Your Dashboard and Your Accountant Disagree on Revenue
The marketing dashboard says one revenue, the accountant says another, and the Monday meeting is spent arguing about which is right. Neither is wrong: the dashboard counts an order at checkout, gross, the way the ad platforms count it; the books count an invoice on its accounting date, net of refunds, discounts and tax, and only the books know the cost of goods. This article shows the two sets of tables in one business data model, walks you around it, and reads one company's books through it: what was invoiced against what was collected, who owes what and for how long, and the A/R aging that matched QuickBooks to the cent.
Every Monday the marketing dashboard says revenue is up. Every month-end the accountant’s profit and loss says less. You ask both for last month’s revenue, get two different numbers, and nobody can tell you which one goes in the board update.
The fix is not to pick a side. It is to make the difference itself a number. For the board, use the books’ figure. For Monday, use both, with one line per cause between them. That page exists only when the dashboard’s tables and the books sit in one place, joined, so the gap is a column you can read rather than a dispute you referee. Neither side is lying; they count different things, and here is how.
Two systems, two questions
The dashboard reads your store and your ad platforms. It counts an order the second checkout completes, gross, and takes the ad platform’s word for which campaign caused it. Its question is “is marketing working this week?” The books read invoices, payments, bills and the chart of accounts. They count a sale on its accounting date, net of refunds and discounts, with sales tax set aside, and they alone know the cost of goods. Their question is “did the company make money this month?”
| What | The dashboard says | The books say |
|---|---|---|
| Timing | At checkout, on the order date | On the invoice date (accrual: counted when billed) or when cash arrives (cash basis: counted when paid) |
| Gross or net | Gross order value, tax inside it | Net of discounts, sales tax kept out of income |
| Refunds | Often not subtracted | A credit memo or refund receipt, dated when it was issued |
| Cost of goods | Not there, or a rough margin assumption | Posted to a cost account per item |
| Credit | The ad platform’s own attribution | None recorded; a sale is a sale |
Five causes, each legitimate; over a month they drift the two totals apart by design. If your store is paid by card at checkout, the timing gap moves to the payout, which lands days later, net of the processor’s fee, often across a month-end. The usual fix is a monthly spreadsheet: the Monday argument with extra steps.
Put the books in the picture
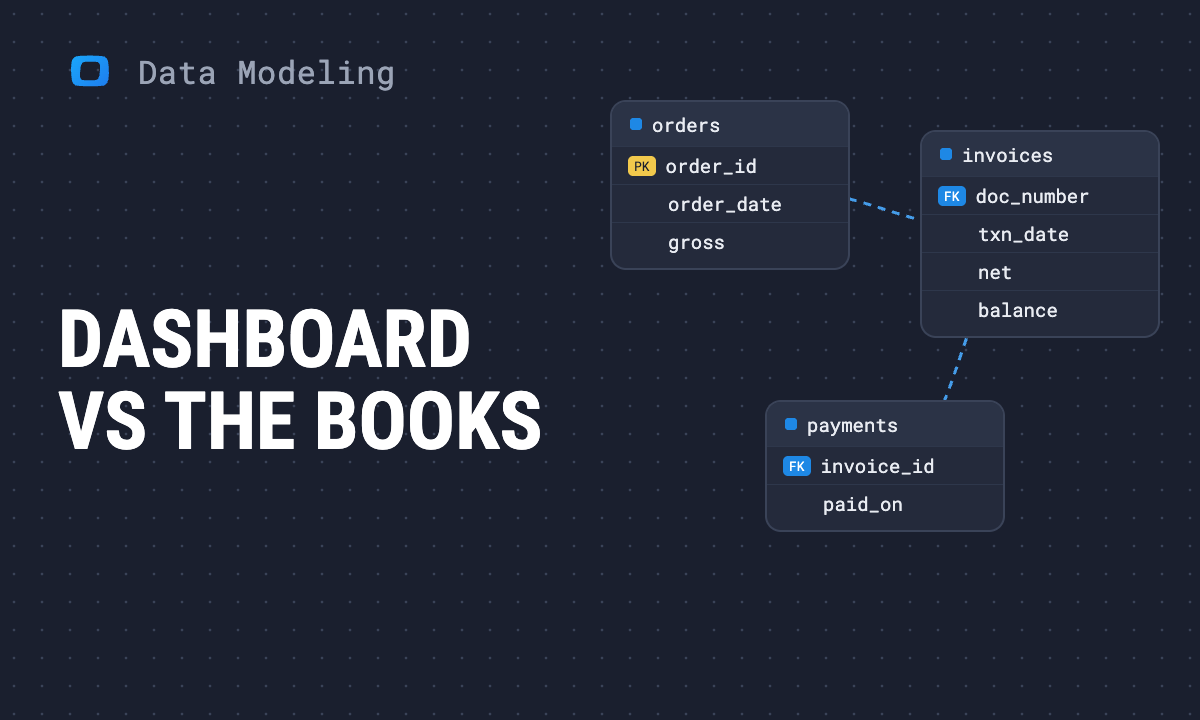
The better move is to treat the books as part of the business data model, not as a separate world. Below is the model most online stores recognize, with the QuickBooks tables beside it: blue and green badges are the storefront and its ad platforms, orange ones come from QuickBooks through the QuickBooks data source.
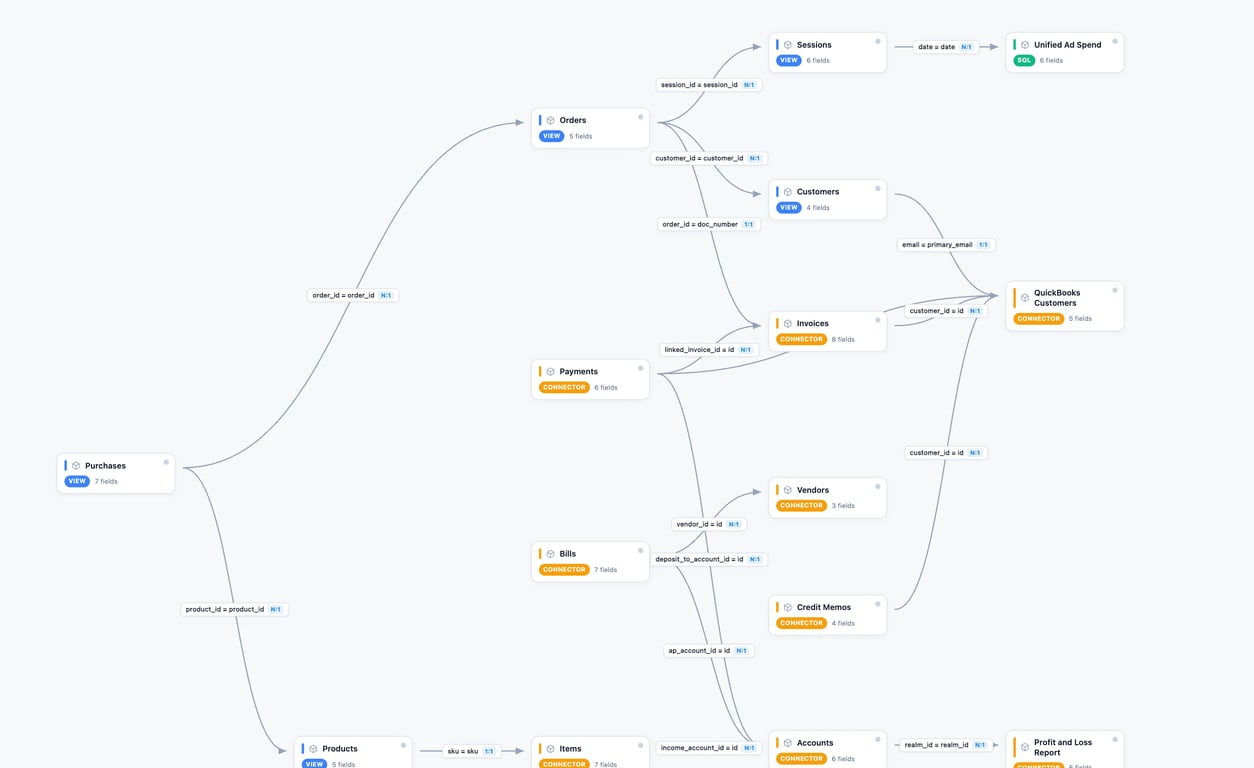
Read it from the top:
- Sessions, ad spend, orders and order lines are the dashboard’s world: a visit, what it cost to bring in, what was ordered and at what price.
- Invoices and payments are the same sales as the accountant sees them. When the store posts one invoice per order, the order number sits on the invoice and each order meets its invoice; when it posts a daily summary, the day is the key. Payments say when the money actually arrived; that is where accrual and cash part ways.
- Credit memos are the refunds the dashboard forgot. Items and accounts hold the cost of goods per product. Bills and vendors are the other side: the agency, the supplier, the ad platform’s own invoice.
- The profit and loss report is the number your accountant signs, kept as a dated snapshot so any rebuilt number is checked against it rather than argued with.
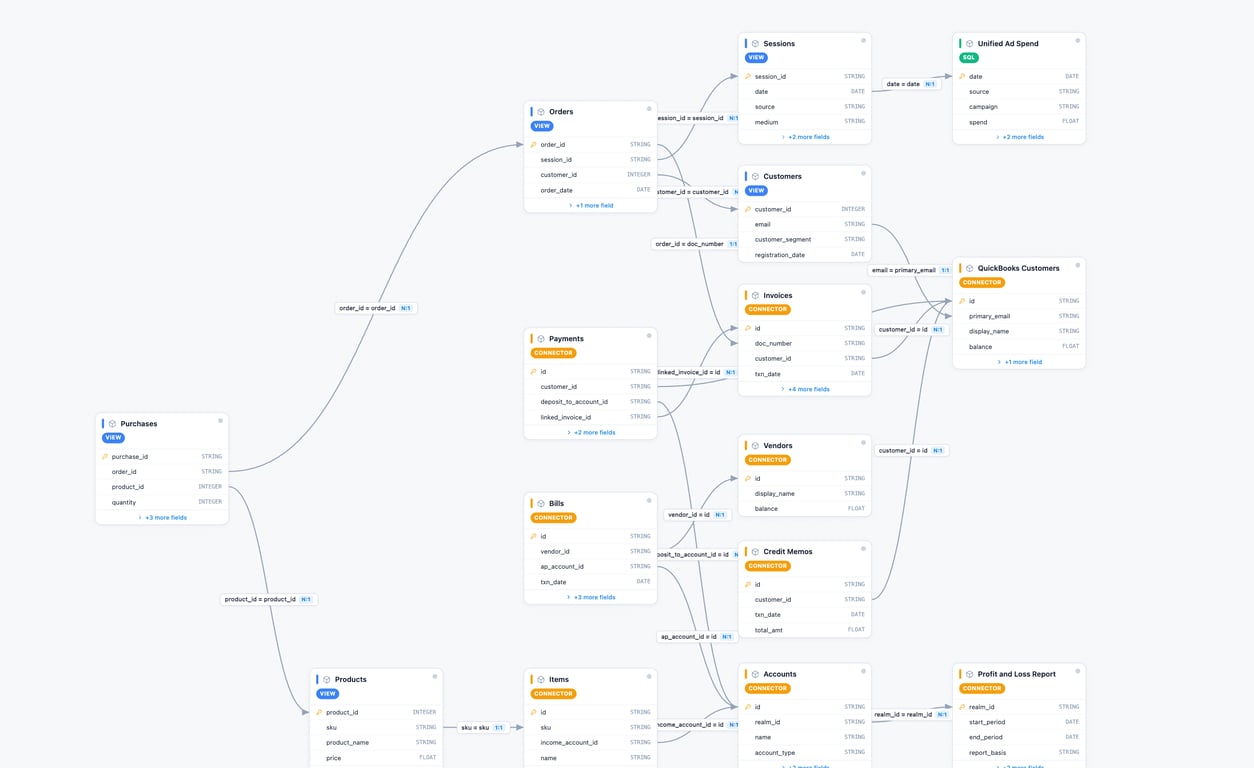
Once this is one model in your data warehouse, dashboard revenue and book revenue are two columns of one table, with the difference split by cause. The keys are already in your data; the second drawing opens the fields.
OWOX Data Marts
See your first report built in real time. 15 minutes.
- Connect your data warehouse
- Pick your metrics
- Get a live Google Sheets report
In the time it takes to write a ticket. Then imagine never writing that ticket again.
Book a DemoWe'll use your actual use case
What one company’s books showed
What one company’s books showed
We loaded one company’s QuickBooks Online into its data warehouse with OWOX Data Marts and read it through this model. The books are small, which makes the pattern easy to see; if your store is paid at checkout, read “invoiced” as ordered and “collected” as paid out.
| Month | Invoiced (tax included) | Collected in the month |
|---|---|---|
| September | 4,181 | 652 |
| October | 4,102 | 3,699 |
A dashboard would have called September a strong month; a cash view would have called it weak. Both are true: customers took 19 days on average to pay, and 12 of 16 payments landed in a different month from the invoice they settled.
The books also carried what no order total does. In October they set 143.02 of sales tax aside from the 4,101.57 invoiced, and recorded 59.00 of discounts and 405.00 of cost of goods: the gross-or-net and cost-of-goods rows of the table, with numbers, from the same tables.
On the receivables side, 5,281.52 was still open across 17 customers, and the model’s own aging of it (how long each unpaid invoice has been outstanding) matched QuickBooks’ A/R Aging Summary in every bucket, to the cent. The analyst guide shows the full check.
Monday, with one model
With the books in the picture, the QuickBooks accounting dashboard answers the questions you bring to the meeting, from the tables the accountant will close the month on:
- Did we sell more, and did we get paid? Invoiced and collected, side by side, by month.
- Who owes us, and for how long? Open balance by customer, by how long it has been outstanding.
- Where is the money going? Bills by vendor and expense account.
- Is the margin real? What each item sold for, against its cost from the books rather than a guess.
The question a founder brings to the numbers is “am I growing the business or losing it today, and why”. The dashboard alone answers the first half; the books alone answer it a month late. Joined, the answer arrives with its reason, on one short page: the dashboard’s number at the top, one line per cause from the table above (plus the processor’s fees), the books’ number at the bottom, and whatever is left over flagged. With both sides in one model, that page is a scheduled report.
What finance keeps
Putting the books beside the orders does not move the books. The chart of accounts, the accounting method and the close dates stay in QuickBooks and stay finance’s. The data warehouse holds a copy on a schedule, with the reports kept as dated snapshots, so the month finance closed stays on record as it was closed.
What to ask for
You do not need to build this yourself. Send three things to the person who built your dashboard, in-house or at your agency, and copy your accountant, whose only task is to say which basis the books are on and when a month is closed:
- The QuickBooks data source page: every table the connector loads and how they join.
- The analyst guide: loading the books and reconciling them to the P&L and the aging report.
- The dashboard page: what the Monday view is meant to look like.
Then ask one question on Monday: “what was invoiced, what was collected, and what is the difference made of?” If the answer comes from one model, the argument is over.
Turn your data into decisions.
Governed data marts give you the clean foundation ML needs to actually work.
- No AI hallucinations
- Analyst-governed definitions
- Every number traces to SQL
Frequently Asked Questions
Which revenue number should go in the board update, the dashboard's or the books'?
The books' number. It is the one your accountant will close the month on, net of refunds, discounts and tax, and the one an auditor or a bank will ask for. Show the dashboard's number next to it as gross orders, with the difference explained line by line: timing, refunds, discounts, tax and processor fees. When both come from the same data model, that bridge is a report, not a monthly project.
Why is my marketing dashboard revenue higher than QuickBooks?
Because the dashboard counts an order at checkout, at the gross amount, and QuickBooks counts a sale on its accounting date, net of refunds, credit memos and discounts, with sales tax kept out of income. Refunds issued later, orders paid out in the next month, and tax inside the order total are the usual reasons the dashboard reads higher. Put the invoices, payments and credit memos next to the orders in one data warehouse and the gap splits into those causes.
What is the difference between accrual and cash revenue, in plain words?
Accrual counts a sale when you invoice it or deliver it; cash counts it when the money arrives. A September invoice paid in October is September revenue on accrual and October revenue on cash. In one company's books, 12 of 16 payments landed in a different month from the invoice they settled, and customers took 19 days on average to pay, so the two views of the same month can differ by most of a month's sales.
Does putting QuickBooks in a data warehouse change the books?
No. The data warehouse holds a copy of the QuickBooks tables and dated snapshots of its reports, refreshed on a schedule; the connector reads, and nothing in the model posts back to the books. The chart of accounts, the accounting method and the close dates stay in QuickBooks and stay with finance. Marketing reads the same revenue the accountant reports, from the same tables, which is why both sides can use it in the same meeting.