Best Data Modeling Tools in 2026
“ modeling tool” means five different things depending on who you ask. To a database designer it’s an ERD editor. To an analytics engineer it’s dbt. To a BI lead it’s a semantic layer like LookML. To someone wiring up an AI assistant, it’s whatever gives the model a trustworthy description of the data. All of them are “data modeling” – they just operate at different layers of the stack.
This guide maps the landscape so you can pick by where you actually work, not by which vendor shouts loudest. Each tool below is genuinely strong in its lane; we’ll be clear about what each is for and where it stops. If the term itself is fuzzy, start with our guide to data modeling and the primer on dimensional data modeling.
The four layers of “data modeling”
The four layers of “data modeling”
Before the tools, the map. Most confusion comes from comparing tools that live at different layers:
(1) Design / ERD – draw the entities, keys, and joins. The conceptual/logical picture.
(2) Data transformation – turn raw tables into modeled tables (the physical layer). This is dbt’s home.
(3) Relations – define metrics, dimensions, and relationships once so every tool answers consistently. Complex – LookML, Cube, dbt’s Semantic Layer, or Easy – OWOX Data Marts.
(4) Portable spec – describe the model in an open, tool-agnostic, machine-readable format you can version and hand to an AI. This is the newest layer, and where OKF sits.
A complete stack often uses more than one. The tools below are grouped by the layer they serve.
The tools, at a glance
| Tool | Layer | Free Option | Output / Portability | AI-Ready |
|---|---|---|---|---|
| dbt | Transformation | Core is open-source | SQL models, docs site, exposures | Partial (docs) |
| LookML (Looker) | Semantic | No (paid) | Looker-only semantic model | Via Looker |
| Cube | Semantic | Open-source | API + semantic layer | Yes (API) |
| dbdiagram.io | Design (ERD) | Generous free | DBML, SQL, image | – |
| DrawSQL | Design (ERD) | Free (limited) | SQL, image | – |
| SqlDBM | Design (warehouse) | Free tier | DDL, image | – |
| erwin / ER/Studio | Design (enterprise) | No (paid) | DDL, docs | – |
| OWOX Model Canvas | Design → Portable spec | Free, no sign-up | OKF (portable markdown), image | Yes (AI-readable) |
OWOX Data Marts
See your first report built in real time. 15 minutes.
- Connect your data warehouse
- Pick your metrics
- Get a live Google Sheets report
In the time it takes to write a ticket. Then imagine never writing that ticket again.
Book a DemoWe'll use your actual use case
dbt – the default for transformation modeling
dbt – the default for transformation modeling
If “data modeling” means turning raw tables into clean, tested, documented models, dbt is the industry standard. You write SQL models, dbt handles dependencies, tests, and a generated docs site, and exposures let you declare downstream uses. dbt Core is open-source and free. What dbt is not is a visual design tool – you model in SQL and YAML, and the “diagram” is the auto-generated lineage graph. For how OKF compares to dbt’s own way of describing models, see OKF vs dbt exposures vs LookML.
LookML / Looker – semantic modeling, if you’re in Google ecosystem
LookML / Looker – semantic modeling, if you’re in Google ecosystem
LookML is a mature way to define a semantic model – dimensions, measures, and joins – so that every Looker report answers consistently. It’s powerful and battle-tested.
The catch is lock-in: LookML lives inside Looker, and the model isn’t portable to other tools or easily handed to an external AI agent. Great if Looker is your BI layer; limiting if you want the model to travel.
Plus this is a very complex tool, and data folks typically don’t want to spend months on setting this up.
Cube – the open-source semantic layer
Cube – the open-source semantic layer
Cube gives you a semantic layer (metrics, dimensions, joins) exposed over an API, and it’s open-source. It’s a strong pick when you want consistent metrics across several front-ends – dashboards, spreadsheets, and increasingly AI apps – without committing to one BI vendor.
It’s config-driven rather than visual, so it pairs well with a design tool for the picture.
Cube is easier than LookML, but still too complex for a small or medium-sized business.
dbdiagram.io & DrawSQL – fast ERD design
dbdiagram.io & DrawSQL – fast ERD design
For the design layer specifically, dbdiagram.io (DBML text → diagram) and DrawSQL (visual, polished) are the popular free picks.
They’re excellent for sketching and communicating a schema.
Both stop at the diagram plus SQL export – the output is for humans, not a model or AI tools. We compare them in depth in best free ERD tools, and head-to-head in OWOX Model Canvas vs dbdiagram.io and vs DrawSQL.
SqlDBM, erwin & ER/Studio – warehouse and enterprise design
SqlDBM, erwin & ER/Studio – warehouse and enterprise design
SqlDBM is a browser-based data warehouse modeling tool (Snowflake, BigQuery, etc.) with a free tier and DDL generation. erwin Data Modeler and ER/Studio are the long-standing enterprise choices – deep governance, standards, and forward/reverse engineering, but paid and heavyweight.
Reach for these when compliance and large-team governance matter more than speed.
OWOX Model Canvas – design that outputs a portable, AI-ready model
OWOX Model Canvas – design that outputs a portable, AI-ready model
OWOX Model Canvas sits where the design layer meets the portable-spec layer.
It’s a free, open-source visual canvas where tables, keys, and joins are first-class – draw a model, import one, or describe it and let AI draft it.
Its distinguishing move is the output: it exports OKF (Google’s Open Knowledge Format), a plain-markdown description of the model you can keep in git, review in a pull request, and feed to an LLM as context.
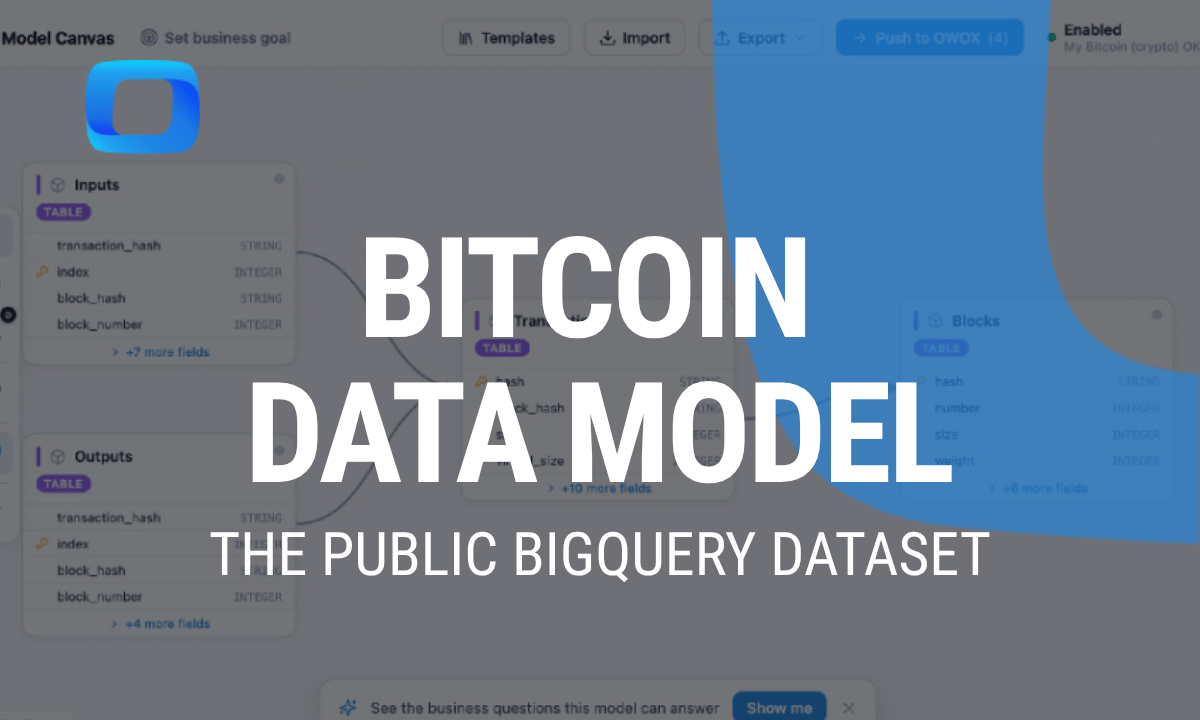
It opens Google’s official GA4, Stack Overflow, and Bitcoin samples, as well as dozens of other templates that we prebuilt based on out 15+ years of analytics expertise. OWOX modeling tool needs no sign-up, and can push a finished data model into Data Marts to enable self-service analytics in just a few clicks.
Start from a template if you don’t want a blank canvas.
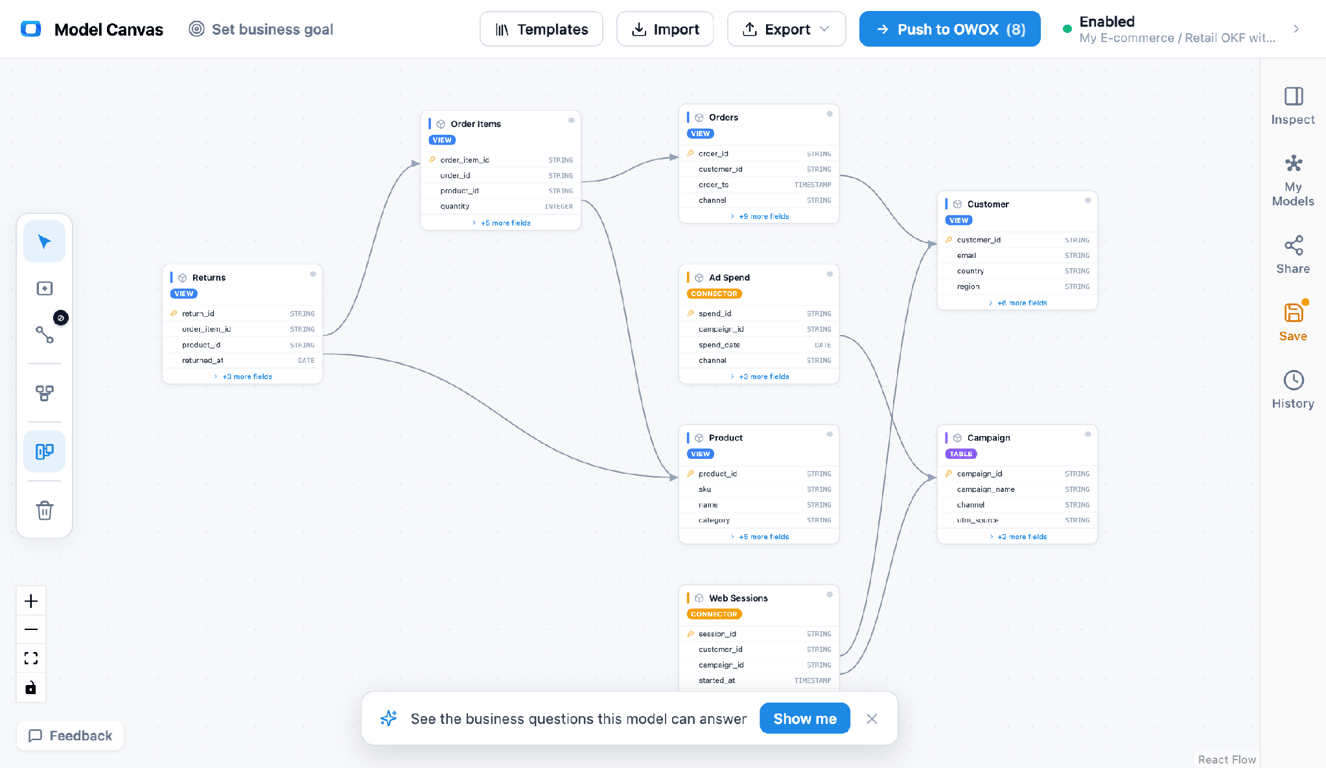
Draw or AI-draft the model, then export OKF (portable markdown) or an image – a spec you can version and hand to an LLM.
The differentiator in 2026: is your model AI-readable?
The differentiator in 2026: is your model AI-readable?
For a decade, data modeling tools competed on the human experience – nicer diagrams, better collaboration, tighter warehouse integration. In 2026 there’s a new axis: can an AI read your model?
Text-to-SQL and “chat with your data” assistants fail the same way – they invent columns and pick wrong joins – because they lack a trustworthy, machine-readable description of the data. A Looker model can’t leave Looker.
A PNG from a diagram tool is a dead end.
What an agent needs is a portable spec: tables, columns, and joins in an open format it can consume directly.
That’s the gap an open standard like OKF fills, and it’s the fastest-moving reason teams are re-evaluating their modeling stack. When you compare tools now, add one question to your checklist: what does it output, and can a machine read it?
How to choose
- You transform raw tables into clean models → dbt (the default; open-source Core is free).
- You need consistent metrics across many tools → a semantic layer – Cube (open-source) or LookML (if you’re on Looker).
- You just need to design and communicate a schema → an ERD tool – dbdiagram.io, DrawSQL, or SqlDBM for warehouses.
- You have enterprise governance requirements → erwin or ER/Studio.
- You want the model to be portable and AI-readable → OWOX Model Canvas (exports OKF, opens Google’s samples, open-source, no sign-up).
Most real stacks combine two or three: a design tool for the picture, dbt for transformation, and a portable spec so the model travels – into git, into another tool, or into an AI agent. For the design fundamentals underneath all of this, see understanding star schema and our roundup of free database diagram design tools.
Turn your data into decisions.
Governed data marts give you the clean foundation ML needs to actually work.
- No AI hallucinations
- Analyst-governed definitions
- Every number traces to SQL
Frequently Asked Questions
Can I keep my data model in version control?
Yes, with the right tools. dbt models are code; Cube configs are code; and OWOX Model Canvas exports OKF as plain text you can commit, diff, and review in a pull request. Diagram-only tools that export just an image are harder to version meaningfully.
Is LookML worth it outside Looker?
LookML is tightly coupled to Looker — its value is realized inside that ecosystem. If you're standardizing on Looker it's excellent; if you want a portable, tool-agnostic model, an open format like OKF or an open semantic layer like Cube travels better.
Do I need both a semantic layer and an ERD tool?
Not necessarily. They solve different problems — the ERD is the design picture, the semantic layer enforces consistent metrics at query time. Small teams often start with a design tool and a portable spec; larger BI setups add a semantic layer as consistency needs grow.
Which data modeling tool is best for AI / LLMs?
Pick one whose output a machine can read. A semantic layer with an API (Cube) or a portable open spec (OKF, via OWOX Model Canvas) both give an agent structured context, which is what stops text-to-SQL from hallucinating joins. A diagram image does not.
What is the best free data modeling tool?
It depends on the layer. dbt Core (transformation) and Cube (semantic) are free and open-source; dbdiagram.io and OWOX Model Canvas are free for design. If you want the model to be portable and AI-readable, OWOX Model Canvas exports OKF with no sign-up.
What's the difference between dbt and a data modeling tool?
dbt models the *transformation* layer — it turns raw tables into clean, tested tables in SQL. ERD and design tools model the *conceptual* layer — the diagram of entities and joins. They're complementary: many teams design the model visually, then implement it in dbt.
What is a data modeling tool?
It's software that helps you describe how your data is structured — entities, columns, keys, and the relationships between them — and often to turn that description into something reusable (SQL, a semantic layer, or a portable spec). The category spans ERD editors, transformation tools like dbt, semantic layers, and open formats like OKF.