Data lineage: how to trace a number back to its source
What data lineage is, a step-by-step way to trace a wrong number to its source, and runnable BigQuery SQL that reads lineage from your warehouse's own metadata.
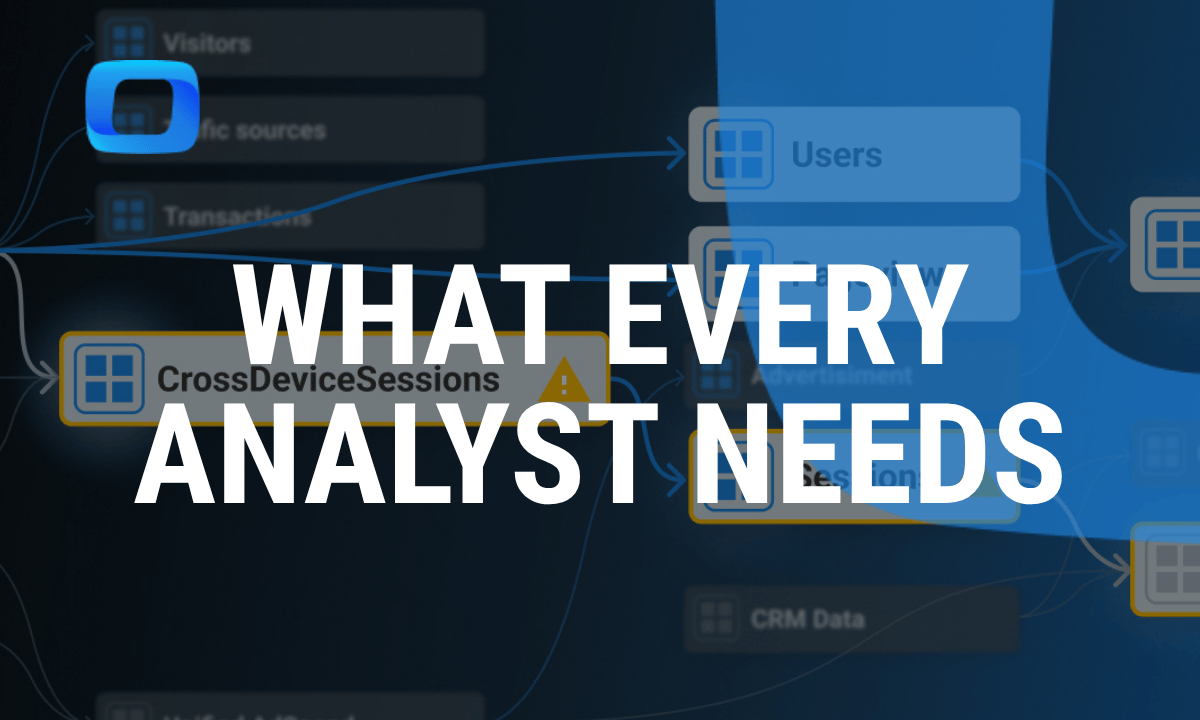
Data lineage is the record of where a number’s data came from and every step it passed through on the way: the source tables, the joins, the filters and the calculations. It answers two questions. When a number is wrong, which step made it wrong? And when you change a table, which reports will change with it?
Most pages on lineage describe the tools that draw it. This one is for the analyst who has a wrong number in front of them today: a procedure to trace it, and SQL that reads lineage from the metadata your warehouse already keeps.
Note: Originally published in July 2024. Fully updated in October 2026 with a tracing procedure, runnable BigQuery metadata queries and what they returned on our demo data.
What data lineage records
Lineage comes at two levels of detail:
| Level | Answers | Example |
|---|---|---|
| Table level | Which tables feed this table or report | orders reads sessions |
| Column level | Which columns feed this column | revenue is quantity × sale_price from purchases |
It is used for three jobs:
- Root cause. A number is wrong; walk back until you find the step where it changed.
- Impact. A source table will change; walk forward to find every report that reads it.
- Audit. Someone needs to know where a reported figure came from, for a review or a regulator.
Lineage is not the same as data quality. Lineage tells you the path; quality checks tell you whether each step on it is sound. A trace without checks finds the step, but not what went wrong there.
How to trace a wrong number to its source
How to trace a wrong number to its source
When someone says “this number is wrong”, the work is the same with or without a lineage tool. Six steps:
- Pin the number. Write down the exact figure, the report, the filters and the date range. “Revenue is too low” cannot be traced; “Q3 revenue for Germany in the weekly report is $412,000” can.
- Find the dataset the report reads. Not the dashboard, the table or view behind it.
- List that dataset’s inputs. From its SQL, its view definition, or the warehouse’s job history (next section).
- Reconcile at each step. Compute the same figure, with the same filters, on each input. The total should match, or differ for a reason you can name: a filter, a status rule, a currency conversion.
- Stop at the step where the number changes without a reason. That is where the problem is: a join that dropped or repeated rows, a filter that was not meant to be there, a source that stopped loading.
- Fix it at that step and write down what you found, next to the dataset, so the next person who traces the same number starts from your note.
Step 4 is where most of the time goes. A trace is a sequence of reconciliations, not a diagram. A lineage graph tells you which tables to check; only the numbers tell you which one is wrong. Common data quality issues shows a join on demo data that changed a spend total by 24% at exactly this kind of step.
OWOX Data Marts
See your first report built in real time. 15 minutes.
- Connect your data warehouse
- Pick your metrics
- Get a live Google Sheets report
In the time it takes to write a ticket. Then imagine never writing that ticket again.
Book a DemoWe'll use your actual use case
Reading lineage from your warehouse’s own metadata
Reading lineage from your warehouse’s own metadata
You do not need a lineage tool to start. Warehouses record what every query read. In BigQuery, two sources are enough for table-level lineage, and both run as plain SQL.
View definitions: what each view reads
SELECT
  table_name AS view_name,
  ARRAY_TO_STRING(ARRAY(
    SELECT DISTINCT ref
    FROM UNNEST(REGEXP_EXTRACT_ALL(
      view_definition, r'`([\w-]+\.[\w-]+\.[\w-]+)`')) AS ref
    ORDER BY ref), ', ') AS reads_from
FROM `owox-demo.ecommerce.INFORMATION_SCHEMA.VIEWS`
ORDER BY view_name
On the [Demo] E-commerce dataset this returns one row per view and the tables it reads. Two warnings from running it:
- The pattern must match a full
project.dataset.tablename. A looser pattern such as anything between backticks returns CTE names and aliases (basket_shift,price_skew,n) as if they were tables, and one that only requires a dot still breaks when a comment in the view contains backticks: thepurchasesview returned about 2,500 characters of comment text. Parsing SQL text with a regex is a shortcut, not a parser. - It only sees views. A table built by a scheduled query or a pipeline has no definition here.
Job history: what queries actually read
Every query job in BigQuery records the tables it referenced. INFORMATION_SCHEMA.JOBS (or JOBS_BY_USER for your own jobs) holds two arrays, and the difference between them matters:
SELECT
  CONCAT(t.dataset_id, '.', t.table_id) AS base_table,
  COUNT(DISTINCT j.job_id) AS jobs
FROM `region-us`.INFORMATION_SCHEMA.JOBS_BY_USER AS j,
  UNNEST(j.referenced_tables) AS t
WHERE j.creation_time >= TIMESTAMP('2026-10-14')
  AND j.job_type = 'QUERY'
GROUP BY base_table
ORDER BY jobs DESC
We ran it on 14 October 2026 over the queries we had run that day on the demo shop’s views (orders, sessions, purchases, ad_performance and others). referenced_tables did not list a single one of those views. It listed the base tables underneath them: seven ad platform tables, each referenced by 283 queries. A query that named only orders was recorded as reading Facebook, Google, TikTok, LinkedIn, Microsoft, Reddit and X ad tables, because in this demo the sessions behind orders are generated from campaign data.
The views are in the second array, referenced_logical_views, which Google documents separately in the JOBS view reference:
| View named or reached (top six) | Queries |
|---|---|
| ecommerce.ad_performance | 279 |
| ecommerce.countries | 253 |
| ecommerce.sessions | 249 |
| ecommerce.orders | 231 |
| ecommerce.products | 159 |
| ecommerce.purchases | 156 |
It includes nested views too: countries appears in 253 queries, far more than named it, because sessions reads it.
The rule: for “who reads this table”, use referenced_tables; for “who reads this view or model”, use referenced_logical_views. Reading only the first, you would conclude nobody uses your orders view. Reading only the second, you would miss which raw tables a change upstream would break.
What metadata lineage cannot see
- Cache hits. Google’s reference says
referenced_tablesis populated only for query jobs that are not cache hits, so a repeated query can leave no trace. - Anything outside the warehouse. A number copied into a spreadsheet or pasted into a slide has no job record.
- Columns. Both arrays are table-level. Column-level lineage needs a SQL parser or a tool built on one.
- History beyond the retention window. Job history is kept for a limited period; old traces have to be saved if you need them.
A real trace on the demo data
Suppose the weekly report shows Q3 2026 revenue of $849,177 and finance says $998,141. Following “Q3 revenue” back through the [Demo] E-commerce views, the metadata gives the path:
| Step | Dataset | Reads |
|---|---|---|
| 1 | purchases (order lines, revenue) | orders, products, sessions |
| 2 | orders | sessions |
| 3 | sessions | ad_performance, countries |
| 4 | ad_performance (unified ad spend) | 7 ad platform tables |
Then the reconciliation, the same quarter at each step:
| Step | What we counted | Q3 2026 |
|---|---|---|
| sessions | Sessions that converted | 1,942 |
| orders | Orders placed | 1,942 |
| purchases | Orders with at least one line | 1,942 |
| purchases | Revenue, all order lines | $998,140.86 |
| orders + purchases | Orders with status Completed | 1,652 |
| orders + purchases | Revenue, completed orders only | $849,177.41 |
Every step agrees until the status rule. Sessions, orders and order lines all count 1,942 orders, so nothing is lost or duplicated on the way. The whole $148,963 gap appears at one step, the filter on order status: 290 orders were cancelled or returned. The trace ends in two minutes with a verdict that is not a data error at all: the report and finance use different definitions of revenue. That is a common ending, and only a reconciliation can tell it apart from a broken join.
The path also shows a dependency nobody would guess: in this demo, sessions are generated from campaign data, so a change to one ad platform’s connector table can move revenue four steps away. A real shop’s sessions would come from web analytics. The path from a reported number to its sources is rarely the one people assume, and the metadata shows it in minutes.
Lineage tools, briefly
When table-level metadata is not enough, the options are a lineage feature of your warehouse or catalog, the lineage that transformation tools such as dbt build from their own models, or an open standard such as OpenLineage that pipelines report to. They add column level, cross-system paths and a graph to look at. Start from the metadata above; it tells you what you actually need from a tool.
How OWOX Data Marts keeps the path short
How OWOX Data Marts keeps the path short
In OWOX Data Marts each Data Mart is defined by SQL, a table, a view or a connector in your warehouse, so the first step of every trace is written down: open the Data Mart and read what it selects from. Relationships between Data Marts, shown on the Models canvas, form the model, so the joins a report uses are declared once rather than improvised per report.
Each Data Mart’s Data Last Updated value resolves views and SQL through to their base tables and lists each one with its own time, as the documentation describes. When we queried the Unified Ad Spend Data Mart through the MCP server on 14 October, the response listed the seven ad platform tables behind it and when each was last written: the same base tables the job history showed, attached to the answer itself.
quality checks on Data Marts return the SQL that ran, so step 4 of a trace starts from a query someone can rerun rather than from a screenshot.
You can try OWOX Data Marts on your own warehouse.
Turn your data into decisions.
Governed data marts give you the clean foundation ML needs to actually work.
- No AI hallucinations
- Analyst-governed definitions
- Every number traces to SQL