
The anatomy of a perfect marketing analytics stack
Learn how to build a marketing analytics stack that actually works — from raw data to governed insights your whole team can trust and self-serve.


Drowning in dashboards, juggling disconnected tools, and still unsure if your metrics add up? You're not alone. For most marketing teams, the real problem isn't tool overload — it's the lack of a unified system.
A disconnected stack leads to confusion, delays, and lost opportunities. When your tools don't talk to each other, reporting becomes a patchwork of manual fixes and guesswork. What most teams miss is a governed layer that sits between the warehouse and the reports — a place where analysts define what the metrics mean, and business users can help themselves to the answers.
In this guide, we'll break down the key layers of a marketing analytics stack — from raw data collection to governed, self-service insights. You'll see why publishing a Data Mart library matters, how OWOX Data Marts brings it all together, and how to give marketers and analysts faster, clearer access to numbers they can actually trust.
What makes up the modern marketing data stack?
A marketing data stack is a connected system that consolidates data from all your marketing tools into a single platform. It combines sources such as CRM, social media, email, and web analytics — giving you a full picture of performance and eliminating the data silos that slow teams down.
It also automates data collection and reporting, reducing manual work. The result is faster, more accurate analysis and more time to focus on strategy rather than spreadsheets.
Why the stack alone isn't enough
Most teams believe adding more tools will fix their reporting issues. But without a solid foundation, even the best tools create more noise than insight.
Disconnected tools lead to conflicting metrics
When each team uses different tools and logic, the same metric means different things. "Leads" in one report could be form fills, while another only counts qualified contacts. Without shared definitions, teams build isolated dashboards — leading to confusion, inconsistent data, and endless debates over which numbers to trust.
Data lives in silos, so questions go unanswered
Adding more platforms doesn't help if the data stays disconnected. Without a unified structure, teams rely on manual exports, and every new question requires hours of digging. Reports don't align, decisions get delayed. Siloed data slows collaboration and creates gaps that no amount of tools can patch.
More tools, more problems
More tools often mean more dashboards, more manual exports, and more errors. Instead of simplifying analysis, teams waste time reconciling reports that don't match. Trust in data erodes, and insights become harder to act on. Without structure, every new tool adds complexity rather than solving it.
Building a system that works: layer-by-layer breakdown
A marketing analytics stack isn't just a collection of tools — it's a structured system that turns raw data into reliable, trusted insights. Here's how the five layers work together:
Layer 1: Key data sources that power reporting
Your stack starts with the data you already collect. This layer combines all your key marketing sources — and these inputs fuel every report and decision downstream.
Use GA4 to track website and app behavior
Google Analytics 4 helps you track what users do on your website or app. It captures events such as page views, clicks, and conversions, providing a detailed view of user behavior. This data helps marketers understand how people engage with digital touchpoints and where to optimize the experience.
Get lead and customer data from your CRM
Your CRM is where key lead and customer data lives — from contact info to deal stages. Connecting your CRM to your analytics stack lets you track sales progress, measure marketing impact on revenue, and analyze the customer journey from first touch to close.
Bring in CMS metadata to analyze content
Your CMS not only stores content but also important metadata such as page titles, categories, and publication dates. When added to your stack, this helps measure content performance, identify top-performing topics, and understand how users engage with different site sections.
Pull campaign metrics from ad platforms
Ad platforms like Google Ads and Meta Ads provide data on impressions, clicks, costs, and conversions. Bringing this into your stack lets you monitor campaign performance in one place, compare across channels, and optimize ad spend based on what's actually driving results.
Add sales plans and targets from spreadsheets
Spreadsheets often hold sales plans, revenue targets, and forecasts. Including this data helps you compare goals against actual outcomes. Combined with marketing performance data, it shows whether campaigns are supporting business objectives — making reporting more actionable and aligned.
Layer 2: Centralize your marketing data in Google BigQuery
Once your sources are identified, the next step is getting them all into one place. Google BigQuery is the most common choice for marketing teams — and the one we'll use throughout this guide — but OWOX Data Marts works natively with Snowflake, Databricks, Redshift, and Athena too. The principles are the same regardless of your warehouse.
A cloud data warehouse becomes the hub that brings your data together in one secure, scalable environment — the foundation everything else builds on.
BigQuery offers speed, scalability, and flexibility
Google BigQuery is built to handle large volumes of data with ease. It is serverless and fully managed, so you can run fast, complex queries without worrying about infrastructure. For marketing teams working with growing datasets, BigQuery offers the speed and flexibility to scale analytics with confidence.
BigQuery becomes the source of truth for analytics
When all your data is centralized in BigQuery, everyone works from the same version of the truth. No more comparing exports from different tools. Reports are consistent, metrics are aligned, and decisions are made on accurate data.
Bring your data sources into the warehouse with OWOX connectors
OWOX connectors pull data from advertising platforms, CRMs, and analytics tools directly into your warehouse. Think of it as hiring a Data Intern — it handles the integration work that makes up roughly 85% of the typical analyst job description, so your team can focus on analysis instead.

Unlike tools that copy your data into their own cloud, OWOX connectors land your data in your warehouse. You own it, you control it, and it survives API changes and vendor updates without losing historical data.
Layer 3: Building your Data Mart library with OWOX
Data in BigQuery is powerful but unstructured. Analysts still need to define what "session," "qualified lead," or "ROAS by channel" actually means — and make those definitions available to the whole team, not just the person who wrote the SQL. That's what a Data Mart library does.
What is a Data Mart?
A Data Mart is a controlled, analyst-defined analytics artifact — a named, governed dataset that the whole team can safely query, filter, and reuse. OWOX Data Marts supports five types
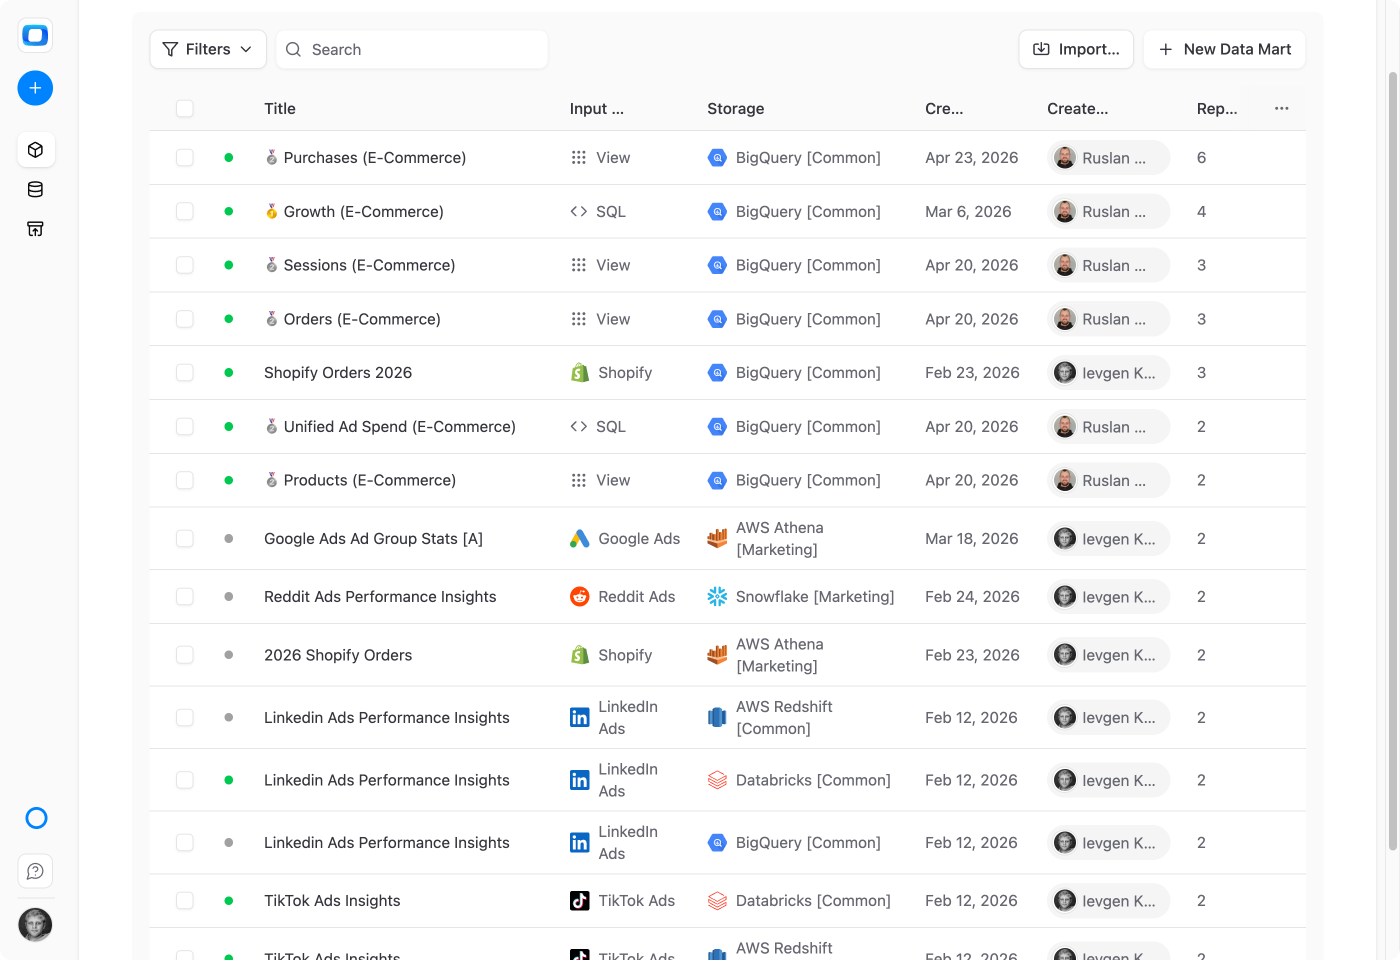
The analyst defines the logic once. OWOX governs it, tracks ownership, and publishes it to a shared library the whole organization can access.
Building the library in one click
Pick any tables or views from your data warehouse and publish them. OWOX auto-generates the metadata — description, aliases, field descriptions, primary keys, join keys, and technical and business owners — so the library is immediately useful, not just a list of table names.
The library grows incrementally. You don't need to model the entire warehouse upfront. Analysts add marts as they solve real business questions, and the library compounds in value over time.
What this looks like in practice
Here are three common Data Mart definitions marketing teams build:
Session mart: An analyst writes SQL that groups GA4 raw events into user sessions, applying your team's exact session definition. That SQL becomes a published, governed Data Mart — one version that everyone queries from Sheets, Looker Studio, or BigQuery directly.
Attribution mart: An analyst defines the attribution logic — first-touch, last-touch, or a custom data-driven model — as a SQL Data Mart. Once published, every channel report in every dashboard pulls from the same attribution logic. No more conflicting numbers from different tools.
Ad cost mart: Connector-type Data Marts pull spend data from Google Ads, Facebook Ads, LinkedIn Ads, and other platforms directly into BigQuery. The result is a single, reconciled cost table your team uses across all reports.
Layer 4: Governing metrics without a semantic layer
Data modeling sounds like a 6-month IT project. It doesn't have to be. With OWOX, metrics governance lives at the mart level — not in a separate, brittle semantic layer that requires a dedicated team to maintain and breaks every time the warehouse schema changes.
Join keys, aliases, and field descriptions per mart
Each Data Mart carries its own join keys, field aliases, and descriptions. This is what we call gentle semantization — just enough structure at the mart level for business users to join datasets and filter metrics without writing SQL themselves.
An analyst defines: "join session_mart to cost_mart on session_id." A marketer in the OWOX Sheets Extension just picks both marts, and the join happens automatically — no SQL required.
One Data Mart, many reports
Publish a Data Mart once and fan it out to as many reports and destinations as you need — Google Sheets, Looker Studio, Slack, Teams, or Email. Numbers reconcile everywhere because every report pulls from the same governed source. When the analyst updates the mart logic, every connected report picks up the change automatically.

No semantic layer required
Traditional semantic layers take months to build, require a dedicated team to maintain, and break when the warehouse schema changes. OWOX takes a different path: metrics live in analyst-owned SQL marts, not in a centralized abstraction layer that becomes its own maintenance burden.
The data team controls what the metrics mean. Business users control what questions they ask. Everyone gets consistent numbers — without the 6-month project.
Layer 5: Self-serve in Sheets, get AI briefings, and build dashboards
The Data Mart library is only valuable if the people who need it can actually use it — without pinging an analyst for every new slice of data. Layer 5 is how that happens.
OWOX Sheets Extension — browse, join, and refresh without SQL
Business users open the OWOX Sheets Extension inside Google Sheets, browse the Data Mart library, pick the columns they need, join marts using analyst-defined join keys, apply filters, and refresh. No SQL, no analyst ticket, no export.
When the analyst updates the mart logic, every connected Sheet picks up the new version on the next refresh. Dynamic queries, live connections to BigQuery, real-time data — all inside the spreadsheet your team already uses every day.
OWOX AI Insights — narrative reports with no hallucinations
AI Insights is the Senior Analyst you hire to narrate what's happening in the data. An analyst creates a Markdown template with value placeholders, and each placeholder is filled by deterministic, analyst-approved SQL — not by a freeform AI query of your warehouse.
The AI writes the prose narrative around the numbers. Every figure in the report comes from SQL the analyst approved — not from an AI making inferences. Insights are delivered to Slack, Teams, Email, or in-app on a schedule or trigger.
This is not "chat with your data" — it's an auditable, hallucination-free briefing system. The patented mechanism: every number is sourced from SQL with a full audit trail from mart definition to delivered insight.

Looker Studio dashboards powered by governed data marts
Clean, governed Data Mart data flows directly into Looker Studio for visual dashboards. No broken charts, no misaligned metrics — because the source data is already governed and consistent. You can also build charts within the Sheets interface for quick visual summaries in a few clicks.
Every layer of Layer 5 connects back to the same governed source: the Data Mart library. That's what makes the numbers consistent, whether a marketer is refreshing a Sheet or an executive is reading an AI briefing in Slack.
Why the OWOX-powered stack actually works
A modern analytics stack only delivers value when it runs end-to-end without friction. OWOX Data Marts doesn't just fill gaps — it powers the full flow from raw warehouse data to decision-ready insights. Here's how it changes daily work across roles.
Analysts stop being a reporting bottleneck
Analysts often spend too much time fixing broken reports, handling one-off SQL requests, and answering the same questions repeatedly. With a governed Data Mart library and self-serve Sheets access, business users get what they need without routing every question through the data team. Analysts shift time to higher-value analysis.
Marketers get trusted numbers without waiting
OWOX delivers consistent, analyst-approved metrics into the tools marketers already use. Data flows directly into Google Sheets, Looker Studio, or Slack — without needing analyst help. Since the logic is built into the mart, they know the numbers reflect the same definitions across all channels and reports.
Executives trust the numbers
With all reports pulling from the same governed Data Mart source, there's no more confusion from multiple versions of the truth. Leadership gets a single, aligned view of performance — one that accelerates decision-making and eliminates the "which dashboard should I trust?" problem.
Faster growth with always-available insights
Data that's always accessible means decisions happen faster. With OWOX, teams can pull insights from Sheets, Looker Studio dashboards, or AI Insights briefings whenever they need them. On-demand access keeps marketing, sales, and leadership in sync — removing the delays between questions and answers.
OWOX Data Marts: building a system, not just a stack
Most teams focus on collecting tools. Real success comes from building a system that holds everything together — where the data model compounds in value as the library grows, and where insights survive changes to your tooling.
Tools change, but structure stays solid
Marketing tools evolve fast, but your reporting shouldn't fall apart when platforms switch. With governed Data Marts, your metric definitions stay consistent even if your CRM, ad platform, or analytics tool changes. The logic lives in analyst-owned SQL, not inside any vendor's product.
Scale smarter with a mart-first foundation
As your business grows, so does your data. OWOX is designed to scale with you. Its mart-first approach means your reporting logic stays solid even as you add more channels, tools, or teams. You add marts incrementally — one business question at a time — rather than rebuilding your analytics stack from scratch every time something expands.
Designed for marketing, flexible for product and sales analytics
While OWOX Data Marts is built with marketing in mind, the same governed library works equally well for product and sales analytics. Teams across departments access the same clean, structured Data Mart library and use it to answer their own questions — improving collaboration and ensuring everyone works from the same trusted numbers.
Turn GA4, ads, and CRM data into governed insights with OWOX Data Marts
OWOX Data Marts connects your GA4, ad platform, and CRM data in one governed system. Analysts define the metrics once; business users self-serve the answers — all without moving data out of your warehouse or building a semantic layer.
Whether you're tracking campaign ROI, analyzing lead quality, or reconciling ad spend across channels, OWOX gives your team consistent, always-available access to insights they can trust. The reporting backlog shrinks. Debates about which number to believe end. And marketers can finally answer their own questions.
Frequently asked questions


Finally, a tool that doesn't ask business users to learn a new dashboarding UI. Our marketing team already knows Sheets. OWOX just delivers the right data.
Joinable data marts concept was the thing that sold us. We can now use the semantic layer without building one.
Self-hosted the OSS version on Digital Ocean. Zero vendor lock-in. Contributed a Shopify connector back in week two.