
Why You Should Store Your BigQuery SQL for Looker Studio in OWOX Data Marts
Ditch messy SQL in dashboards. Store, version, and reuse SQL with OWOX Data Marts to simplify reporting and scale your analytics stack.

Most analysts have faced the frustration of broken Looker Studio dashboards. A single schema change, a renamed column, or duplicated SQL can spread errors across multiple reports. Instead of focusing on insights, analysts end up spending hours fixing scattered queries hidden inside charts.
This article explains why storing SQL inside Looker Studio leads to chaos, how OWOX Data Marts centralizes and governs reporting logic, and what the OWOX Looker Studio connector adds to make dashboards reliable, scalable, and secure.
What’s the Real Problem Behind SQL Chaos in Looker Studio?
Looker Studio dashboards often break because the SQL logic lives inside charts, not in a governed layer. This section explains the core issues, like conflicting metrics, weak access control, schema failures, and missing documentation, that make reporting fragile and inconsistent.
Looker Studio Isn’t Built to Model or Manage Logic

Looker Studio is great at creating charts and dashboards, but it isn’t designed to handle reporting logic. The tool lacks features to define, document, or reuse metrics in a structured way. As a result, analysts often copy the same queries into different reports.
This duplication not only wastes time but also makes dashboards fragile. When business rules or data structures change, every chart has to be updated manually, creating more work and risk of errors.
Conflicting Metric Definitions Spread Fast
When there’s no centralized model, every team creates its own version of key metrics. Marketing might calculate revenue one way, while finance uses another. These mismatched definitions quickly spread across dashboards, causing misaligned KPIs. Instead of trusting the numbers, teams waste time debating which report is correct, slowing down decision-making and reducing confidence.
No Access Control at the Metric Level

Dashboards in Looker Studio allow anyone with editing rights to adjust SQL or formulas. While this seems flexible, it often leads to hidden changes and silent mistakes. Without clear access rules at the metric level, governance becomes impossible. A single untracked tweak can ripple through reports, creating inconsistencies and undermining the credibility of insights.
Schema Changes Cause Silent Failures
Source tables and field structures in data warehouses often change as businesses evolve. A renamed column, deleted field, or altered data type may seem minor, but it can silently break connected dashboards. Looker Studio provides no alerts, logs, or visibility into these failures. Analysts are often left to troubleshoot manually under pressure. This reactive cycle not only delays reporting but also increases the chances of delivering inaccurate or outdated insights to decision-makers.
Nothing Is Reusable or Documented
Each chart in Looker Studio has its own separate SQL or logic. There’s no common place to define, document, or reuse business rules across dashboards. This makes it hard to scale reports or bring new team members up to speed. Analysts often redo the same work in different places, which causes mistakes. As a result, business users start to doubt the data and lose trust in the reports they use every day.
Why Should You Centralize SQL Logic in OWOX Data Marts?
Managing SQL across multiple dashboards is messy and time-consuming. OWOX Data Marts solve this by giving you one place to define and manage reporting logic. This section covers how centralized marts help standardize queries and bring full control to analysts.
Define Reports Once Using Flexible Data Marts
With OWOX, you can turn any reporting query into a reusable Data Mart. Whether it’s a raw SQL statement, a modeled view, or a table pattern, all logic is defined in one place.
This keeps your reports consistent, reduces rework, and helps teams use the same trusted definitions across all dashboards and tools. It also means less duplication and fewer errors when building or maintaining reports for different teams and data destinations.
Standardize Schema with Full Field Governance
Each Data Mart gives analysts full control over the schema. You can name fields clearly, choose data types, and add helpful descriptions that make sense to business users. This makes dashboards easier to read, understand, and trust. It also prevents confusion caused by unclear or duplicated fields.
With schema governance, teams can align better and avoid miscommunication around what each number or metric actually means in different reports.
Deliver Consistent Logic Everywhere You Report
Once a Data Mart is set up in OWOX, it can be used in Looker Studio, Google Sheets, or APIs. You don’t need to rewrite queries for each tool. By defining logic in one place, you keep metrics consistent, avoid duplication, and reduce the risk of errors across platforms. Everyone works with the same definitions, whether it’s an analyst, marketer, or executive, ensuring alignment and faster decision-making from trusted data.
What Makes the OWOX Looker Studio Connector Different?
The OWOX Connector fixes the limits of native BigQuery connections. This section explains how it brings better security, clean schema, and easier reporting across tools.
Connect Dashboards Without Sharing Full DB Credentials
With OWOX, you don’t need to give full database access just to connect Looker Studio. Instead, use a secure secret key tied to each Data Mart. This keeps sensitive data safe, makes onboarding easier, and follows least-access principles. It’s a simple way to connect dashboards without risking your warehouse or needing admin-level permissions everywhere.
Automatically Get Clean, Defined Schema in Dashboards
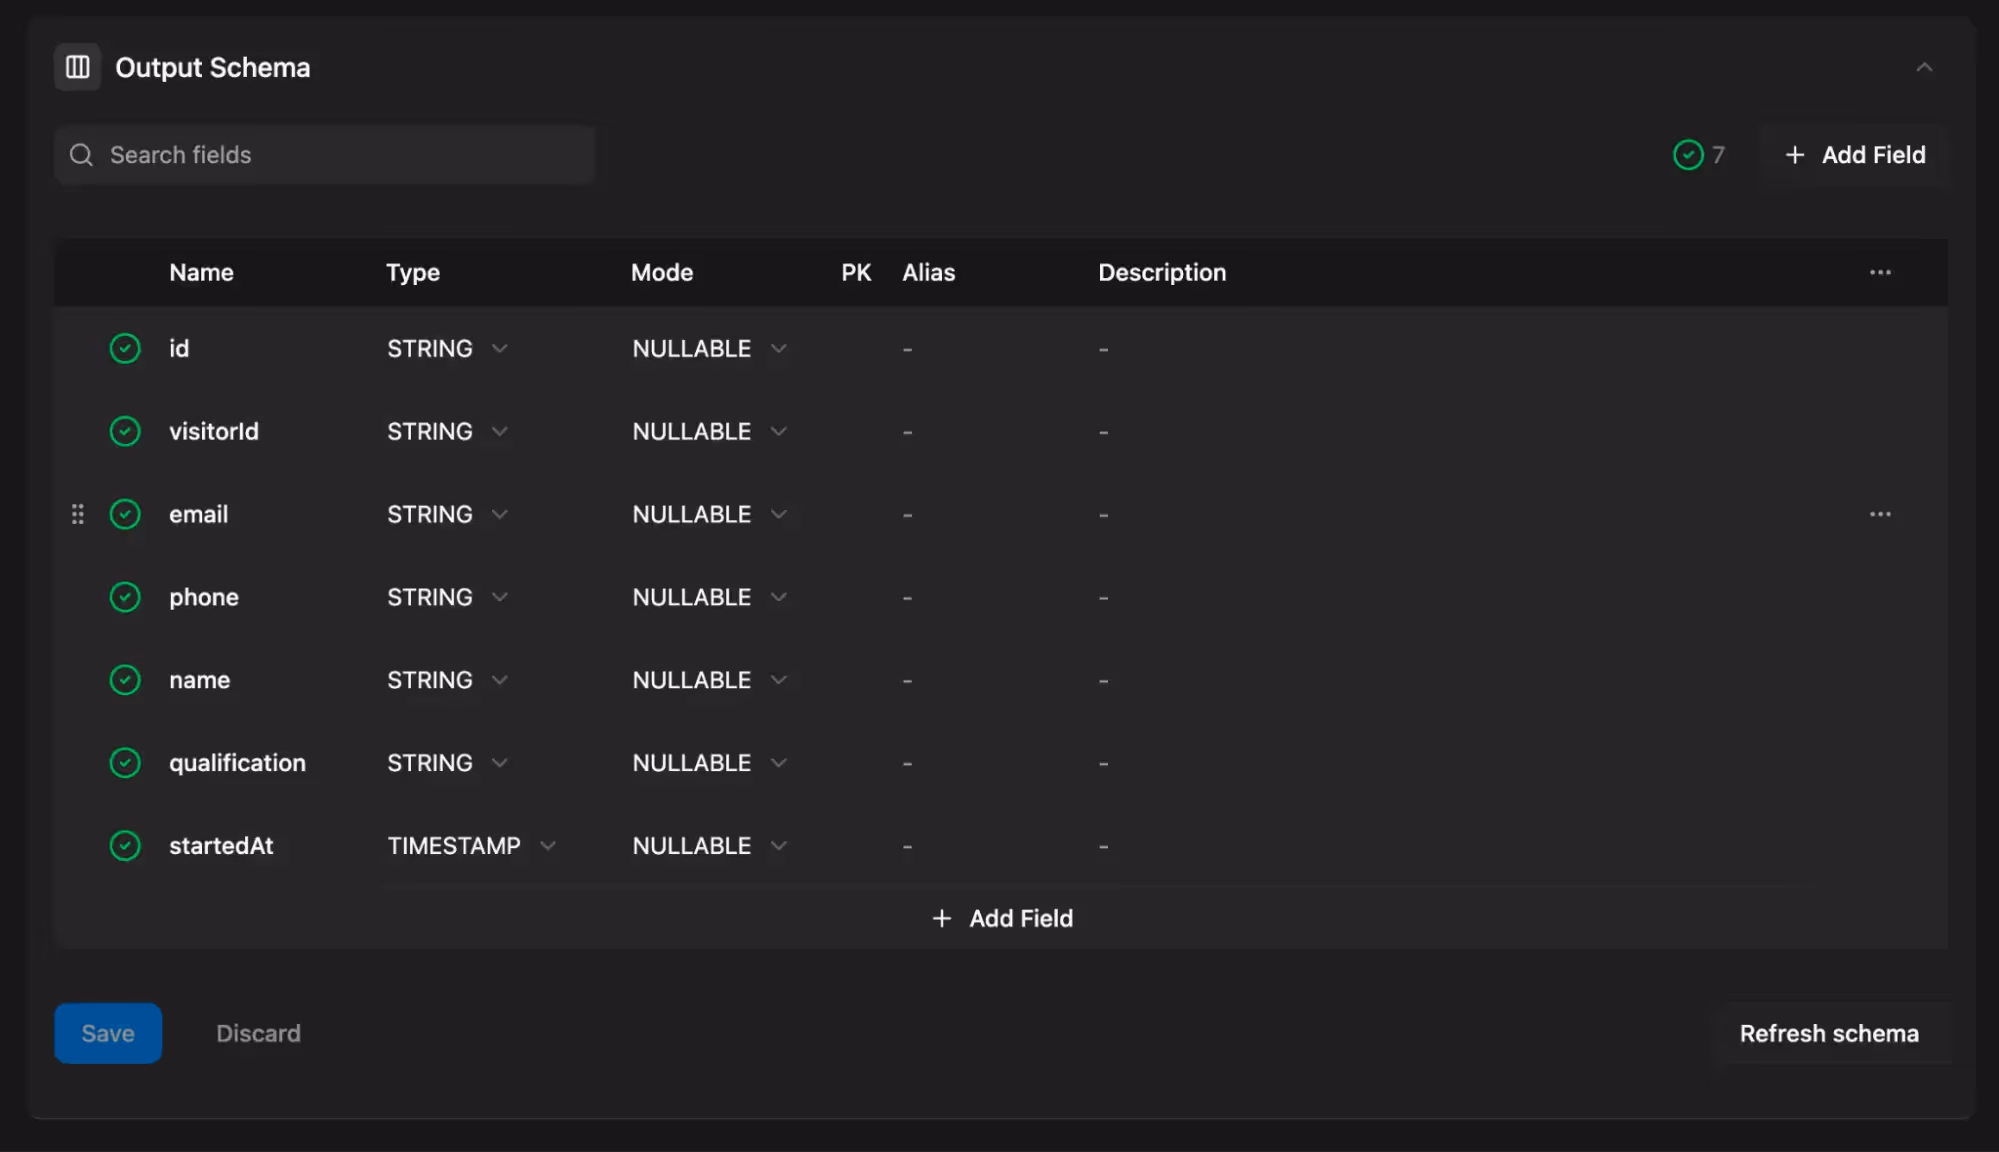
The OWOX connector sends fully defined schema straight into Looker Studio. This means field names, data types, and helpful descriptions show up clearly, no more guesswork. Analysts don’t need to manually clean up fields. Business users see well-labeled data, which makes reports easier to understand and reduce mistakes caused by unclear or missing definitions.
Skip Raw Table Access and Reduce Query Costs
Instead of linking dashboards to heavy raw tables, OWOX lets you connect only to the final modeled Data Marts. This keeps queries faster, lighter, and cheaper. You avoid hitting large datasets unnecessarily, which helps manage costs in BigQuery. It also gives more control over what data is exposed—and what stays behind the scenes.
Gain Caching, Monitoring, and Governance Features
OWOX makes reporting more reliable with features like query monitoring, scheduling, and custom caching (coming soon). You’ll be able to see when Looker Studio last pulled data and control how often it updates. These tools help optimize performance, reduce API calls, and give your team more visibility into how dashboards are being used.
How OWOX Keeps Every Report Updated with One Change
Changing logic in one place should update every report. This section explains how OWOX ensures consistency by syncing updates across all dashboards connected to the same Data Mart.
Update Once, Apply Everywhere
When you make a change to a field or formula in an OWOX Data Mart, that update automatically reflects in every connected Looker Studio dashboard. There’s no need to open reports one by one or track down repeated SQL. This saves hours of manual work, avoids inconsistent metrics, and keeps your reporting clean and aligned, whether teams view the data in Looker Studio, Google Sheets, or other connected tools.
Eliminate Manual Edits in Dashboards
OWOX helps analysts avoid editing logic inside Looker Studio dashboards by moving all calculations into the Data Mart. When dashboards pull from these centralized marts, you don’t have to worry about hidden changes or broken filters. Analysts can focus on improving insights instead of wasting time fixing chart errors. It’s a cleaner, more reliable way to manage reporting, especially across teams or client-facing dashboards.
Build Dashboards Faster and With Confidence
When all reporting logic is centralized in OWOX, dashboard creation becomes quicker and more reliable. Analysts no longer copy-paste SQL into each chart or recreate the same metric over and over. Instead, they connect to a well-defined Data Mart that delivers consistent logic. This speeds up the process, reduces errors, and builds trust in your data, so dashboards are ready faster and work correctly from the start.
OWOX Connector vs. Native BigQuery Connector: A Feature-by-Feature Comparison
While Looker Studio’s default BigQuery connector gives you quick access to raw data, it lacks the control and flexibility needed for governed reporting. Analysts are left managing logic inside dashboards, facing issues like duplicated SQL, schema drift, and security concerns.
The OWOX Connector changes this by delivering a centralized, secure, and reusable data layer built on Data Marts. Here’s how they compare:
The difference is clear: BigQuery’s native connector is just a pipe, while OWOX provides a governed semantic layer that ensures clean, reusable reporting logic across your dashboards.
How to Set Up the OWOX Looker Studio Connector in Minutes
Connecting Looker Studio to a centralized, governed data layer is easier than you think. Below are the quick steps to go from scattered SQL to clean, trusted dashboards using the OWOX Looker Studio Connector.
Step 1: Create a New Data Mart
Start by creating a Data Mart in OWOX. You can build it using a custom SQL query, connect to an existing BigQuery table, or even link to a view from your data warehouse.
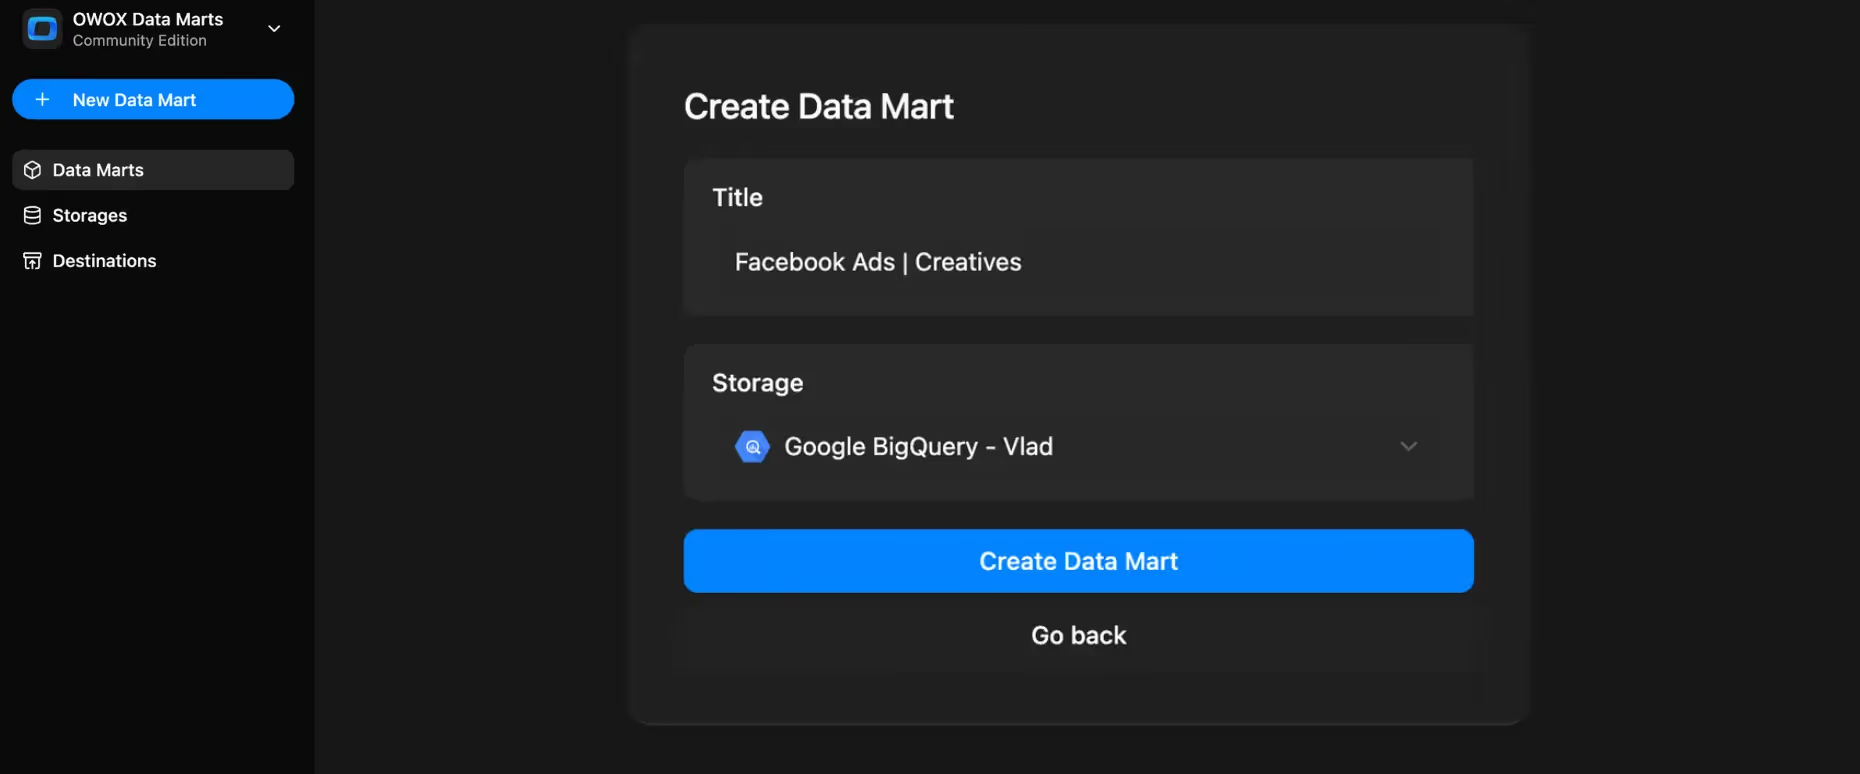
For more flexibility, you can also set up a Data Mart by connecting to a third-party platform like a CRM or ad tool. This is where all your reporting logic will live, organized, versioned, and ready to reuse across tools.
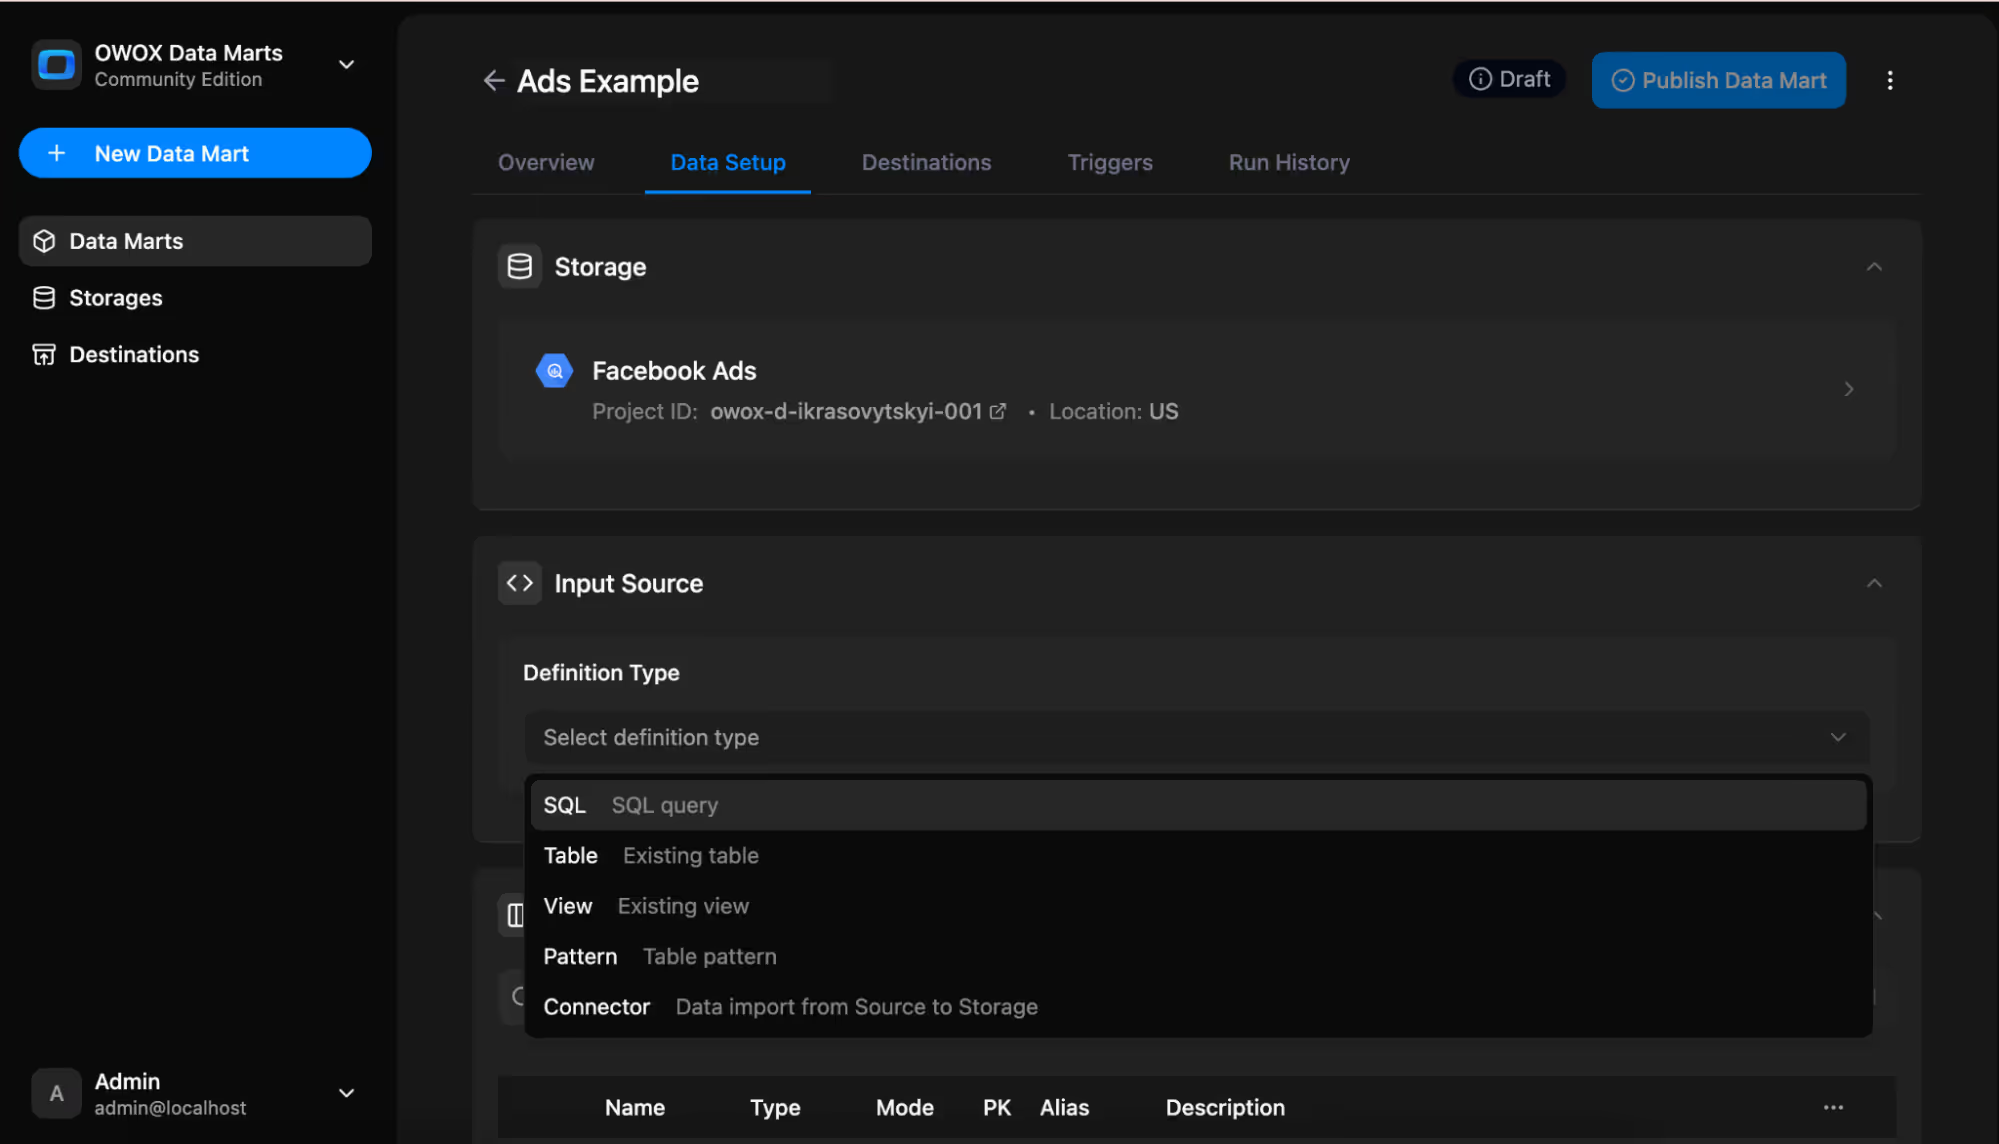
Step 2: Define Using SQL, Tables, Views, or Connectors
Once your Data Mart is created, define the data it should include. You can write a SQL query, link to a warehouse table, use a view, or connect to external tools like CRMs, ad platforms, or analytics services.
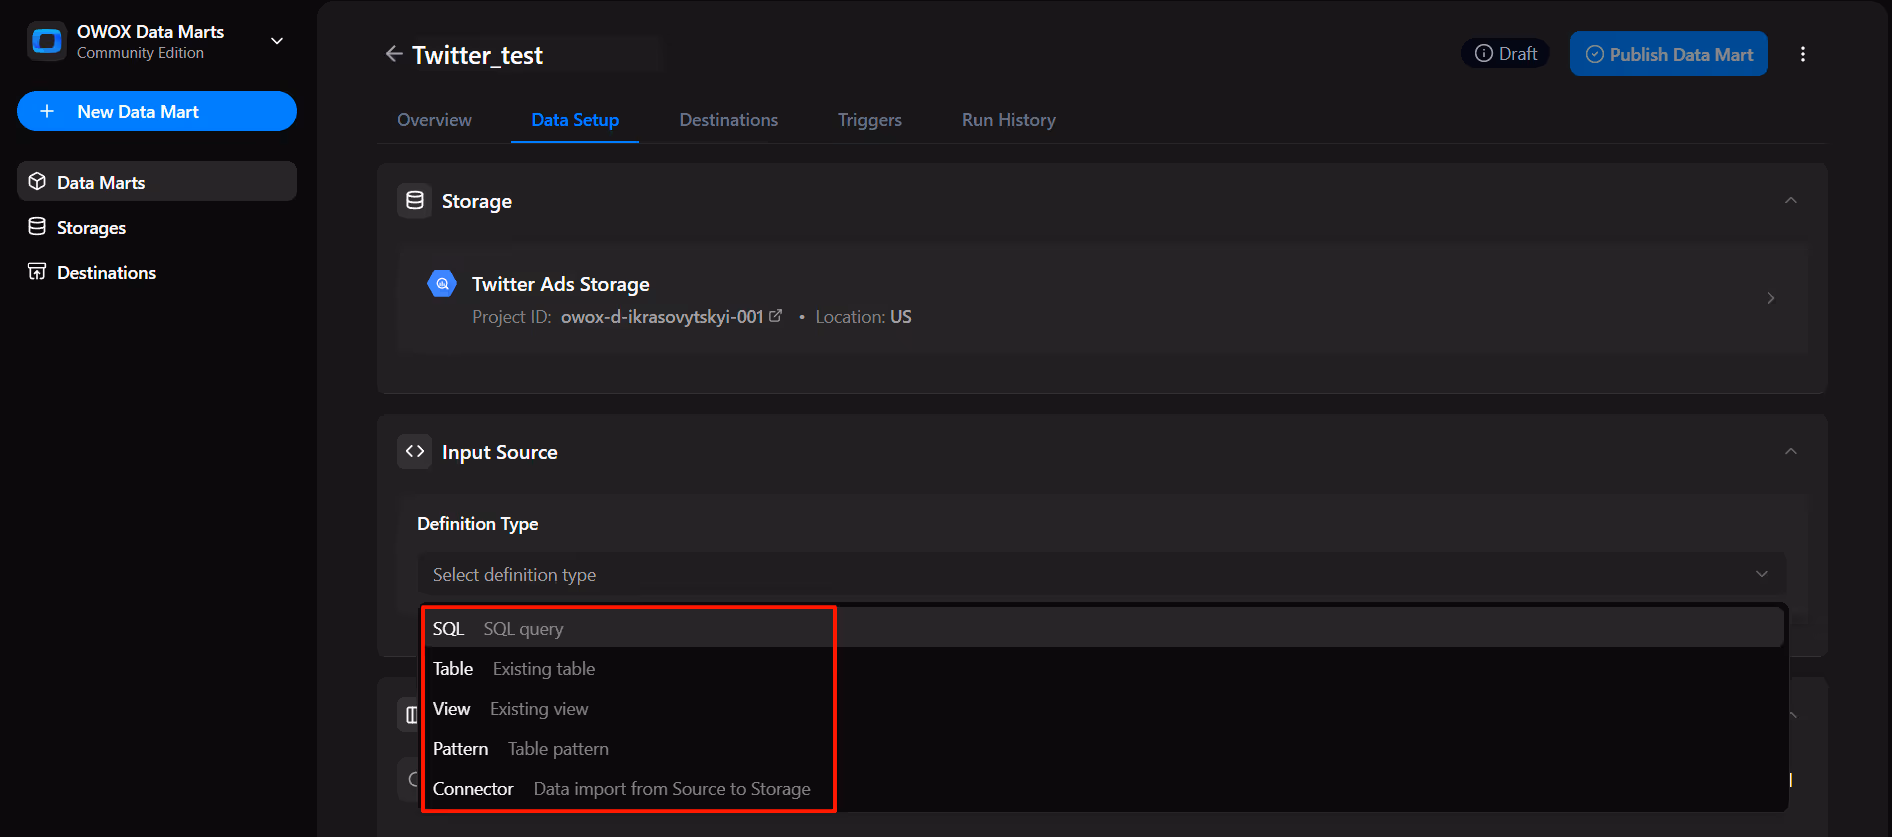
This flexibility allows you to select the most suitable source for your needs. Defining the logic here means your metrics are clean, consistent, and ready to reuse across dashboards, Sheets, and APIs, without writing the same SQL over and over again.
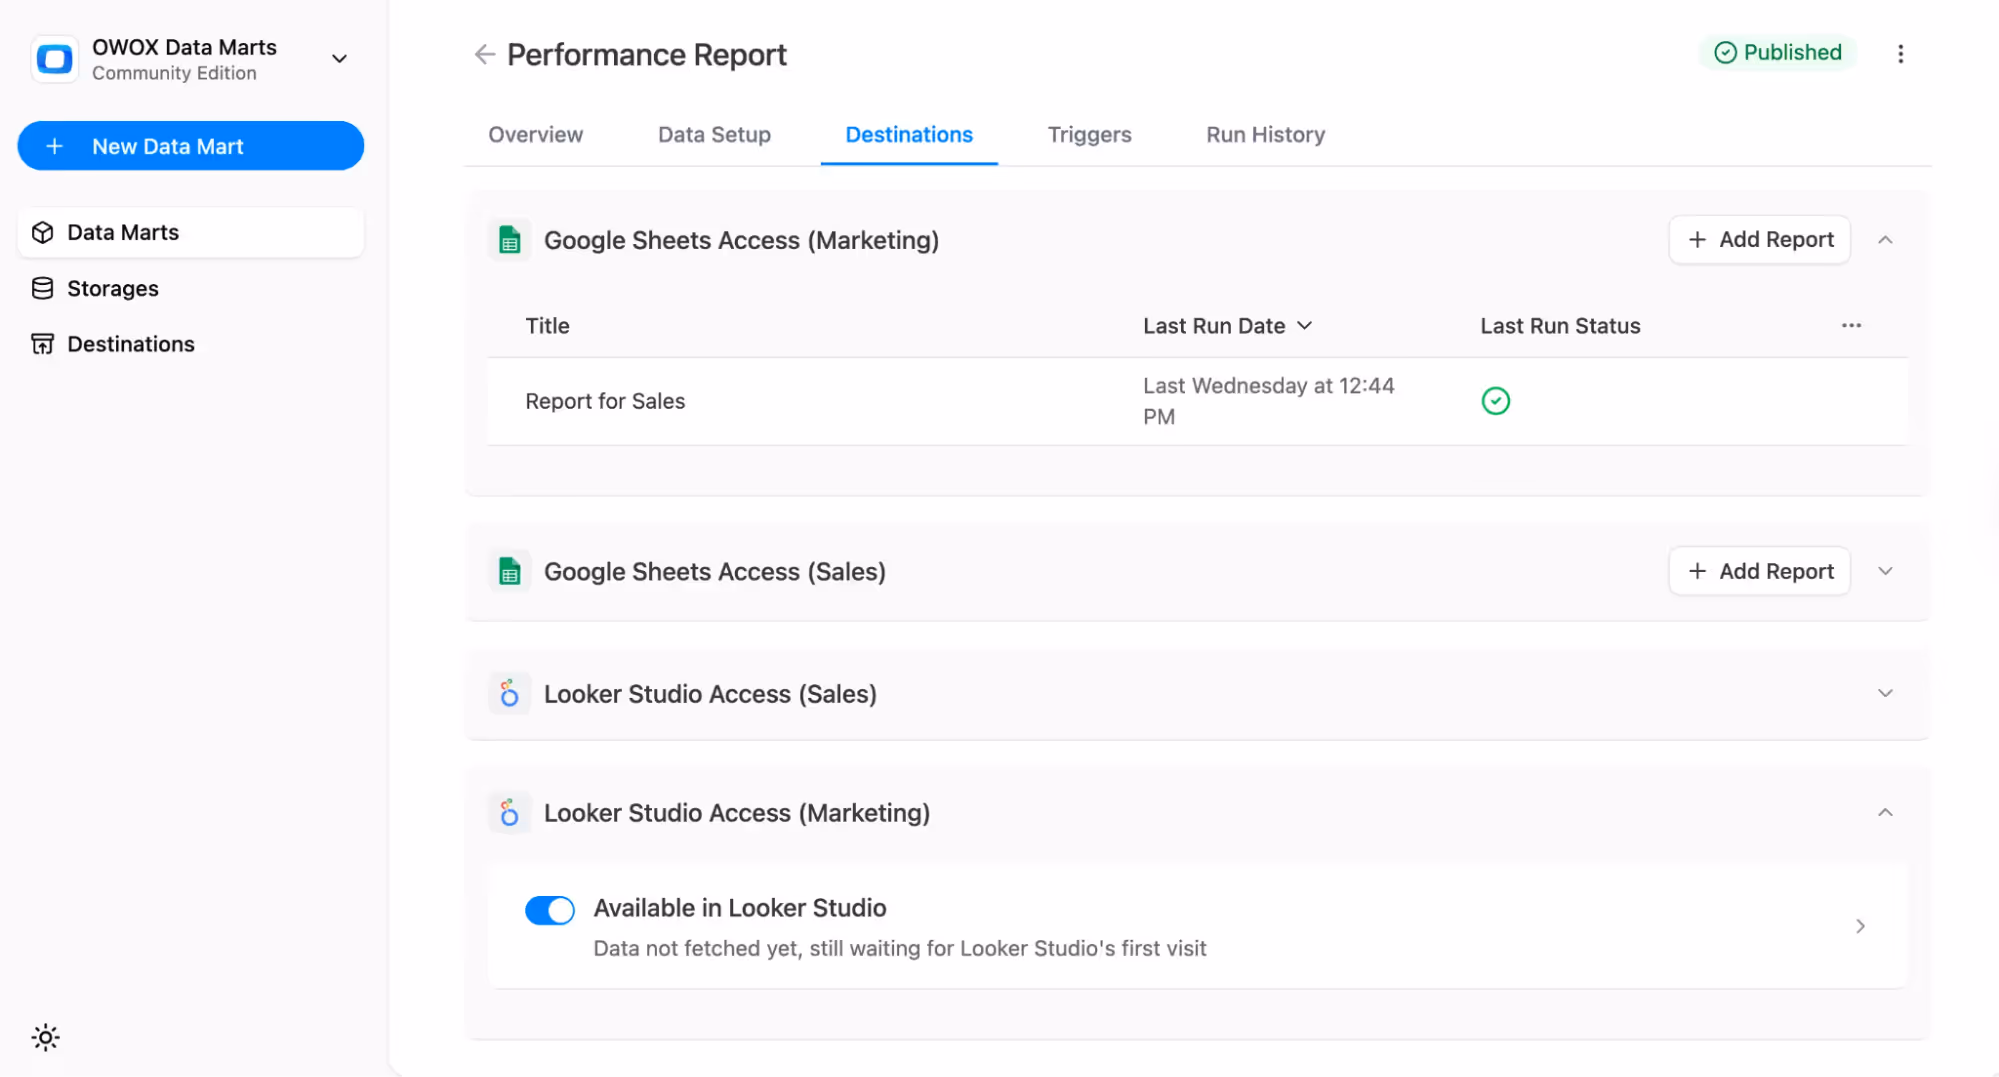
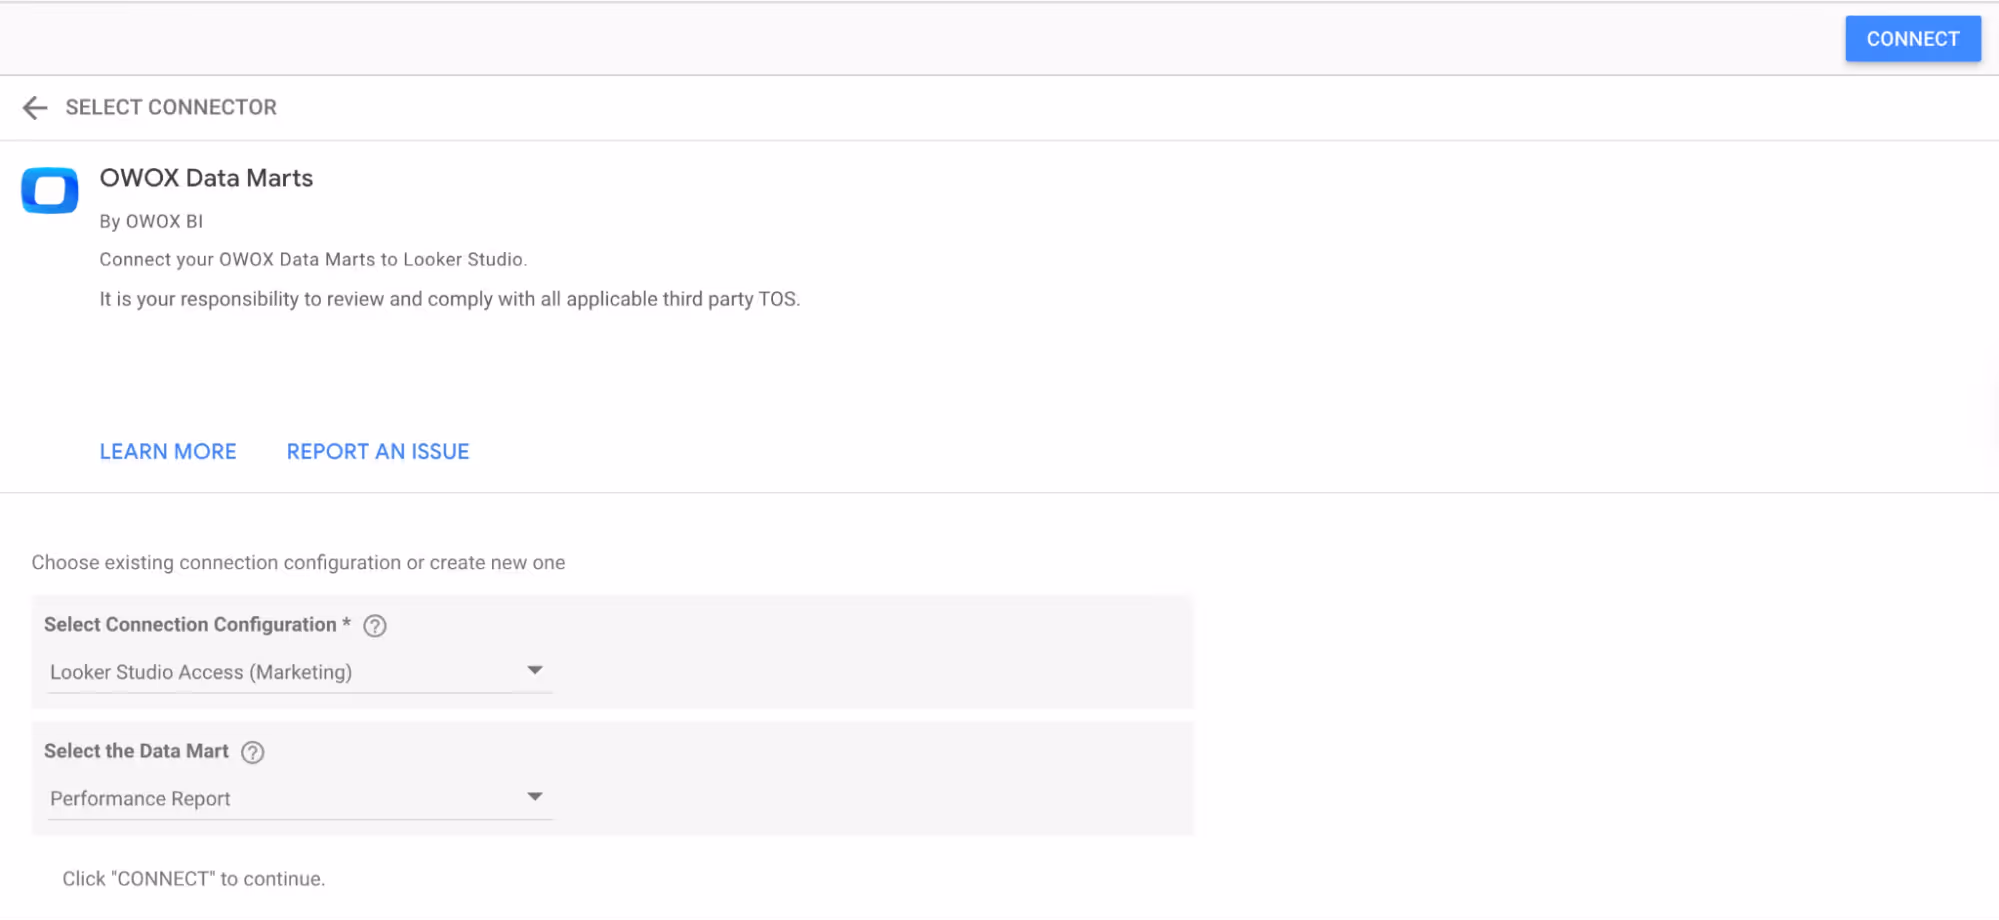
Step 3: Enable Looker Studio as a Destination
After defining your Data Mart, the next step is to add Looker Studio as a destination. This allows the OWOX connector to send structured, governed data directly into your dashboard. You no longer have to expose raw warehouse tables or rely on unstable queries.
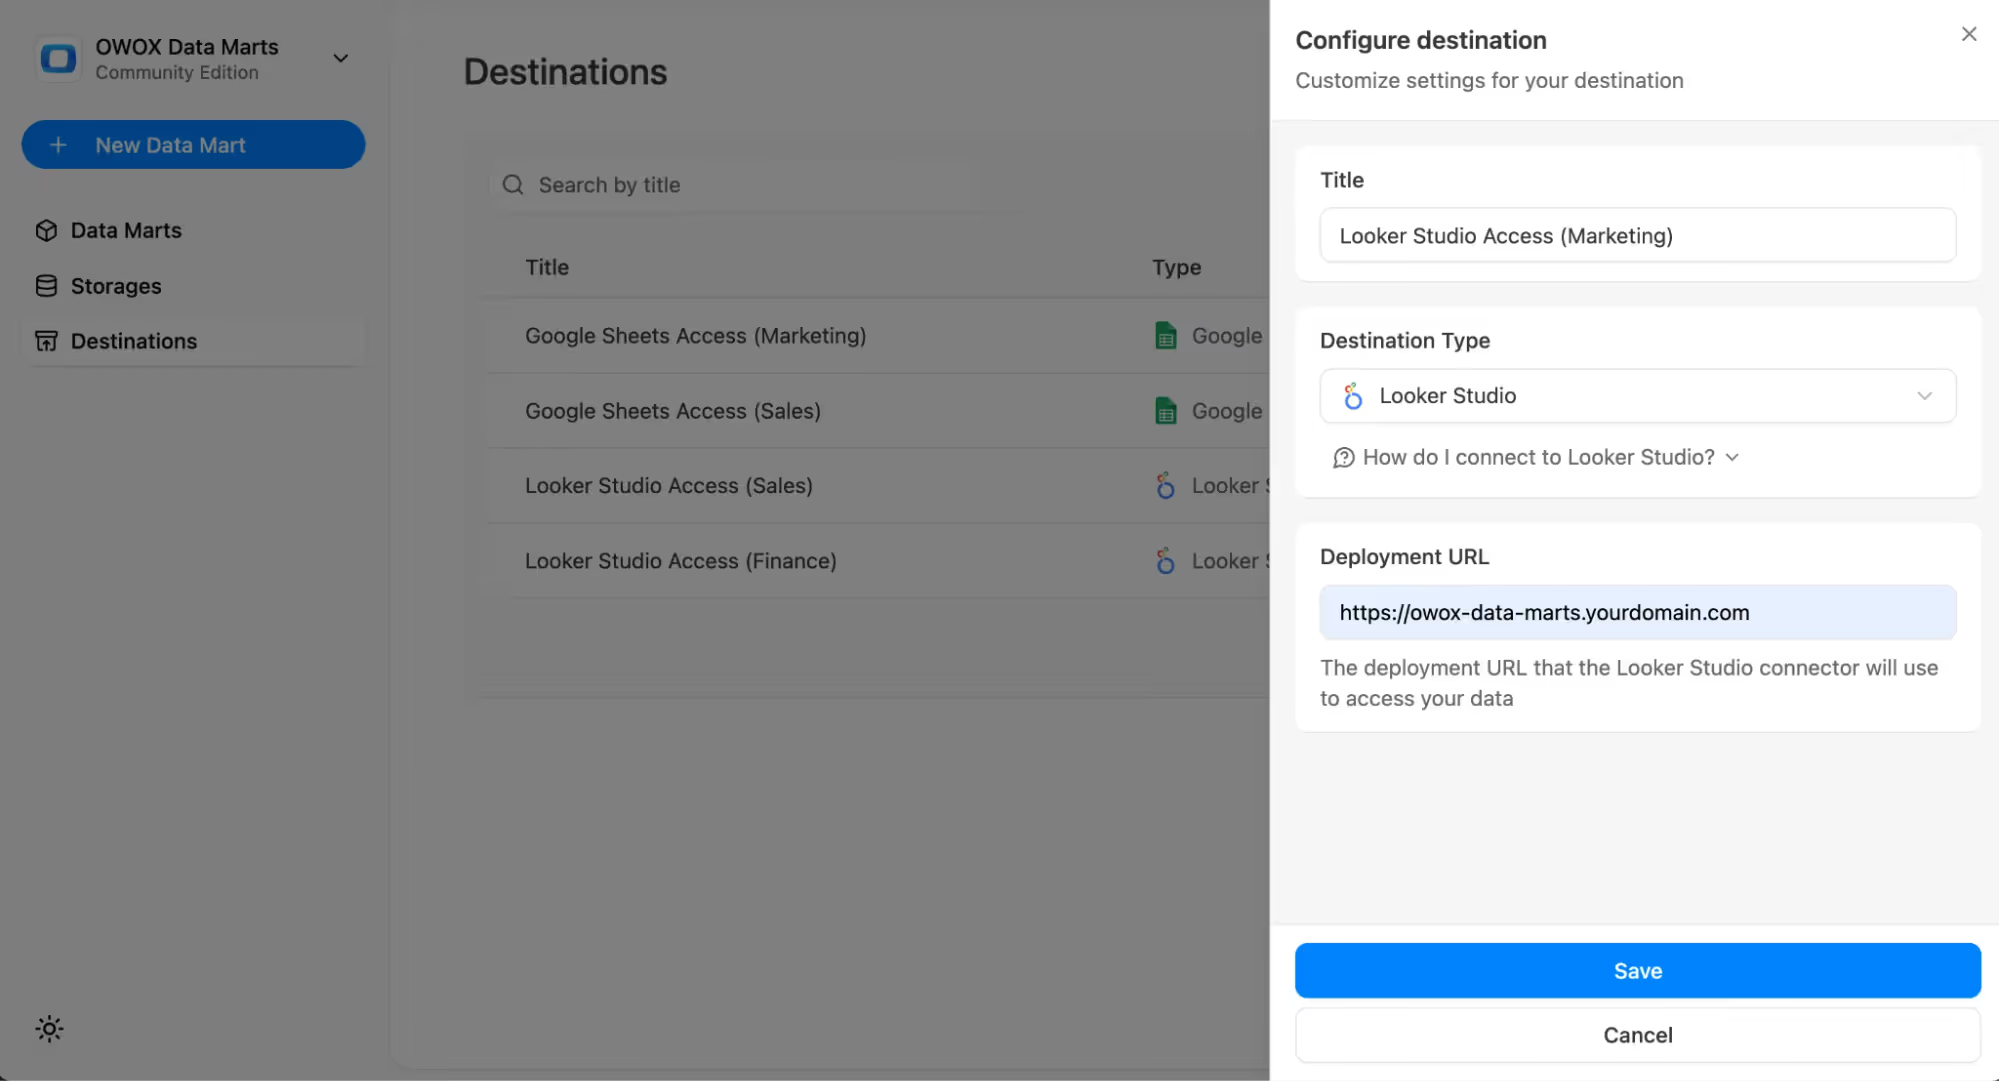
The data arrives with clean field names, types, and descriptions, ready to use. Every dashboard built on this Mart reflects approved logic, giving teams consistent, trusted results without manual fixes or duplicated SQL inside the report.
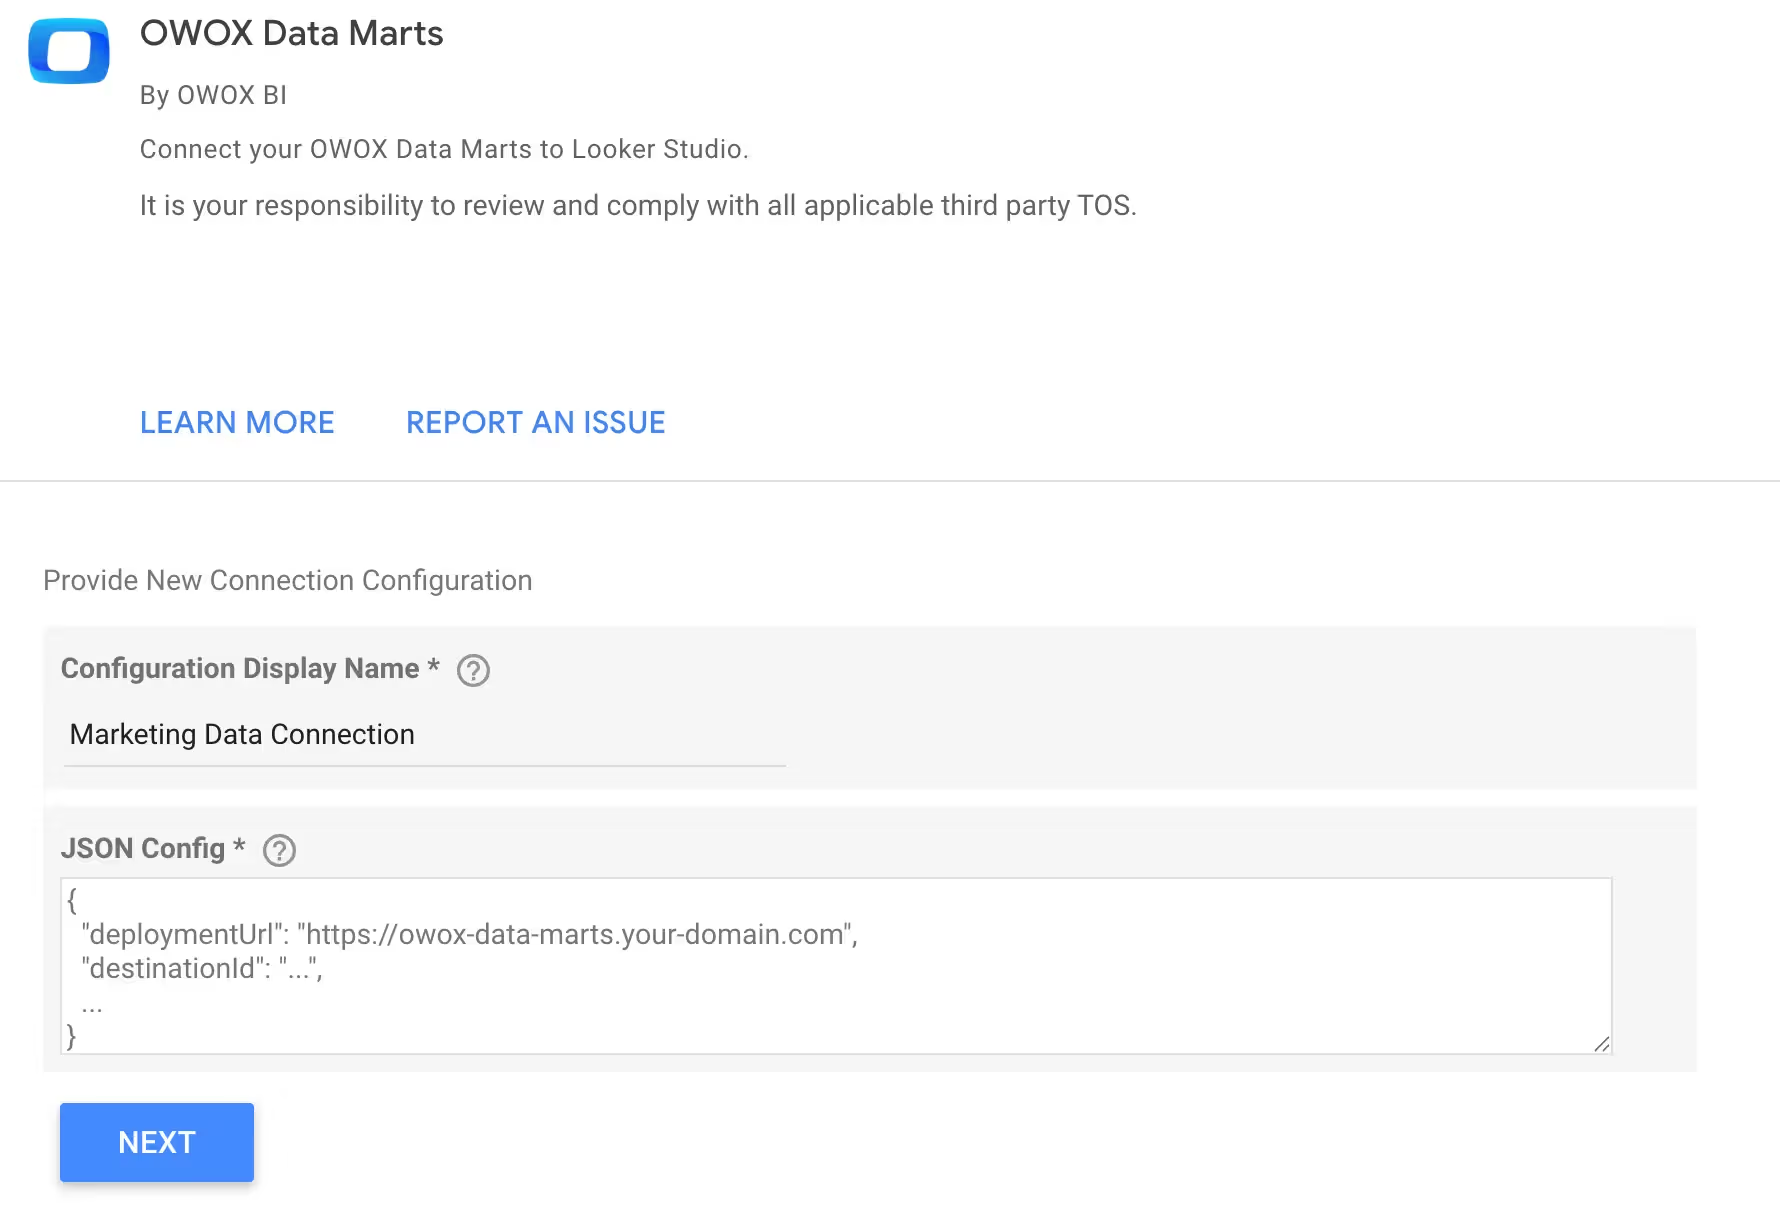
Step 4: Share Scoped Access with Dashboard Owners
To securely connect dashboards, generate a secret key linked to the specific Data Mart and share it with the dashboard owners. This gives them access only to the data they need, without exposing full database credentials.
You can manage access levels for each Mart individually, ensuring the right teams see the right data. This scoped access reduces risk, supports data governance, and makes collaboration safer. It’s a simple step that fits neatly into your team’s existing workflow and reporting process.
Your dashboard is now powered by a centralized, governed logic layer. You’ve removed duplicated SQL, tightened access controls, and created a setup that scales easily as your data grows. With OWOX Data Marts behind your dashboards, reporting becomes cleaner, faster, and more reliable, freeing analysts to focus on insights instead of fixing broken queries.
Let Looker Studio Focus on What It’s Meant For – Visualizing, Not Modeling
Looker Studio works best as a tool for creating clear, visual dashboards, not for managing complex logic. When SQL is written separately in each report, mistakes multiply and teams start to lose trust in the numbers. With OWOX Data Marts, you manage all your business logic in one place, then connect it to Looker Studio.
Here’s how centralizing your logic improves your reporting flow:
- Let Looker Studio focus on showing insights, not handling calculations.
- Avoid SQL sprawl across dashboards.
- Define metrics once in OWOX and reuse them everywhere with confidence.
Try the OWOX Looker Studio Connector and Simplify Your Dashboards
Stop fixing broken dashboards and start building reliable ones. With the OWOX Looker Studio Connector, you can manage all your reporting logic in one place and connect it securely to dashboards without exposing raw tables. No more duplicated SQL or silent errors. Just clean, consistent data across every report.
If you're ready to simplify your workflow and gain full control over your reporting, try the OWOX Looker Studio Connector today and see the difference for yourself.
Connect your dashboards with confidence. Try the OWOX Looker Studio Connector now.
Frequently asked questions

.png)


Finally, a tool that doesn't ask business users to learn a new dashboarding UI. Our marketing team already knows Sheets. OWOX just delivers the right data.
Joinable data marts concept was the thing that sold us. We can now use the semantic layer without building one.
Self-hosted the OSS version on Digital Ocean. Zero vendor lock-in. Contributed a Shopify connector back in week two.