Why Your Stripe Sales and Your Bank Deposits Never Match
Stripe's dashboard says a record week, the bank app says almost nothing arrived, and the revenue report has a third number. None of them is lying: a sale is one event with three amounts and three dates, and each system shows you one. This article puts Stripe's tables inside the business data model, next to orders, customers, ad spend and subscriptions, and reads one account through it: $227,495 charged over thirteen months, $209,278 of it that reached the balance after fees, refunds and disputes, 140 of 146 payouts that match the bank to the cent, and the six that do not, each with its reason.
Open the Stripe dashboard and it says a record week. Open the bank app and almost nothing has arrived. Ask whoever does the books for last month’s revenue and you get a third number. One question, “how much did we make”, three answers, and nobody in the room can say which one is real.
None of them is lying. A sale is one event with three amounts and three dates, and each system shows you one of them. Once Stripe’s own tables sit in your data warehouse beside the orders, the customers, the ad spend and the subscriptions, the three numbers are three columns of one table, and whether they tie is a check that runs every morning. Here are the three numbers, and what one account’s tables showed when we ran that check.
Three amounts, three dates
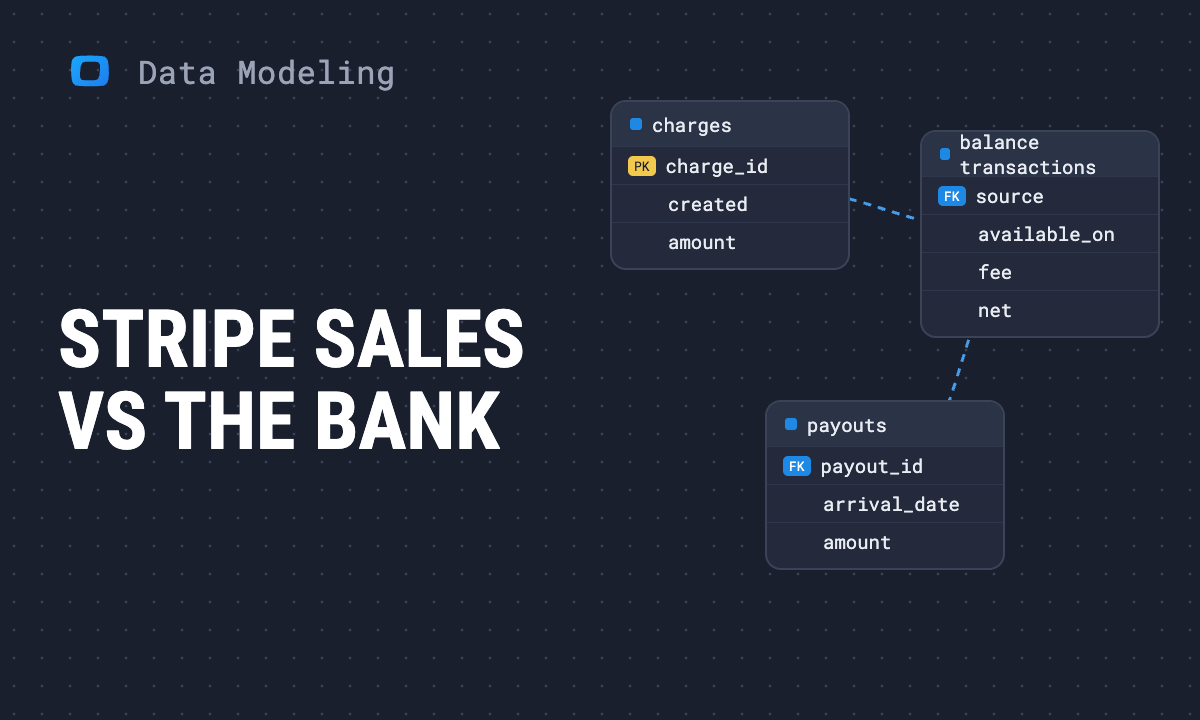
Every card payment moves through Stripe in three steps, and Stripe records each step with its own amount and its own date.
| The question | The amount | The date | Where you see it |
|---|---|---|---|
| What did we sell? | What the customer paid, gross | The day of the sale | The Stripe dashboard’s gross volume |
| What did we actually get? | The same payment after Stripe’s fee, minus refunds and disputes | The day the money became available to pay out | Stripe’s balance |
| What reached the bank? | The payout | The day it landed in the account | Your bank statement |
In the account below, a $29.00 card charge made on 5 October carried a fee of $1.14, became available on 7 October and left in the payout of 7 October. One sale, three amounts, three dates, whatever your payout schedule. The median payment in this account reached the bank three days after the sale; nine in ten took four days or fewer, and none took more than five. That is the whole of the timing argument: at a month-end the last days’ sales are always on one side of the line. Fees, refunds and chargebacks are the rest of the gap, rows attached to the sale they belong to, not a percentage you can apply to the dashboard figure.
Stripe in the picture
The fix is not a better export from Stripe. It is to treat Stripe’s tables as part of the business data model that already holds the storefront and the ad platforms. Below is the model with Stripe beside it: blue and green are the storefront and the ad platforms, orange arrives from Stripe through the Stripe data source. For a subscription business the same orange tables sit in the model instead.
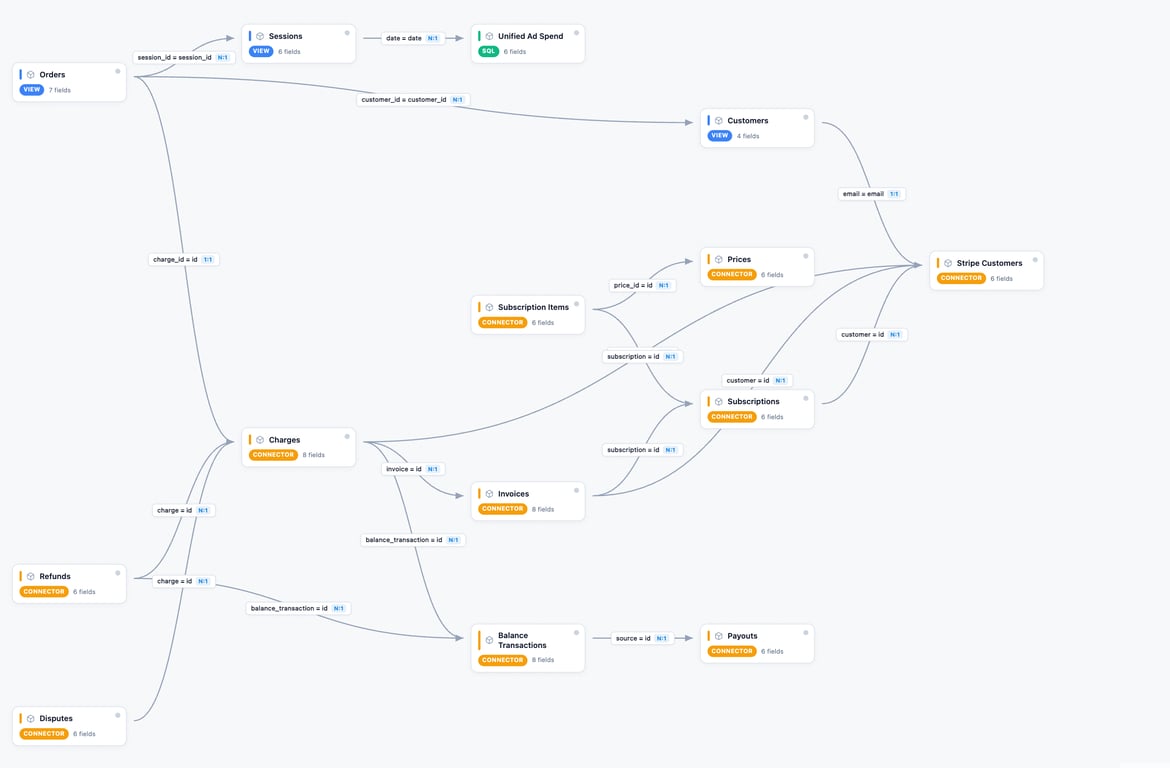
Three things to see in it. An order carries the charge that paid it, and the store’s customer email meets the Stripe customer’s email, so a fee or a refund lands on the order, the customer and the campaign that brought them. The three amounts are three of the orange tables: charges are what was sold, balance transactions are Stripe’s ledger with every fee and every refund in it, payouts are what reached the bank. The recurring side is there too: invoices, subscriptions and the plan behind each line, so monthly recurring revenue is a sum from the same tables, with no screenshot in between.
Nothing in the picture is a report Stripe produced for you. It is the tables themselves, loaded every day into a data warehouse you own.
OWOX Data Marts
See your first report built in real time. 15 minutes.
- Connect your data warehouse
- Pick your metrics
- Get a live Google Sheets report
In the time it takes to write a ticket. Then imagine never writing that ticket again.
Book a DemoWe'll use your actual use case
What one account’s tables showed
What one account’s tables showed
We loaded one Stripe account into its data warehouse with OWOX Data Marts and read thirteen months through this model, October 2025 to 6 November 2026. It is a small account, which makes every figure easy to check.
Customers were charged $227,495. Of that, $209,278 reached the Stripe balance: 92 cents of every dollar sold. Stripe’s fees took $3,902 and $8 of software charges; fourteen refunds took $8,587; six chargebacks on 565 payments, about one in a hundred, took $5,720 including Stripe’s $15 charge for each. The account also earns small fees on payments it processes for partner accounts, $4,796 over the period, which brought the balance to $214,074. The arithmetic ties to the dollar, and each line is a table you can open.
Of 146 payouts, 140 matched the bank to the cent. We summed the movements inside each payout and set the sum against what the bank received. Six did not match. Four differed by between $1.59 and $96.93, each with a reason: a refund that became available on the morning of a payout and was carried against the next one, and three cases of money moved between two Stripe balances the day before. The other two are the first payouts in the history, which drew on money from before the tables begin. The analyst guide that accompanies this article carries the method and every gap.
In the first six days of November, customers were charged $106,232 and the bank had received $194. After $3,105 of fees, $8,490 of refunds and those same six chargebacks, $88,920 had reached the balance by the 6th, and nearly all of it was still inside Stripe, waiting for its payout. This is the week the dashboard calls a record and the bank app calls quiet, and both are right.
Recurring revenue, from the tables, was $7,258 a month from 45 subscriptions on 6 November, three of them set to cancel at the end of their period. MRR counts what renews, not what was collected, which is how it can rise in a month when cash falls. Seven invoices for $18,266 were issued and not yet paid, none past due. And of every four checkouts customers started, one never became a payment: 196 attempts stopped at a declined card or an abandoned form, against 565 that went through.
None of these is on Stripe’s home screen. All of them are one question away once the tables are in the model.
Monday, with one model
With the three amounts as three columns, the Monday question gets a short answer: which number for which purpose.
- For “did we do better or worse this month”: what reached the balance, by the day it became available. It is net of fees, refunds and disputes, and it is the one your books will be closest to.
- For cash: the payouts, by arrival date, next to the bank statement. If the two do not agree to the cent, the row that is wrong is named, and that row is what you ask about.
- For marketing: sales by the day they happened, next to the ad spend of the same day. It is the only one of the three the ad platforms can be judged against, and it is the one the dashboard already shows.
The Stripe payments dashboard is that page: gross to net by month, the payouts that match and the ones that do not, days from sale to bank, recurring revenue, refunds and disputes as a share of sales, and who is paying late. Every view names the tables it reads, so the number and its source arrive together. Nothing about Stripe moves: charges, refunds and the payout schedule stay Stripe’s; the data warehouse holds a daily copy whose one test is that its payouts equal the bank’s deposits. The companion piece on the accounting side, why your dashboard and your accountant disagree on revenue, does the same for QuickBooks; the payouts here are the deposits there.
What to ask for
You do not need to build this yourself. Send three things to whoever owns your reporting, in-house, at your agency, or to yourself if that is you on Sunday night, and copy your bookkeeper:
- The Stripe data source page: every table that arrives and how the tables join.
- The analyst guide: loading the tables and checking them against the payouts.
- The dashboard page: what the Monday view is meant to look like.
And one condition before anything else is built: the first thing you want to see is the payout check, on your account, with the gap column. If it does not come back to the cent, the dashboard waits.
Turn your data into decisions.
Governed data marts give you the clean foundation ML needs to actually work.
- No AI hallucinations
- Analyst-governed definitions
- Every number traces to SQL
Frequently Asked Questions
Why doesn't my bank deposit match my Stripe sales?
Because a card sale is one event with three amounts and three dates, and the bank sees only the last of them. Stripe records what the customer paid on the day of the sale, what was left after its fee, refunds and disputes on the day that money became available, and the payout on the day it reached the bank. The payout for the last days of a month arrives in the next one, so a month-end always leaves some sales on the far side of the line, and every refund and chargeback is taken out before the money leaves Stripe. In the account we read, customers were charged $227,495 over thirteen months and $209,278 of it reached the Stripe balance; the rest was fees, refunds and disputes, each one a row attached to the sale it belongs to. Once Stripe's tables sit in your data warehouse next to the orders, the three numbers are three columns of one table and the gap between them is explained line by line.
How long does a Stripe sale take to reach the bank?
It depends on the payout schedule on your Stripe account, and the only honest answer is the one measured on your own payments. In the account we read, the median payment reached the bank three days after the sale, nine in ten took four days or fewer, and none took more than five. That is enough to explain why the last days of any month show up in the next month's deposits, and why a strong week in the Stripe dashboard can be a quiet week in the bank app. Measure it as the days between a charge's `created` date and the `arrival_date` of the payout that carried it; the number tells you how far apart the dashboard and the bank statement will always be.
Which Stripe number should I report each month: sales, net or payouts?
One for each purpose, and say which one you are using. For whether the business did better or worse, use what reached the Stripe balance by the day it became available: it is net of fees, refunds and disputes, and it is the closest of the three to the revenue in your books. For cash, use the payouts by arrival date, next to the bank statement. For marketing, use sales by the day they happened, next to the ad spend of the same day, because that is the only one of the three the ad platforms can be judged against. The three come from three Stripe tables, charges, balance transactions and payouts, and once those tables are in your data warehouse each report names the table it reads.
How much of a Stripe payment actually reaches us?
In the account we read, 92 cents of every dollar sold: $227,495 charged, $209,278 that reached the Stripe balance. Stripe's fees took $3,902, fourteen refunds took $8,587, and six chargebacks on 565 payments, about one in a hundred, took $5,720 including the fee Stripe charges for each dispute. Your share will differ with your card mix, your refund rate and your disputes, which is why a percentage applied to the dashboard figure is never right for long. Each deduction is a row in Stripe's balance transactions table with the sale it belongs to, so the right way to know the number is to sum those rows for your own account, not to borrow someone else's rate.
Can Stripe payouts be checked against the bank statement automatically?
Yes, once Stripe's tables are loaded into your data warehouse every day. The check sums the movements inside each payout, sales, fees, refunds and disputes that became available between one payout and the next, and sets the sum against the amount the bank received. In the account we read, 140 of 146 payouts matched to the cent. Four of the six that did not had a named reason: a refund that became available on the morning of a payout and was carried against the next one, and money moved between two Stripe balances the day before. The other two were the first payouts in the history, which drew on money from before the tables begin. A check that runs every morning and names the row that is wrong is the condition to set before anyone builds a dashboard on top of the numbers.
Why can recurring revenue rise in a month when cash falls?
Because monthly recurring revenue counts what renews, not what was collected. It is a sum over the active subscriptions and their prices on a given day; in the account we read, $7,258 a month from 45 subscriptions on 6 November, three of them set to cancel at the end of their period. Cash in the same month is the payouts that arrived, which lag the sales by days, and it drops when refunds or disputes are taken out or when invoices are issued and not yet paid, seven of them for $18,266 in that account, none past due. The two numbers answer different questions and both come from Stripe's own tables, subscriptions, invoices and payouts, so you can show them side by side with the dates that separate them.