Every platform tells its own story. Facebook says one thing, Google says another, TikTok says a third. OWOX allows you to pull all of it into YOUR data warehouse, join it with your revenue data, so you get the cross-platform reports in Google Sheets (or just ask in Claude or ChatGPT) – no CSV exports, no conflicting KPIs.
↓ A real marketer, mid-conversation. Try it — click anything.

You know what each platform reports. You don’t know what actually happened. Because the data lives in silos, attribution is a mess, and your "cross-platform report" is a folder of CSV exports stitched together in Sheets. Here’s what changes when your data lives in a warehouse.
You don’t need a data engineering team to use a warehouse. You need OWOX to make it practical.
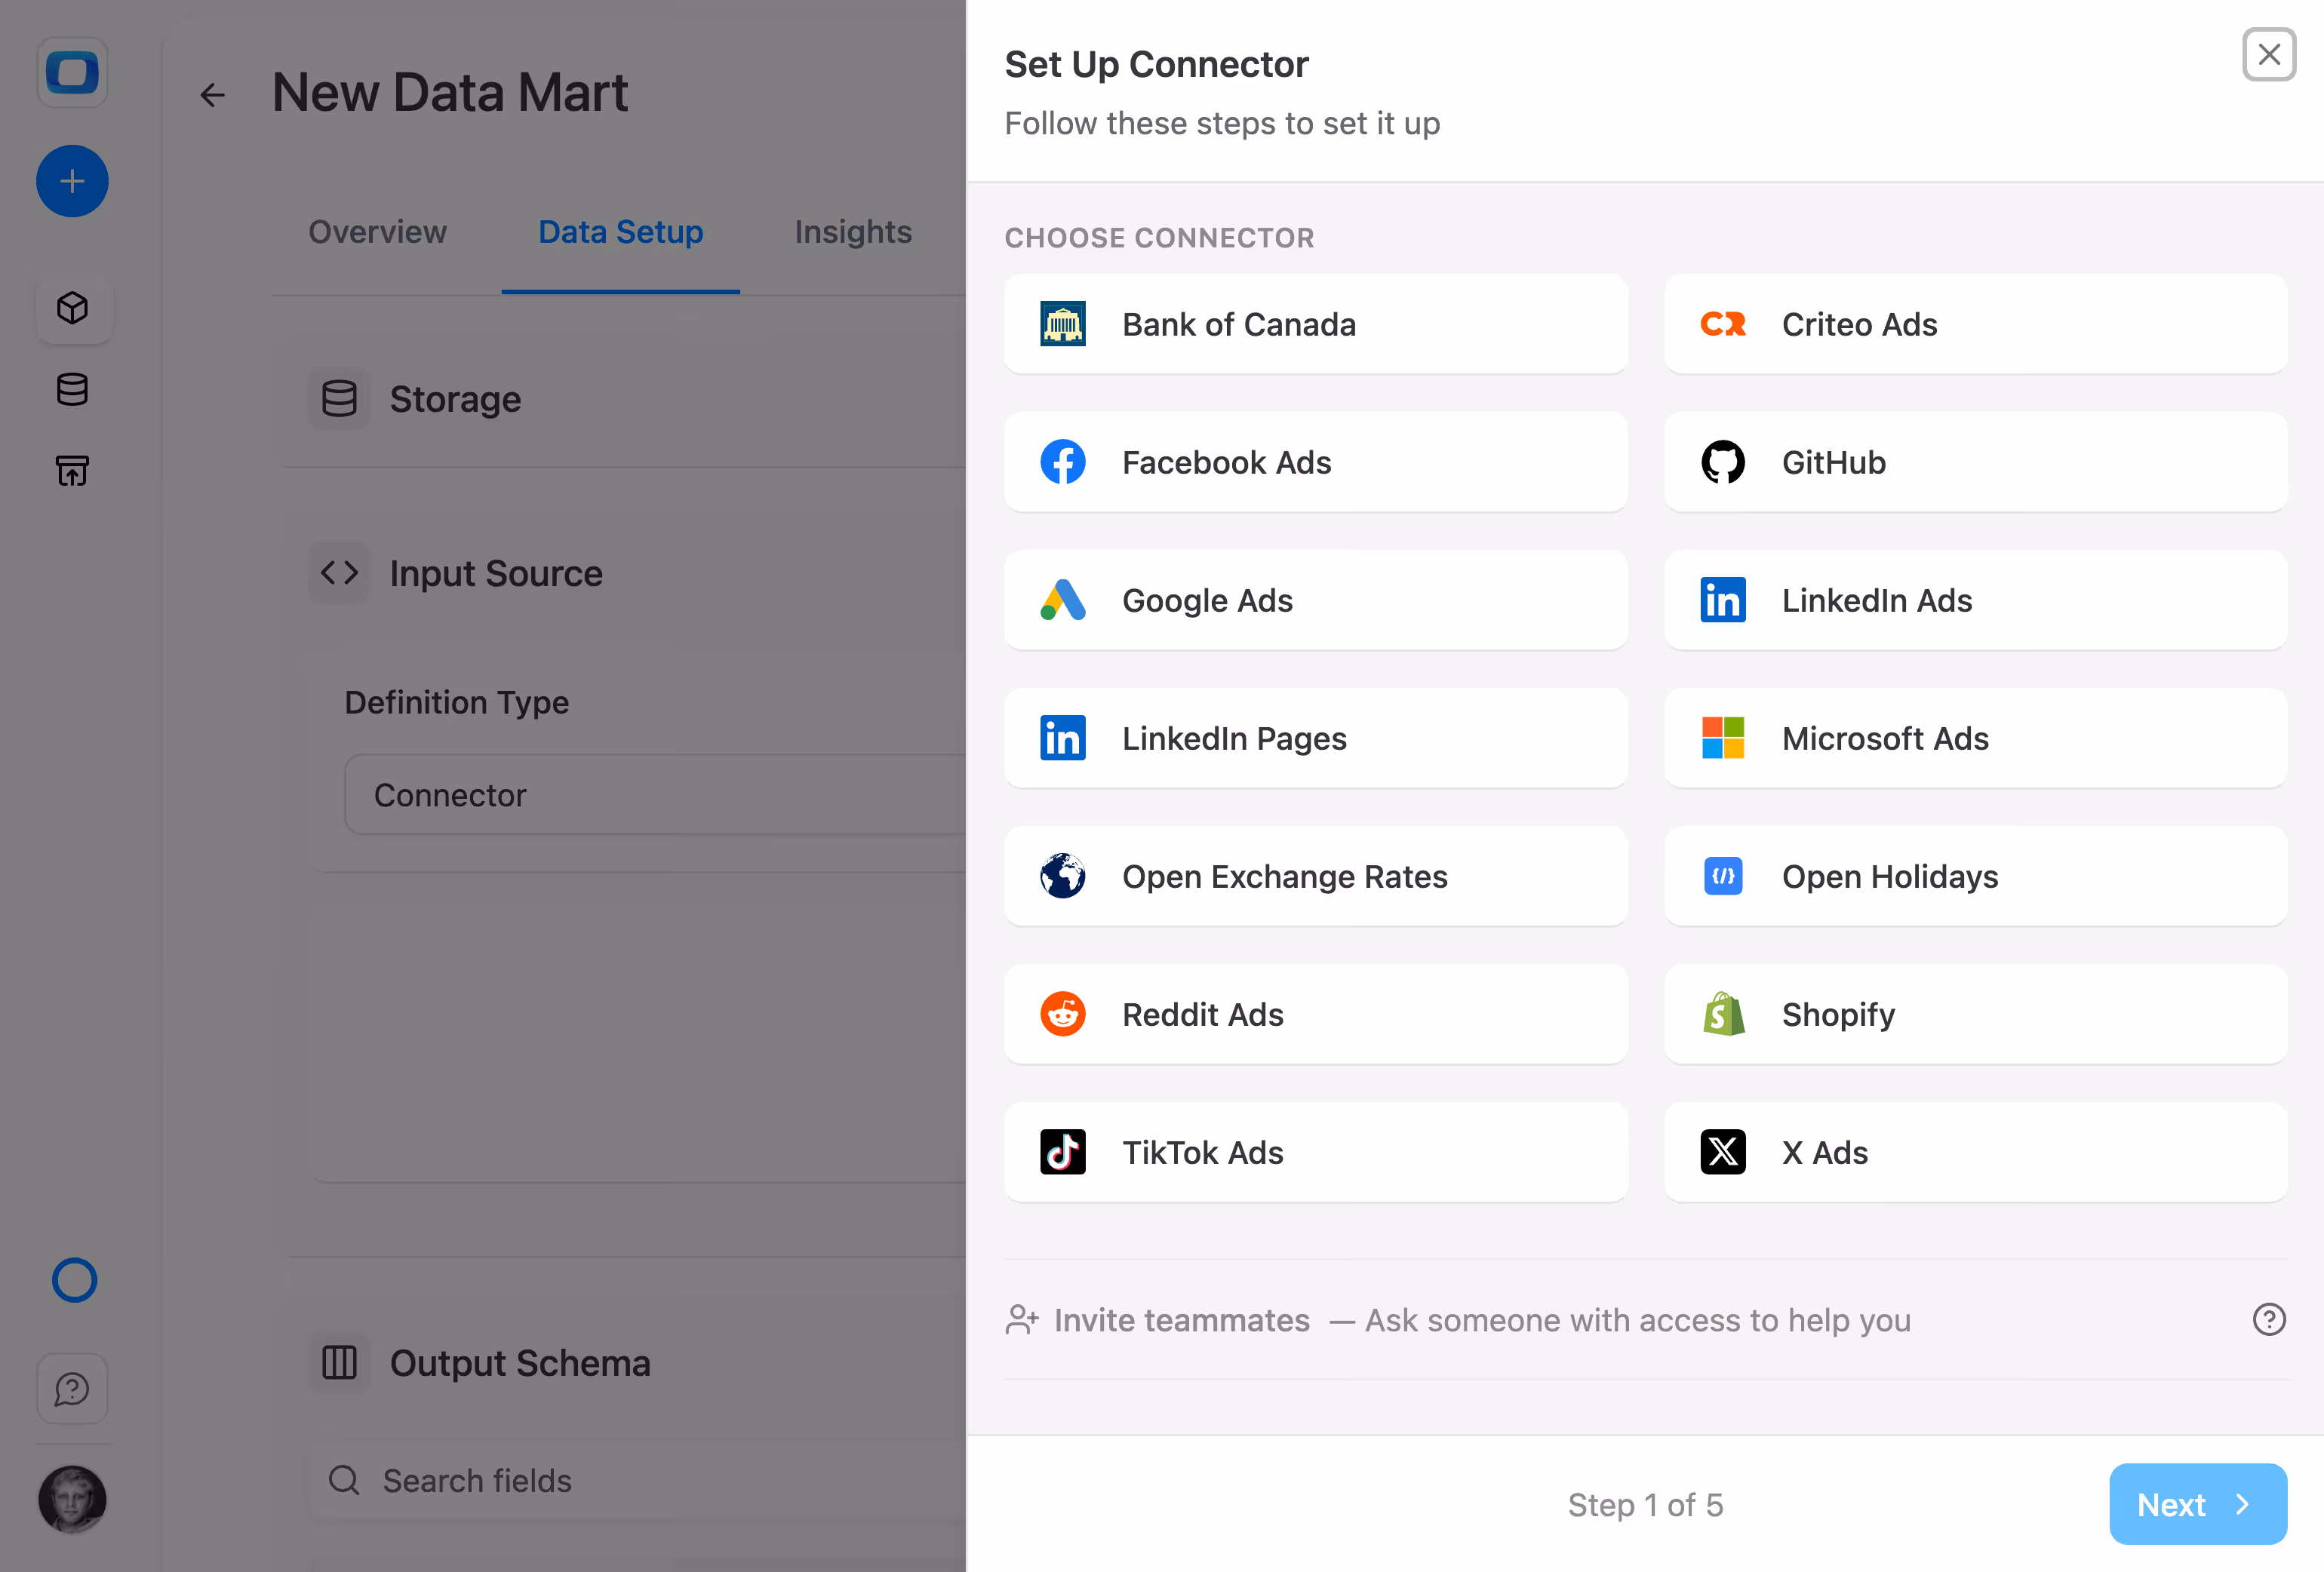
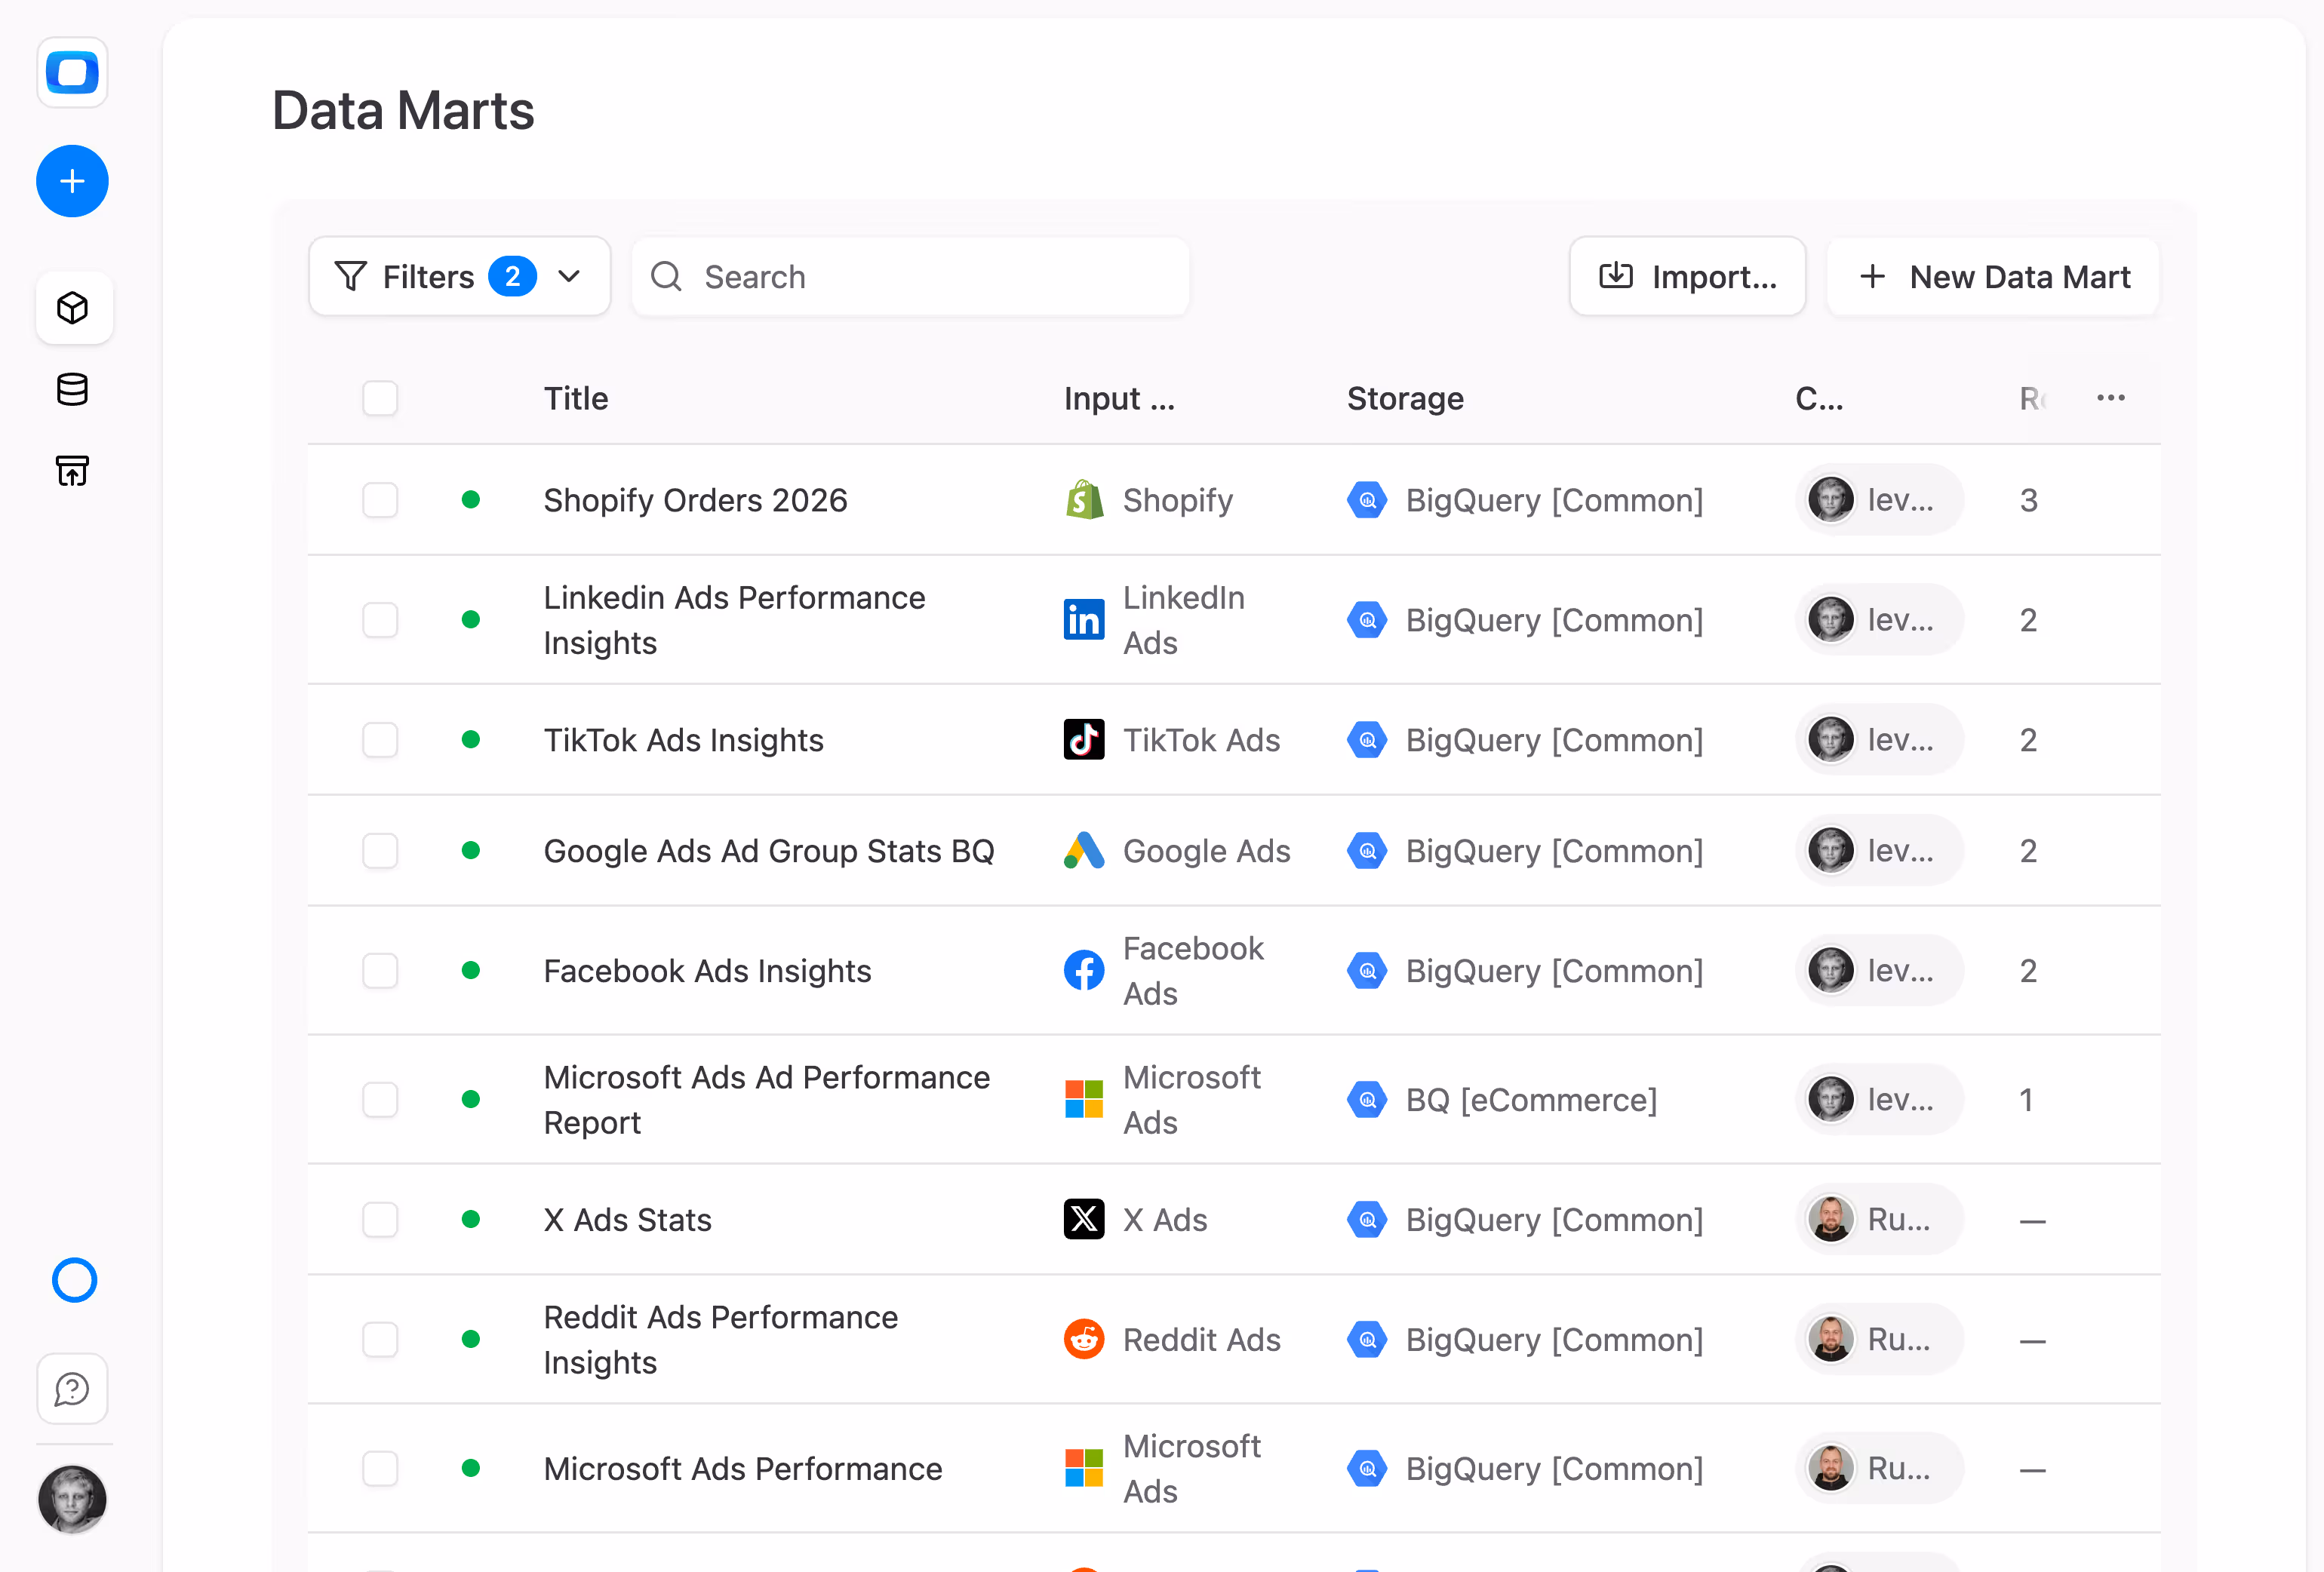
Get started free →OWOX connectors pull data from Facebook Ads, TikTok Ads, LinkedIn Ads, Google Ads, Microsoft Ads, X Ads, Reddit Ads, and Criteo — straight into your data warehouse.
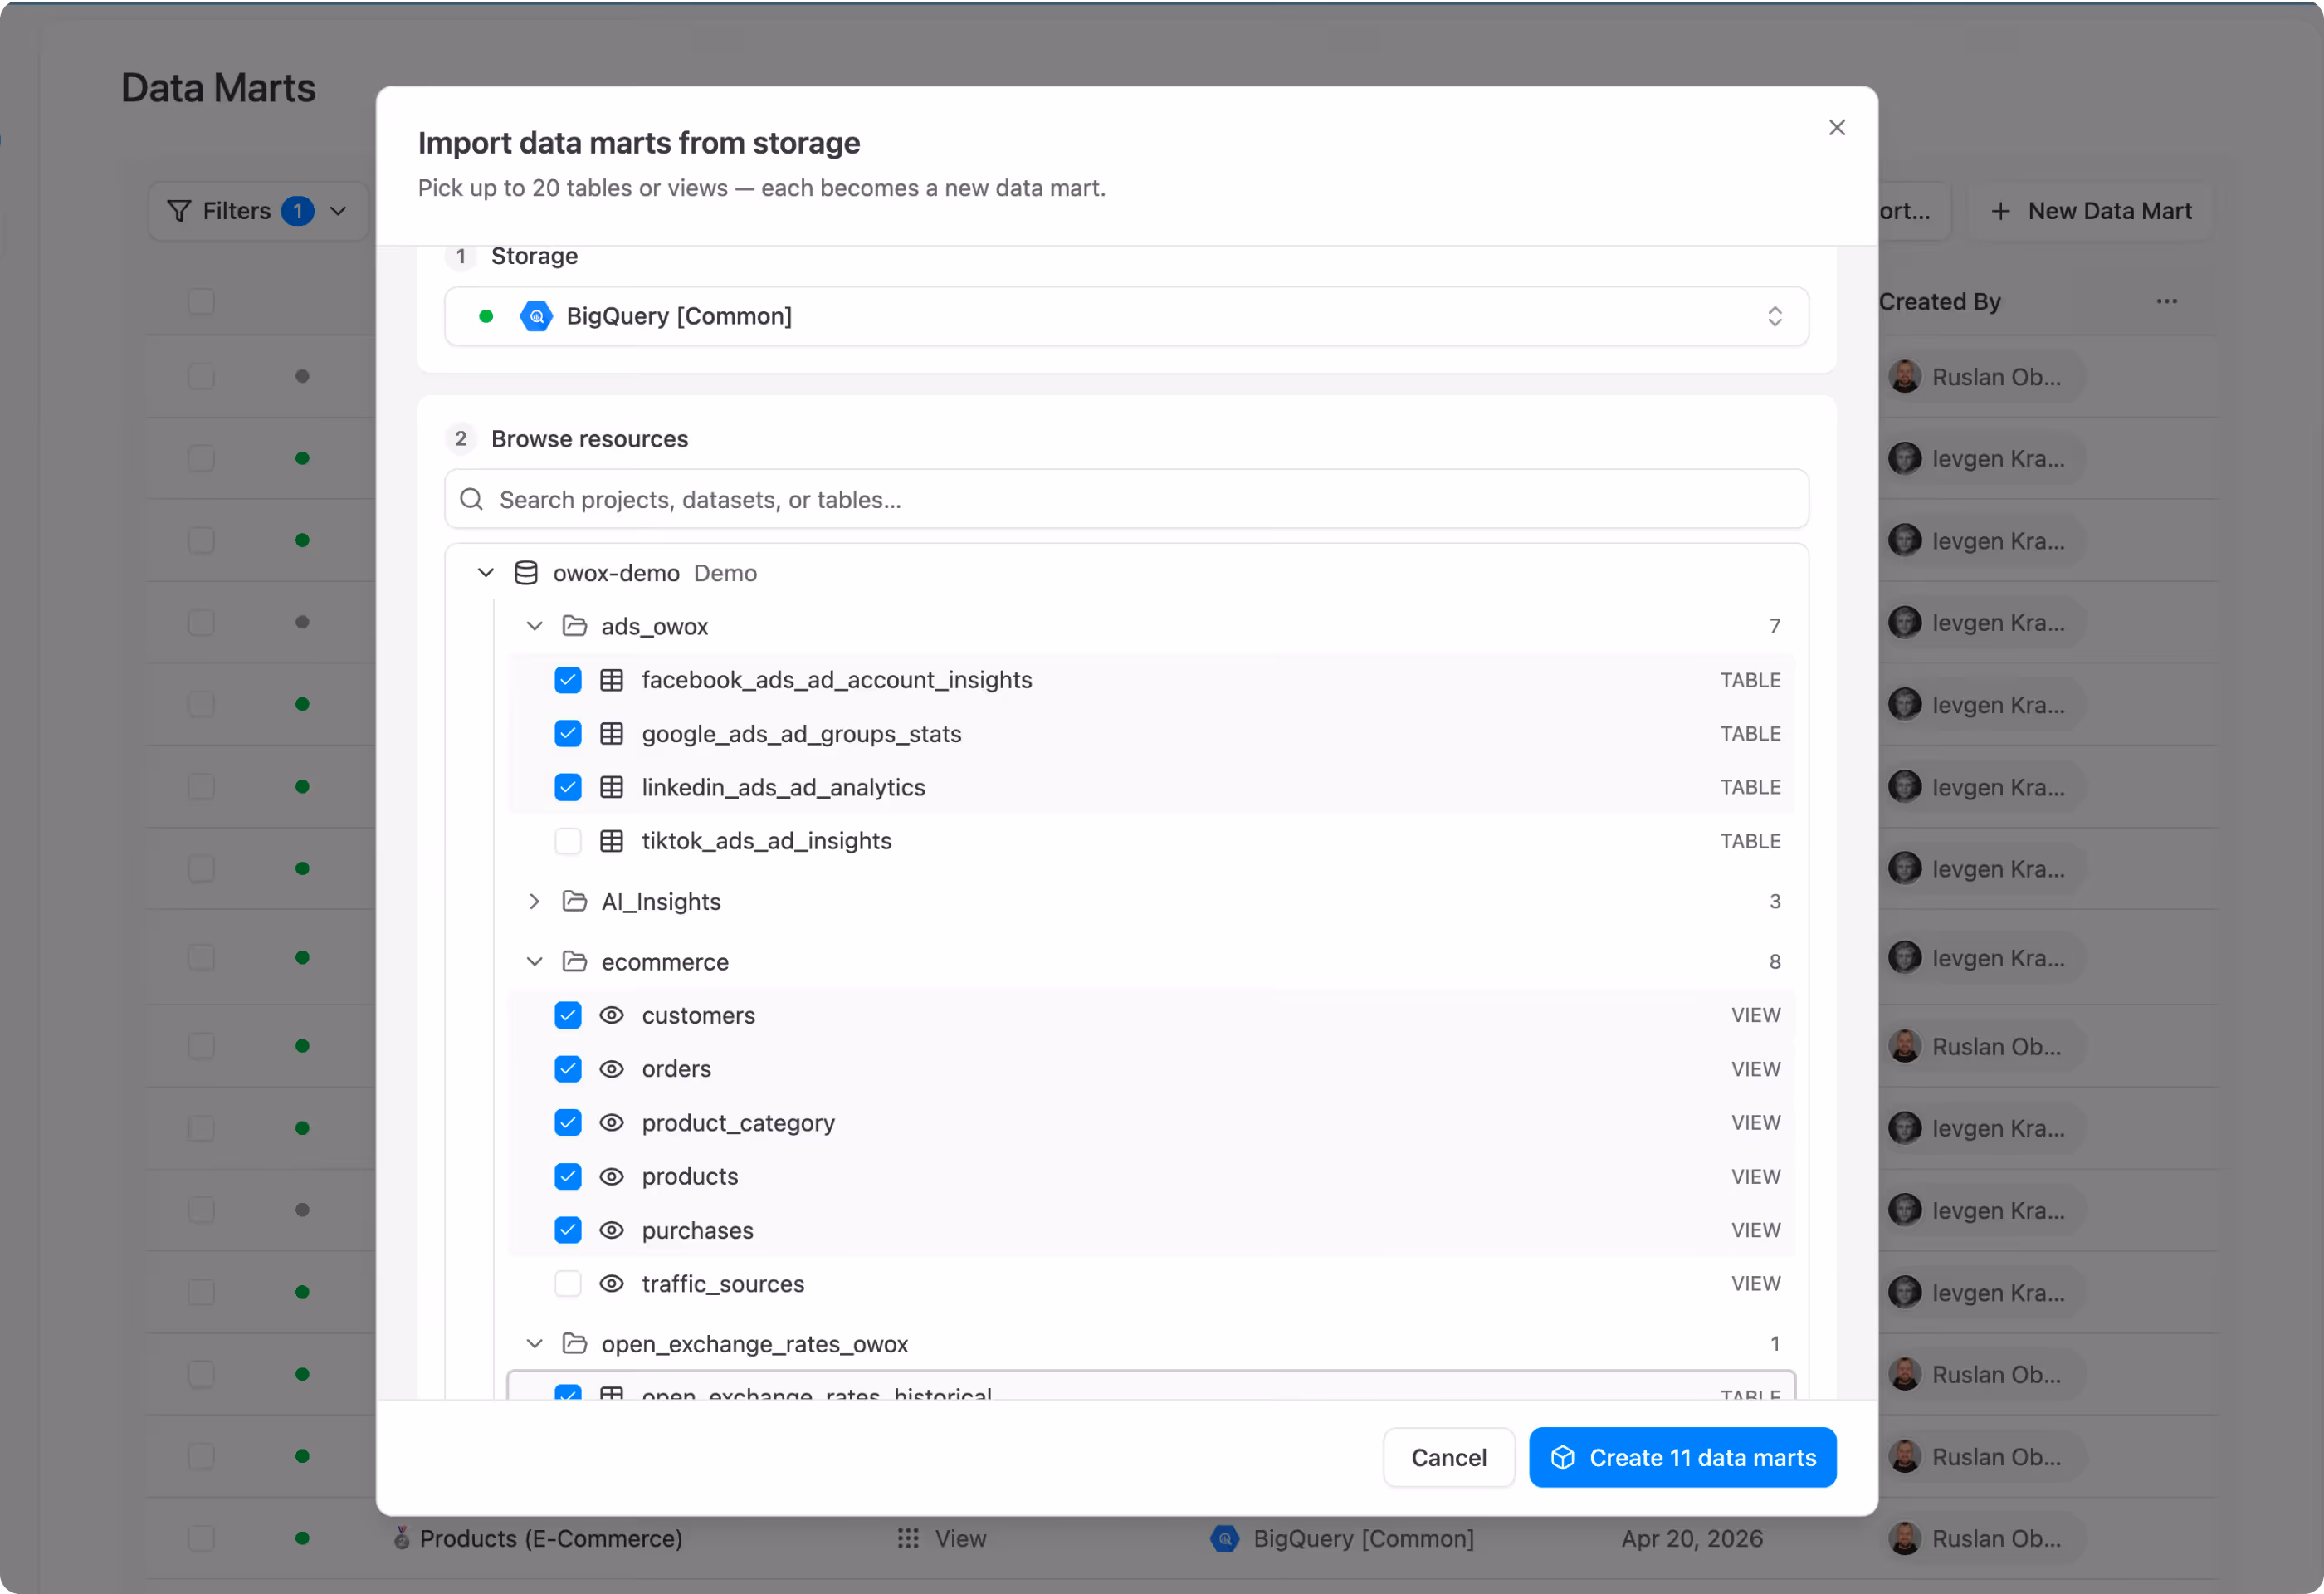
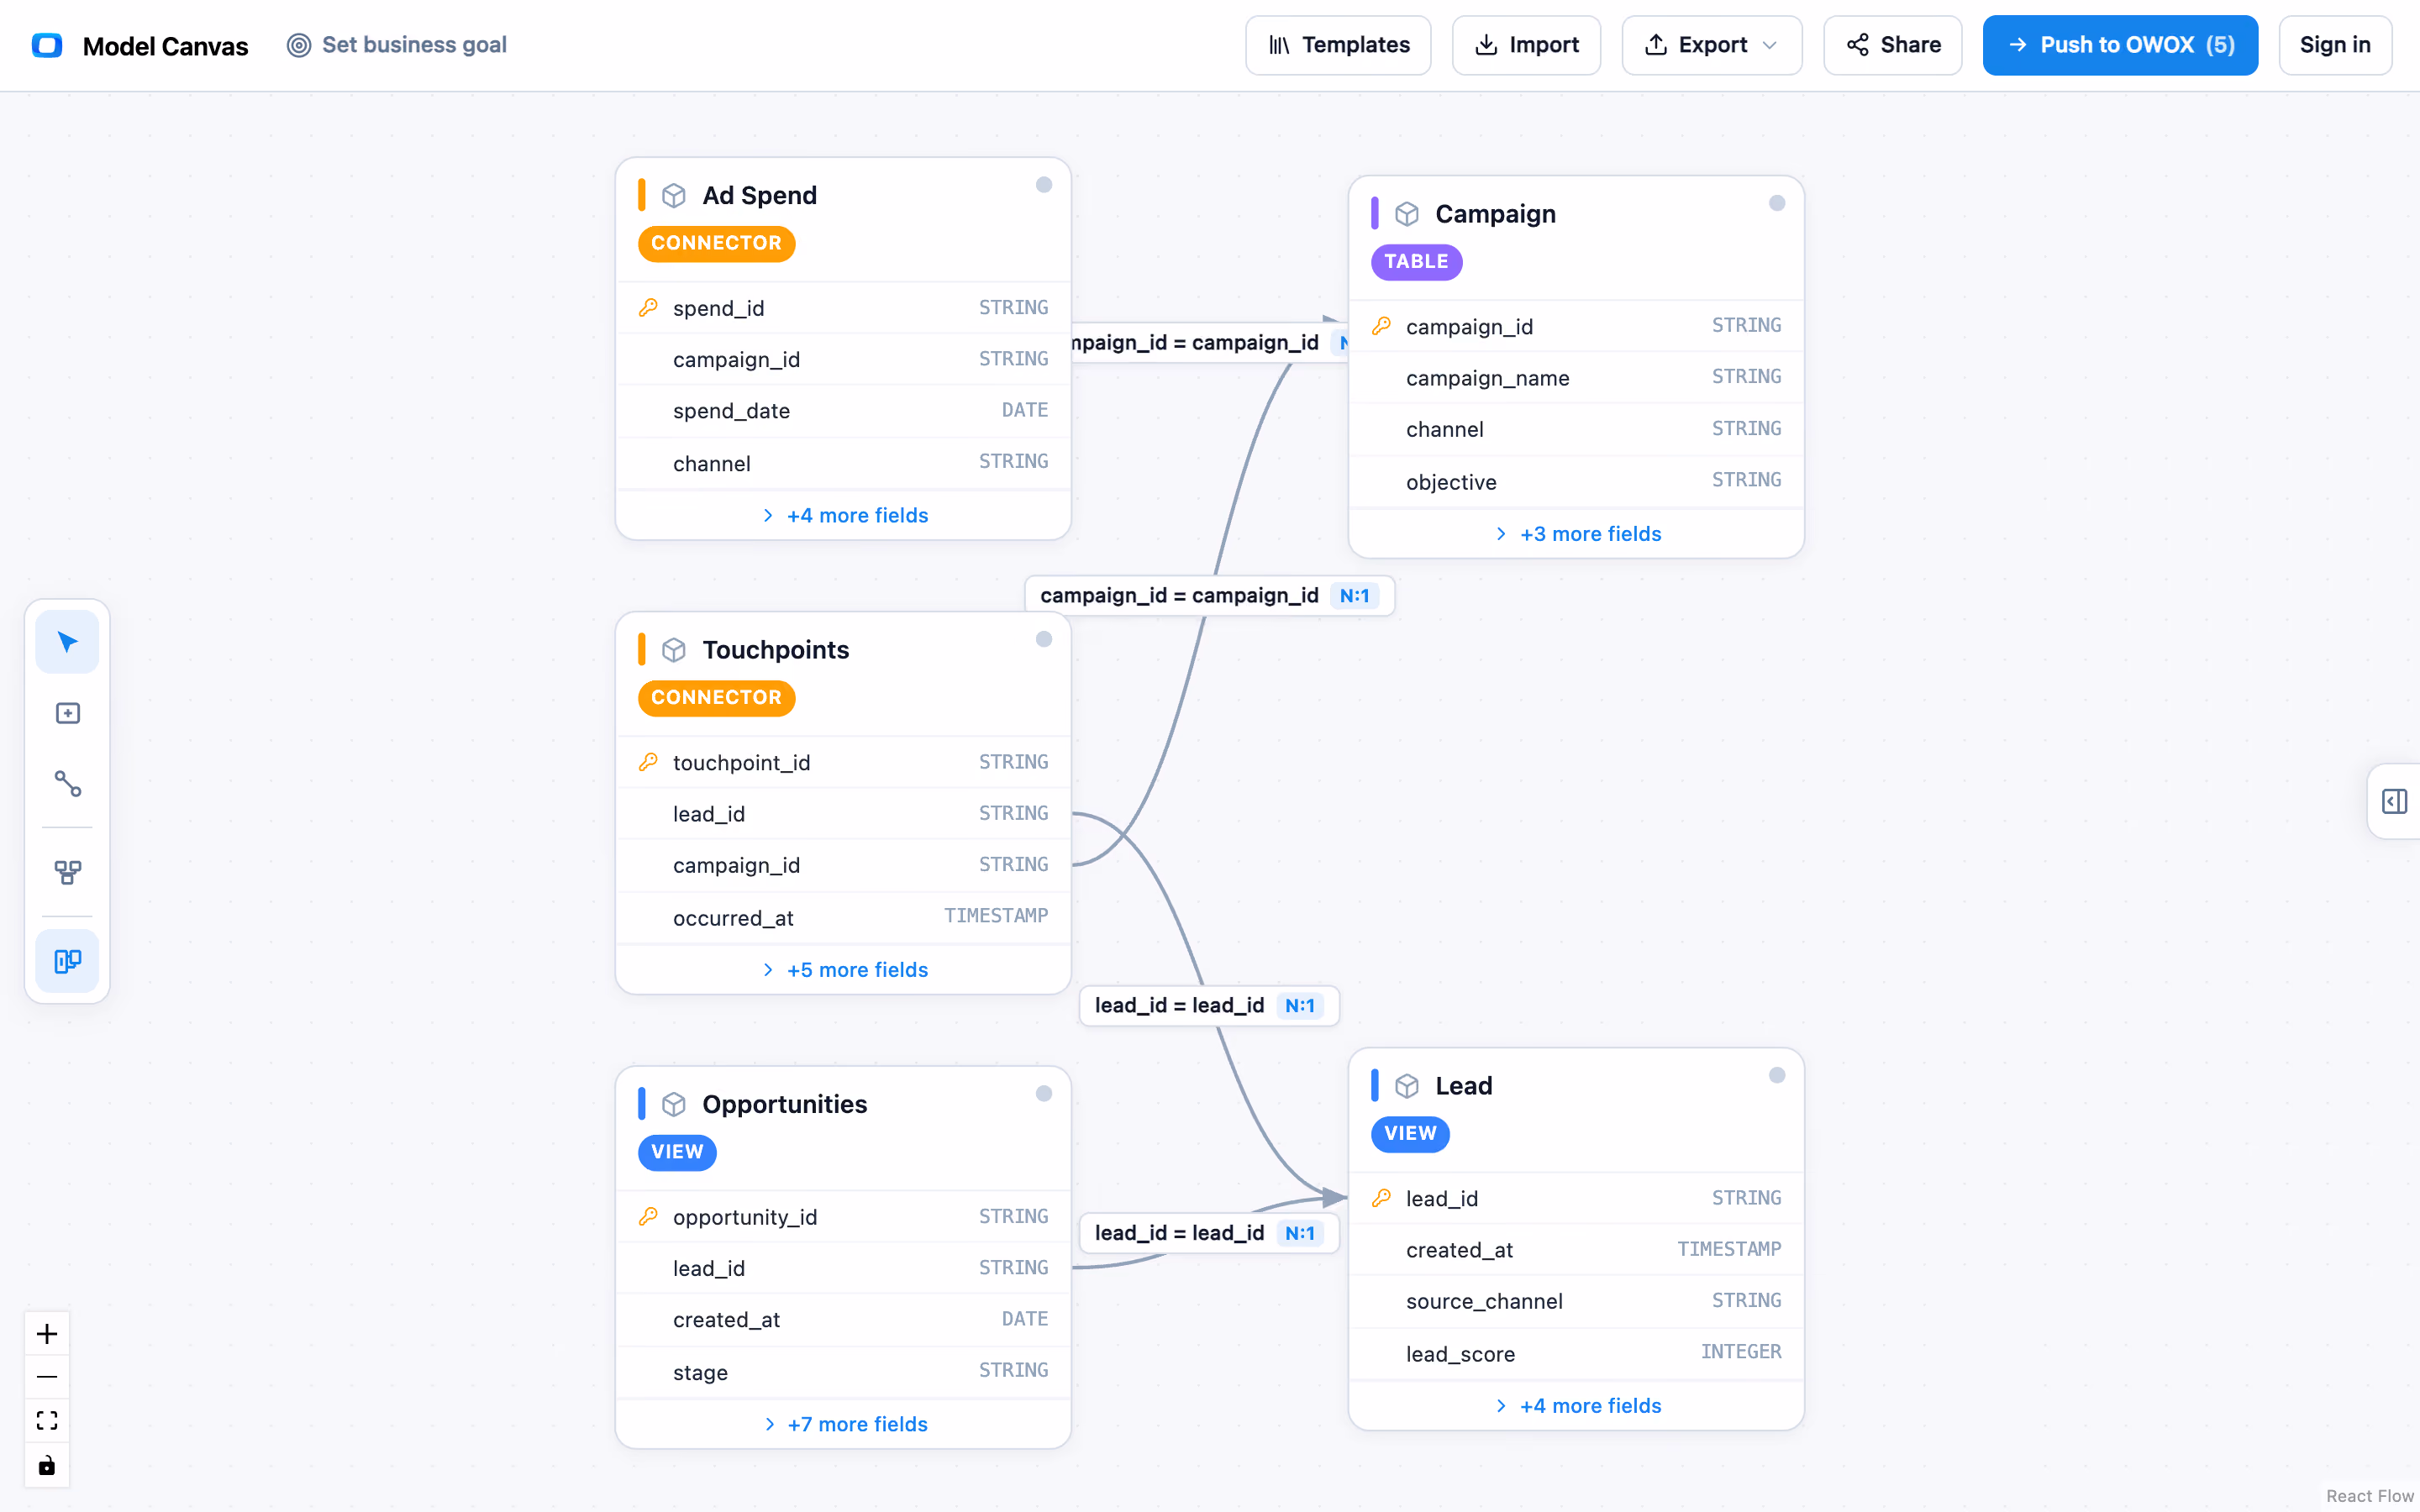
Once your ad data lands in the warehouse, OWOX turns it into a governed Data Mart library. Join Facebook Ads spend with Shopify revenue. Join TikTok campaigns with GA4 sessions. Every join is defined once, reused everywhere — no more Monday morning CSV stitching.
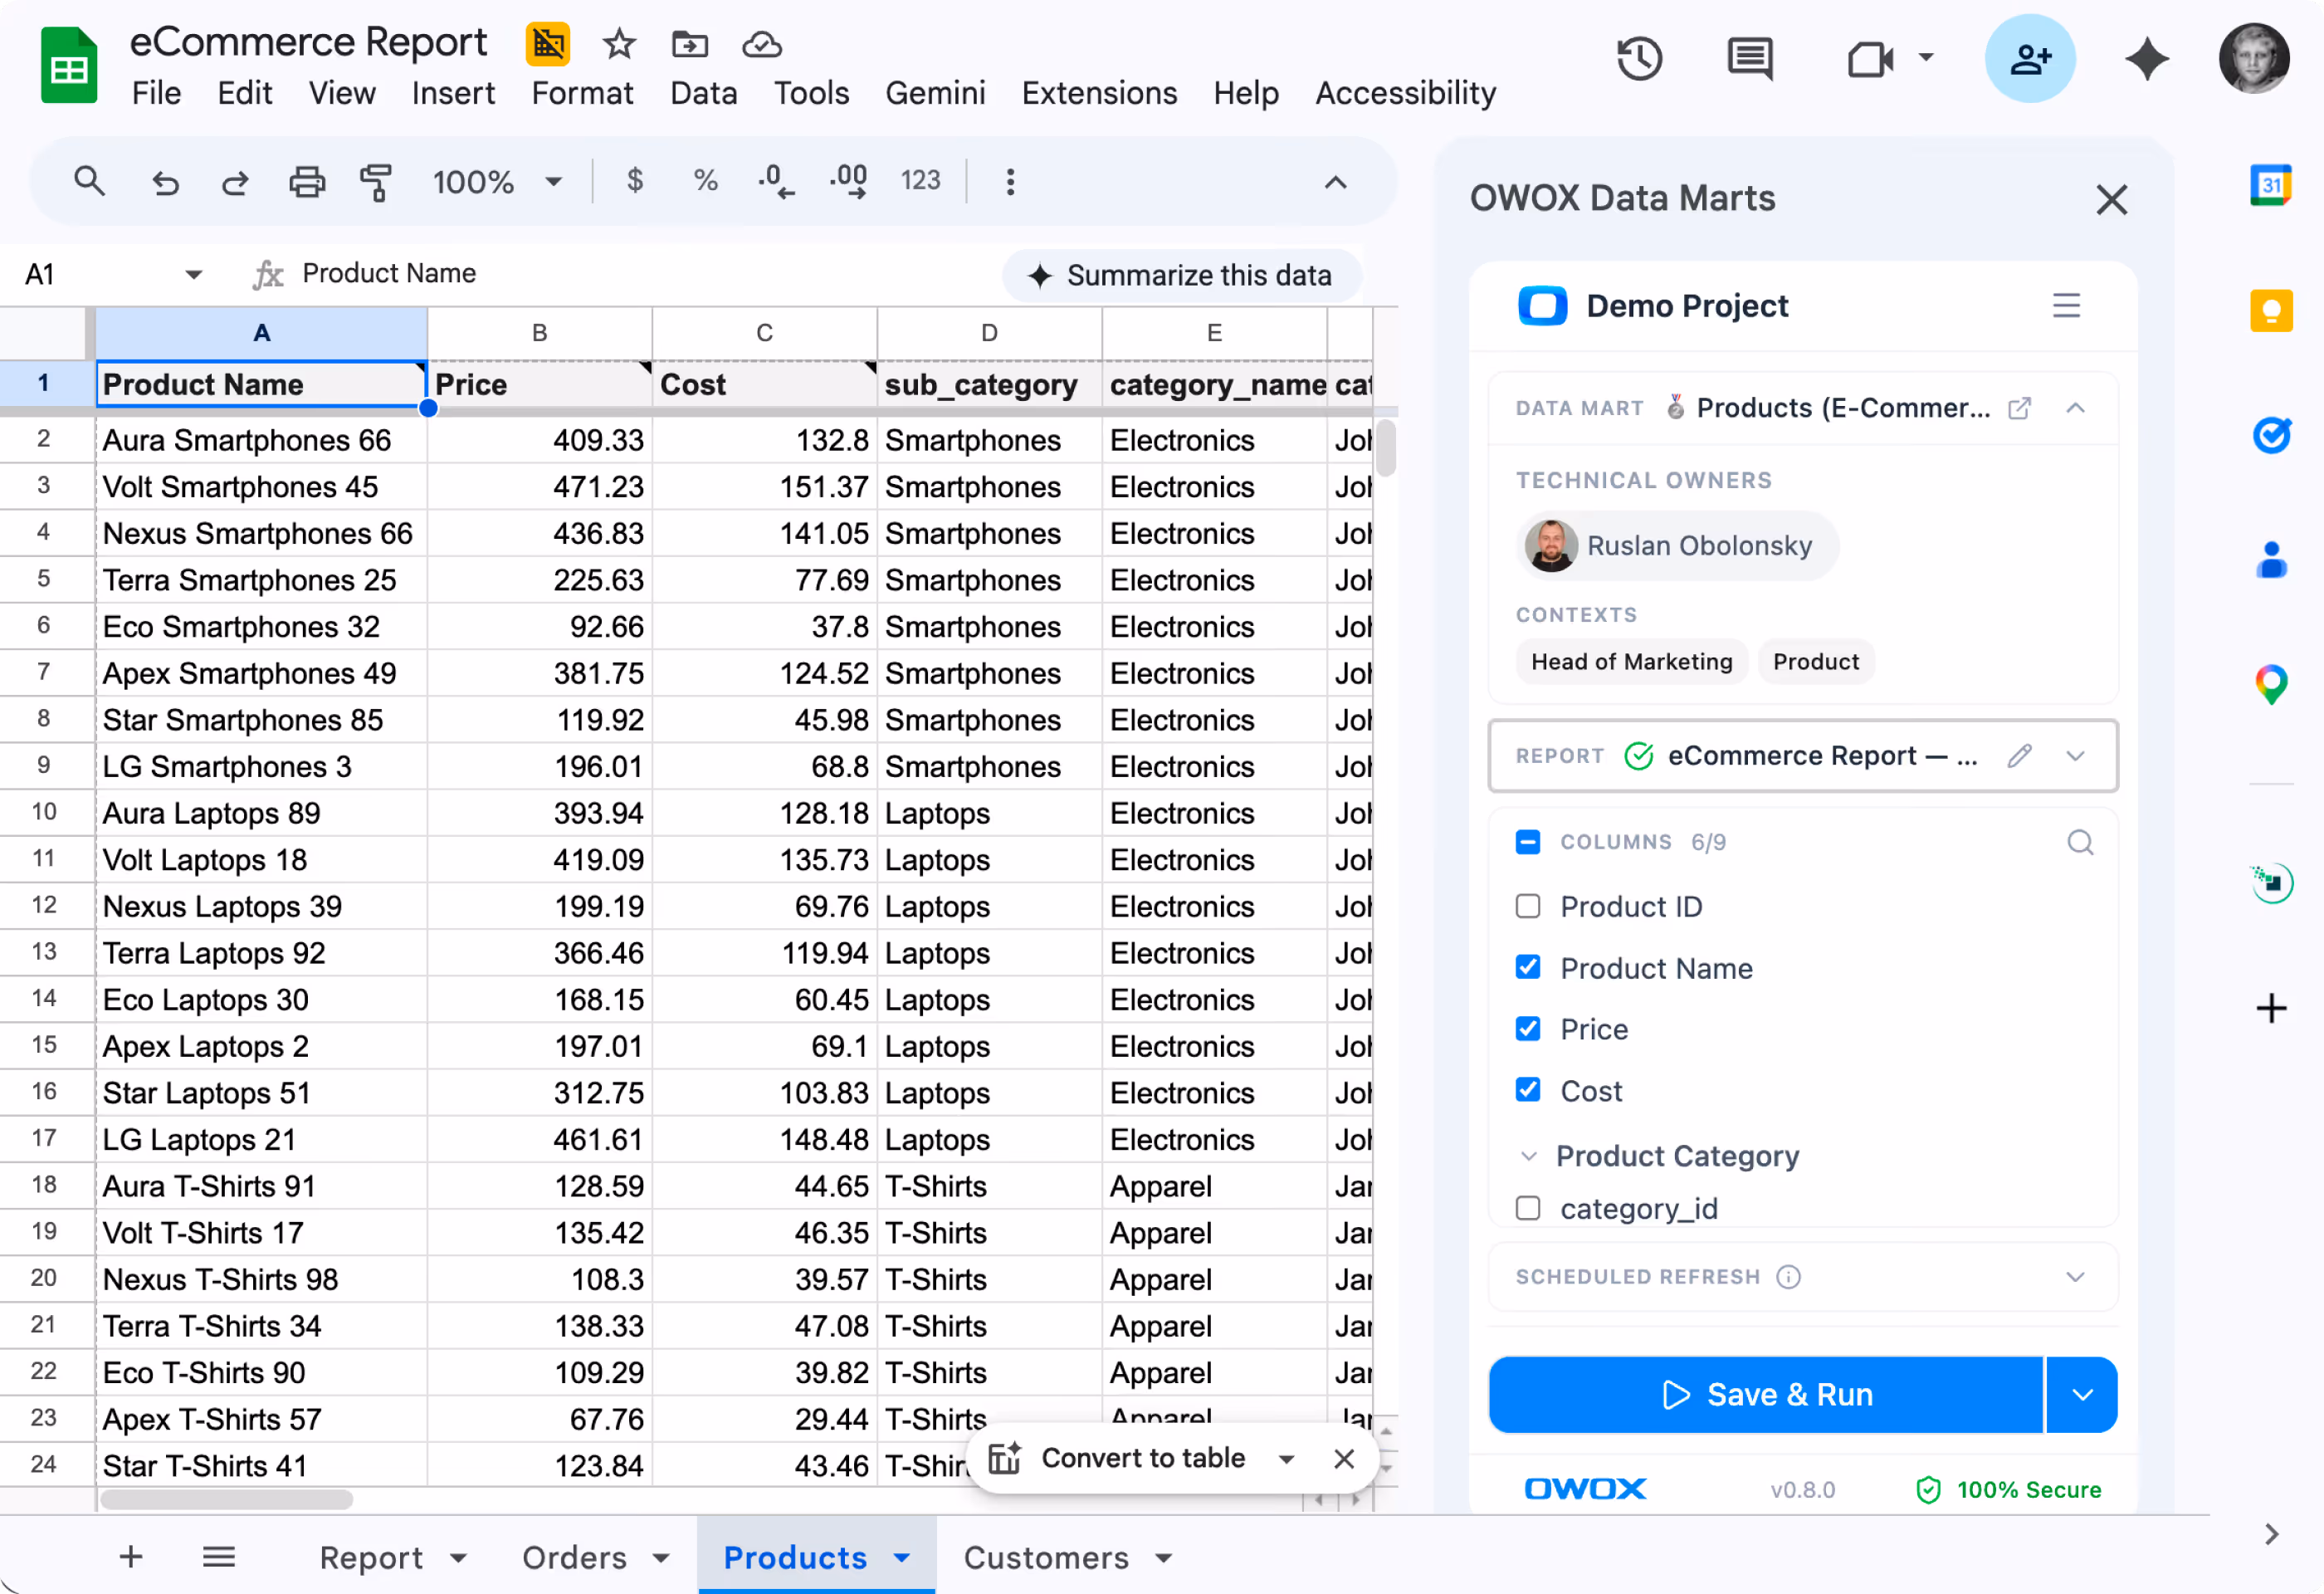
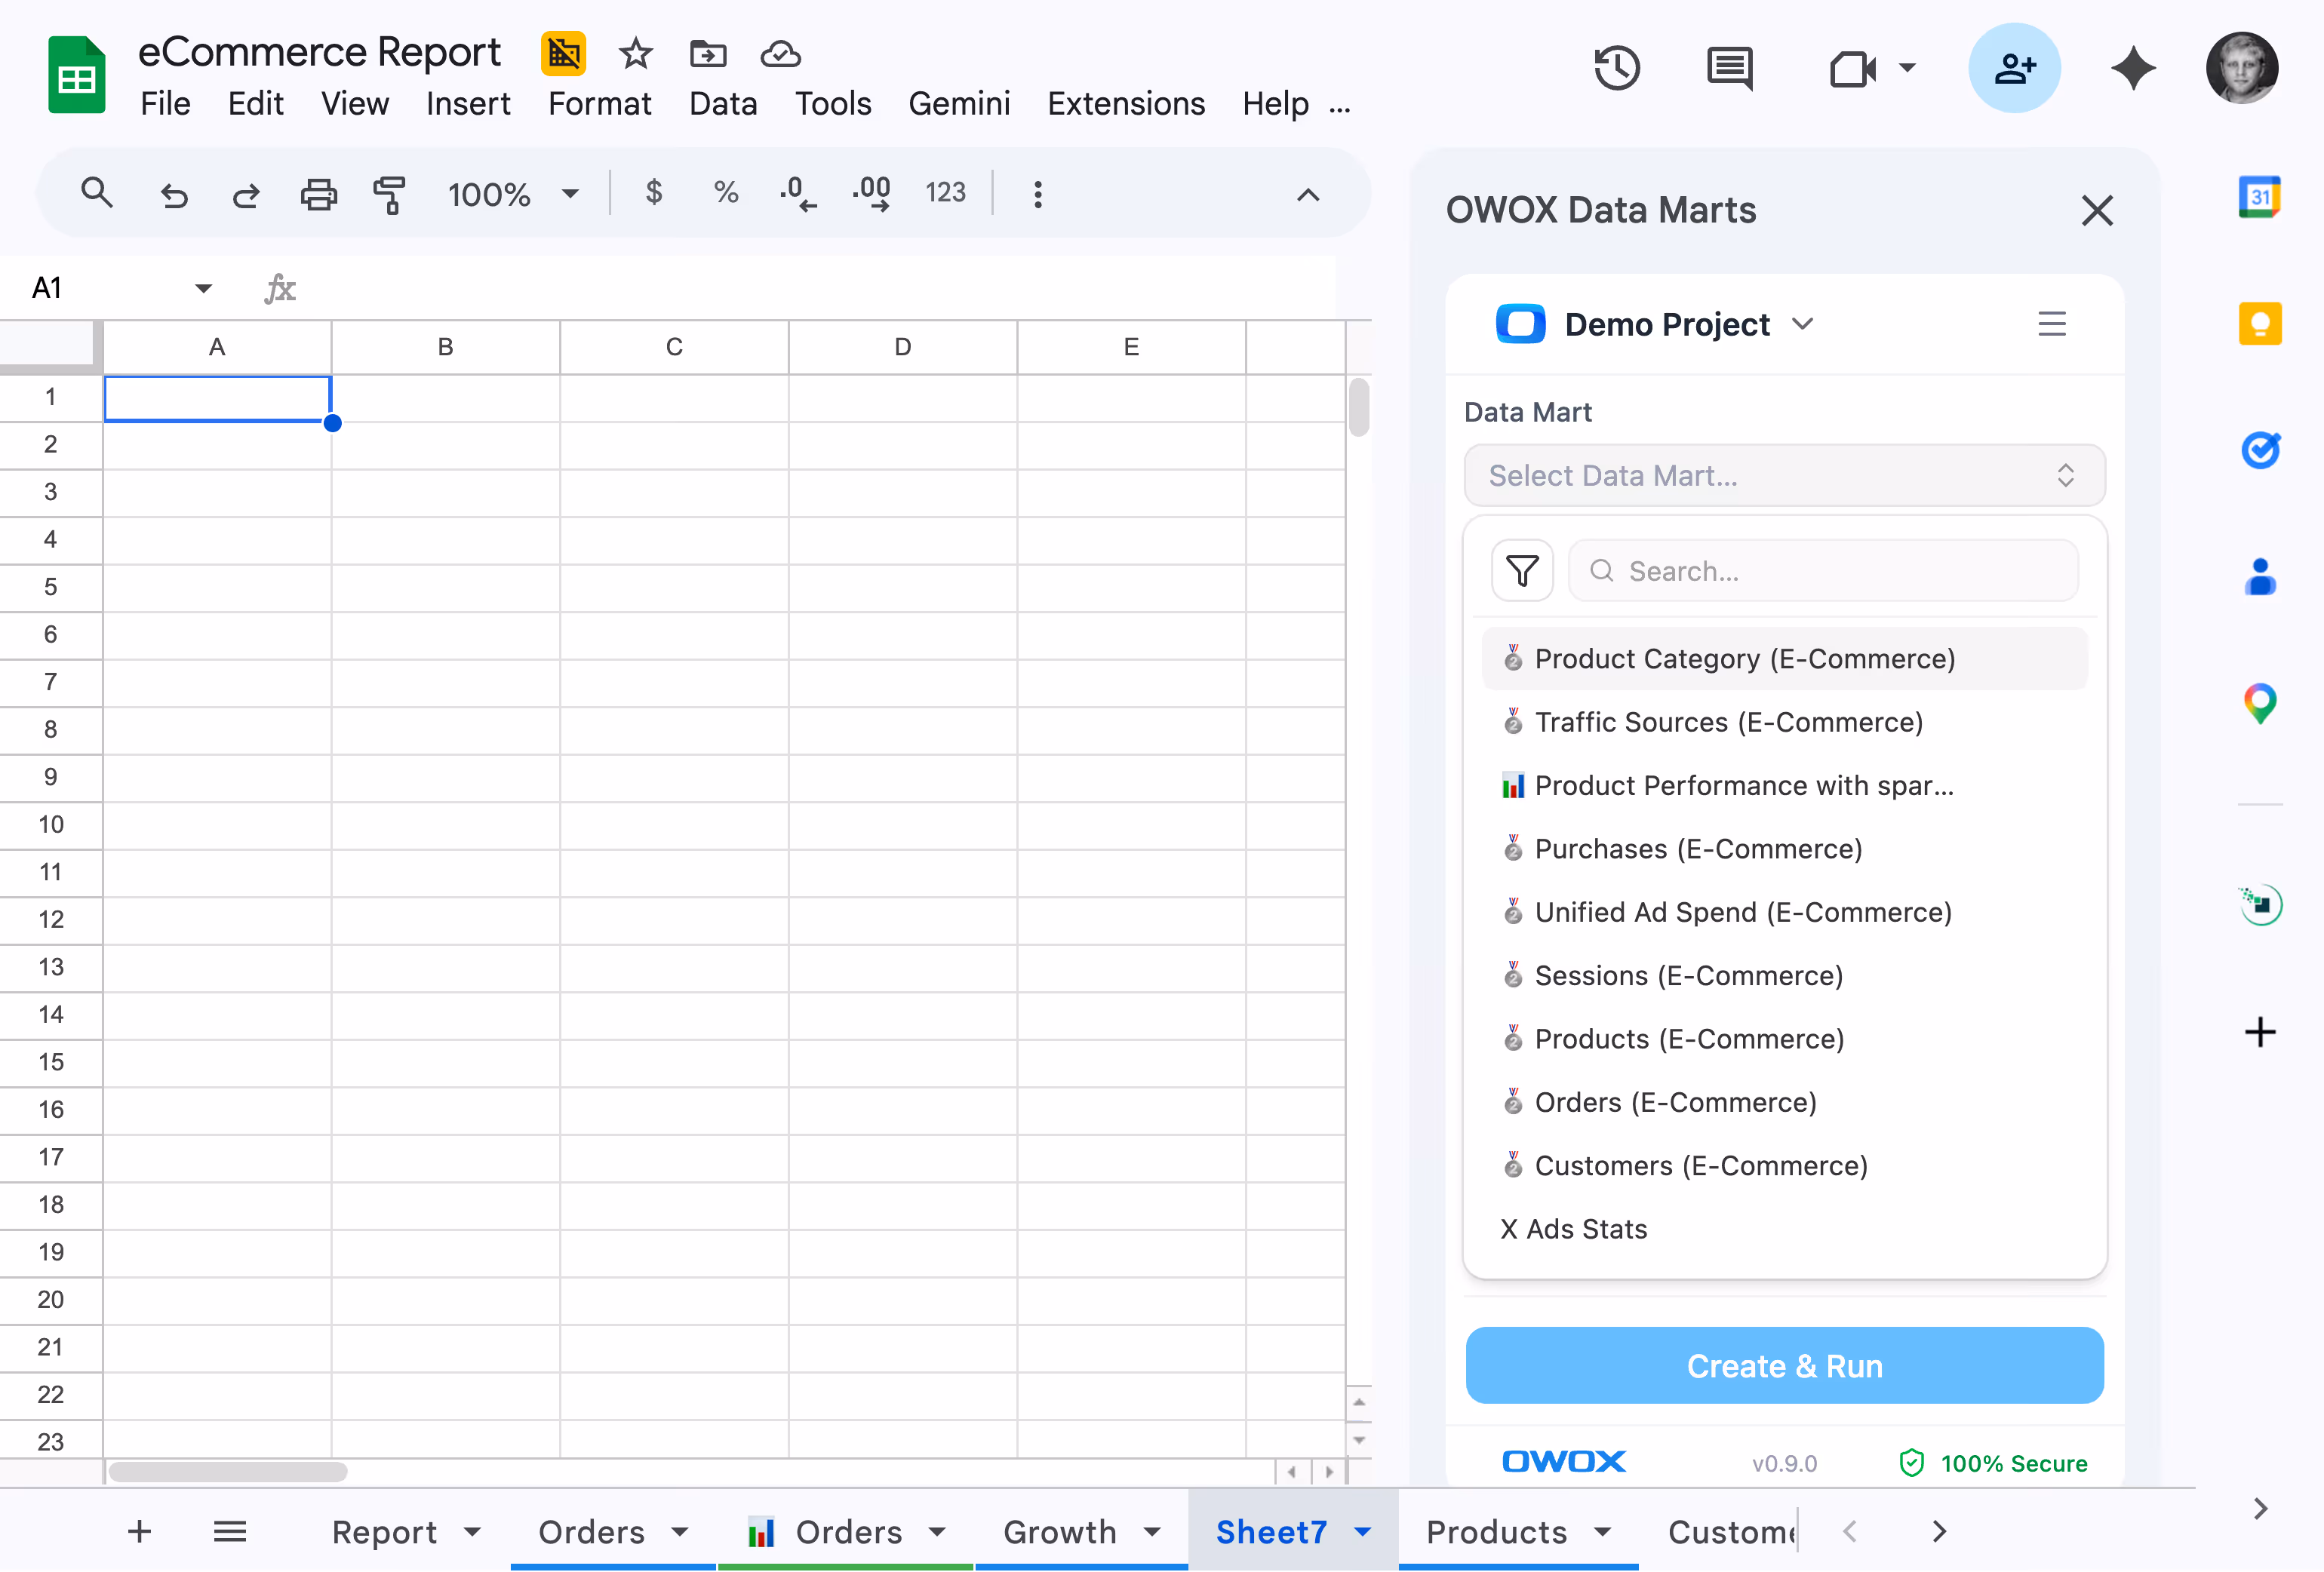
The OWOX sidebar puts your entire Data Mart library inside Google Sheets. Browse your campaign data, join ad spend with revenue by pre-defined keys, pick the columns you need, filter by platform or region, and schedule automatic refresh. You just became your own analyst.
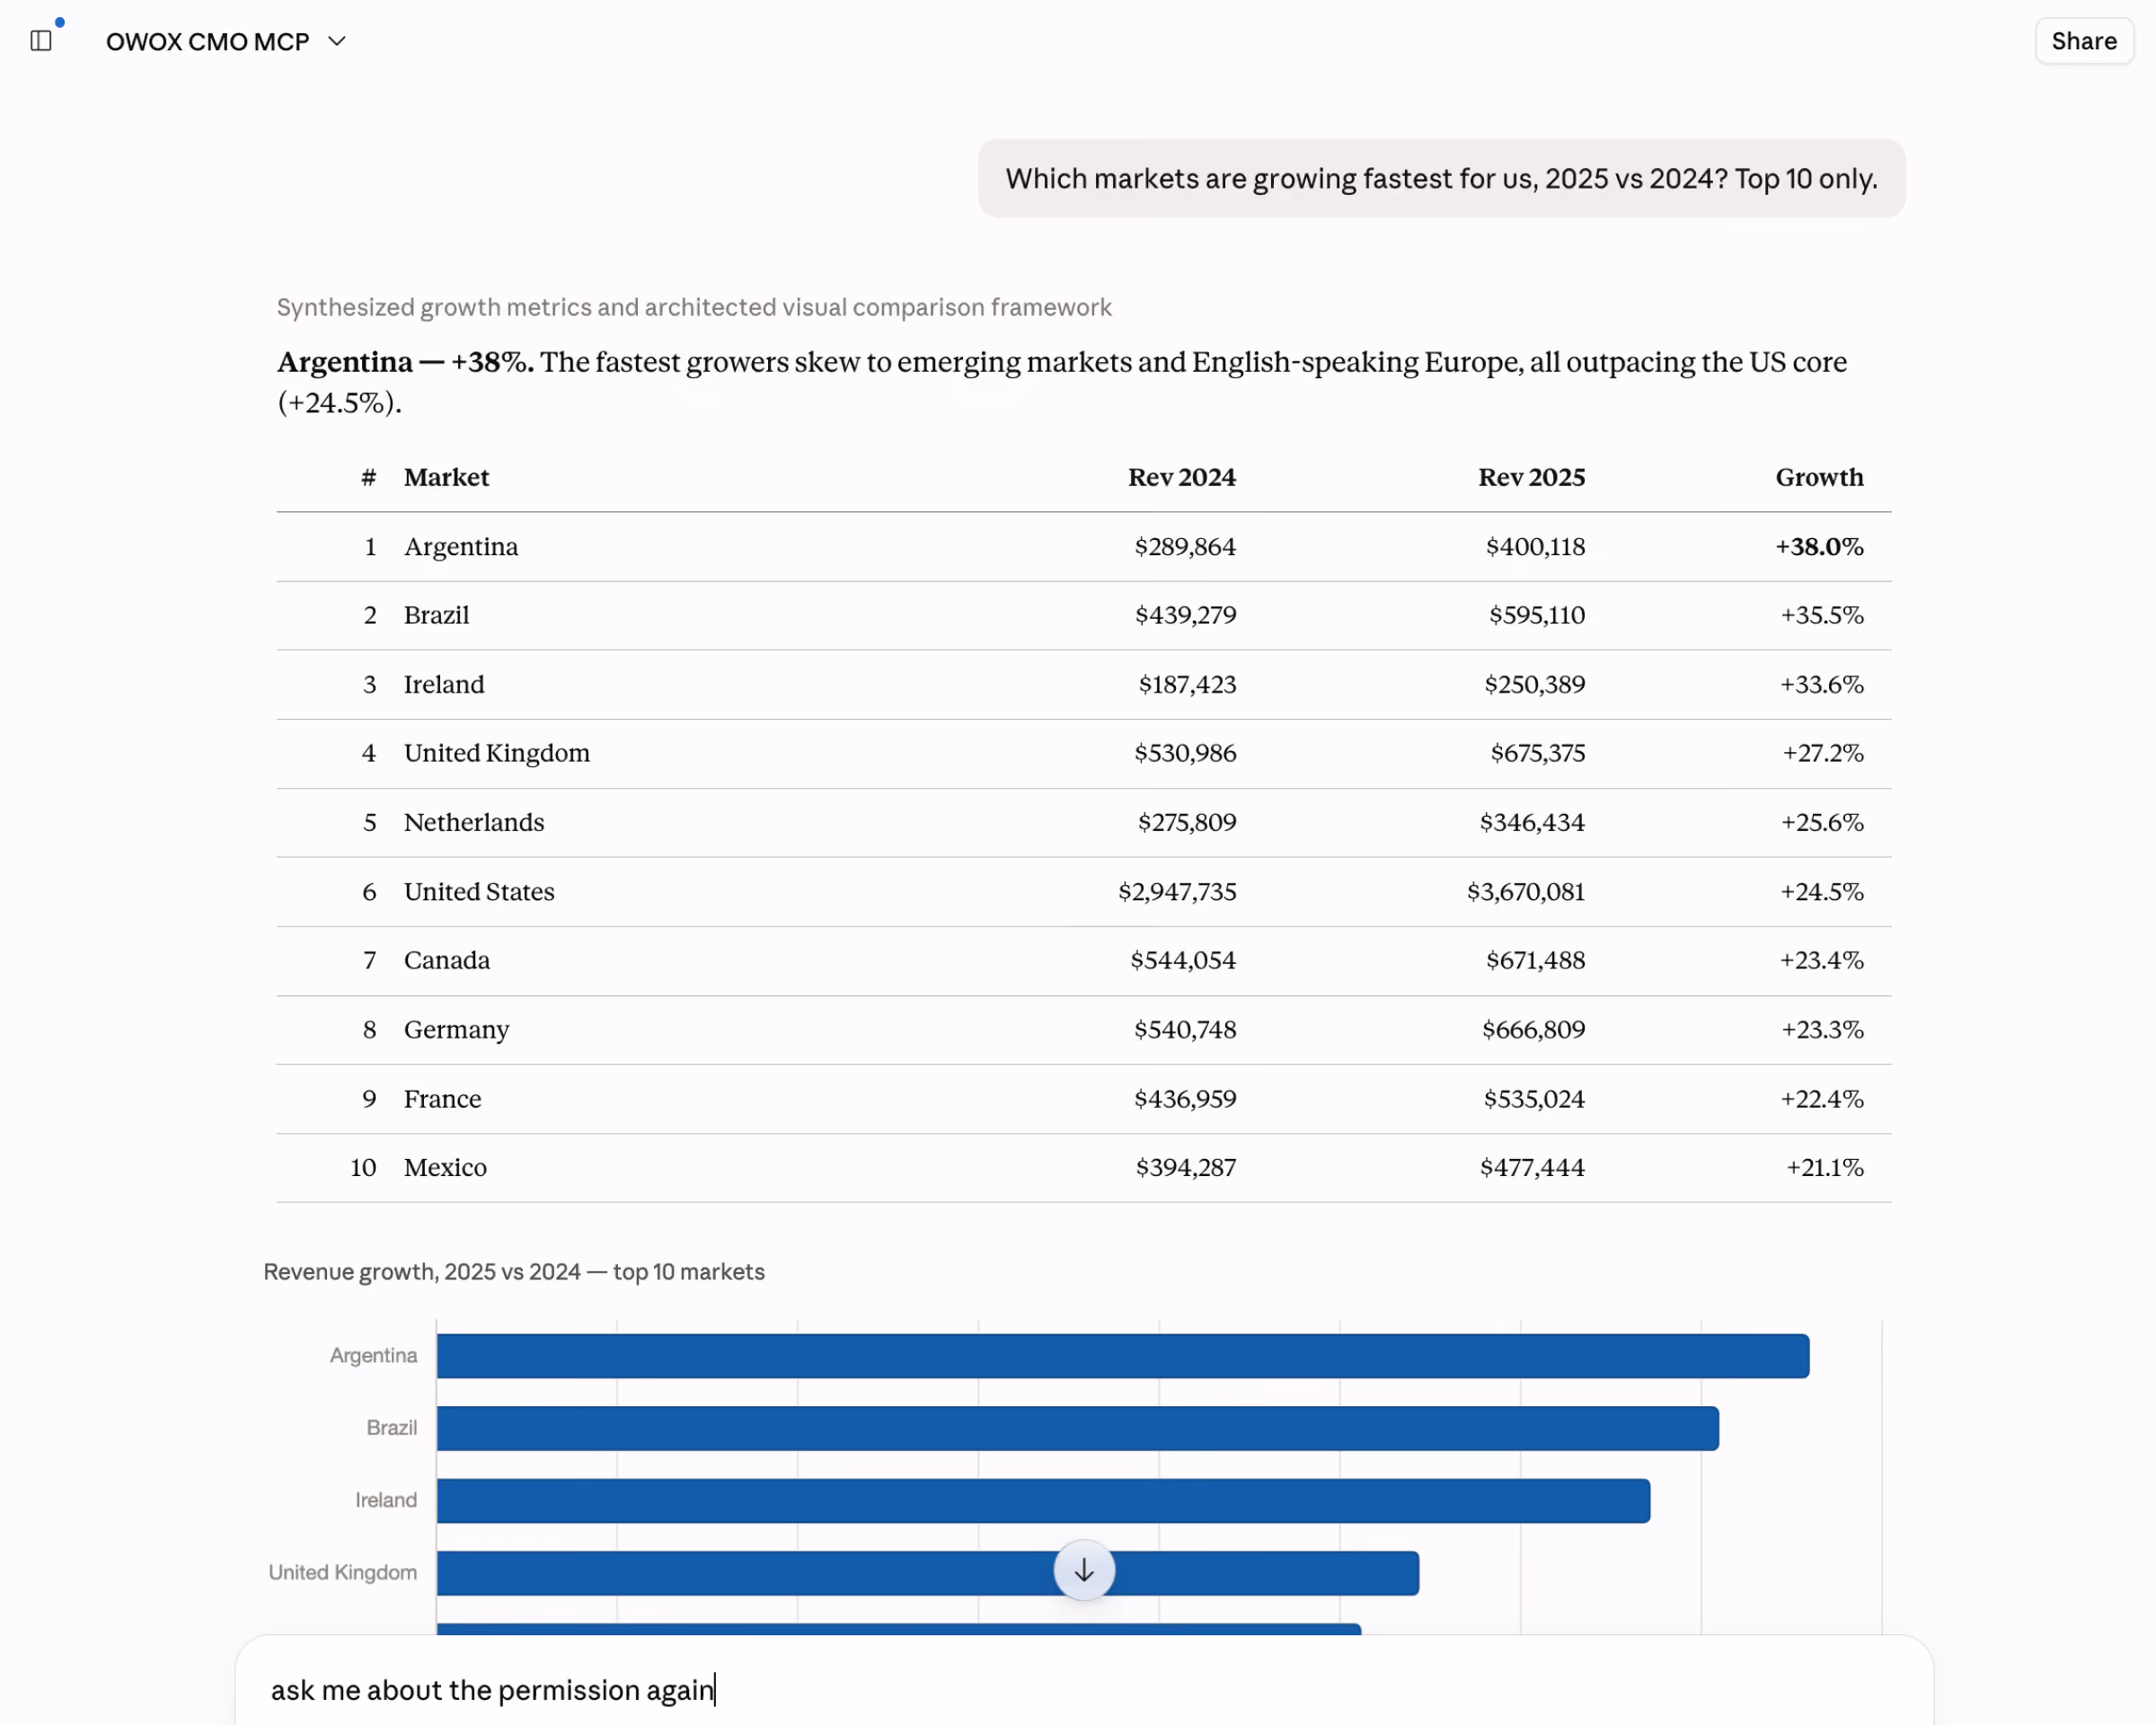
Don't want to open Sheets? Type your question into the AI chat you already use: "Facebook ROAS by campaign this month?" You get the answer with a chart — pulled from the same governed Data Marts, computed by SQL your analyst approved. This is MCP: self-serve, without even opening a spreadsheet.
Connect your Facebook Ads and Google Ads accounts. Data lands in your warehouse. OWOX creates the Data Mart. You open Sheets, pick columns, and see cross-platform spend vs. revenue — side by side, for the first time, without a single CSV export.
You don’t need a data engineering team. You don’t need SQL. You need 15 minutes, free to start. Here’s how it works.
Pick your platforms — Facebook, TikTok, LinkedIn, Google. OWOX connectors pull data into your warehouse automatically.
OWOX creates governed Data Marts. Join ad spend with revenue or GA4 sessions. One definition, reused everywhere.
Browse the library in Sheets, pick columns, schedule refresh. Cross-platform performance report your CFO can trust.
When your data lives in a warehouse and your reports pull from governed Data Marts, everything changes.
When someone asks "should we cut TikTok spend?" — you pull up cross-platform ROAS joined with actual revenue, not platform-reported conversions. You answer in 30 seconds with numbers that reconcile.
Join ad platform data with your CRM and revenue systems in the warehouse. See which campaigns actually drove revenue — not which platform claimed credit.
The marketer who can pull cross-platform data in Sheets, show real ROAS, and defend budget allocation is the marketer who gets promoted. That's you now.
The governed campaign library you pull from in Sheets is built and owned by a Reporting Analyst your data team deploys — define the joins once, the whole marketing team self-serves forever. And when you need the “why,” not just the “what” — that’s the Senior Analyst, answering in Slack, Claude, or ChatGPT. Leading the team, not building the reports? See the executive view → /solutions/cmo
Marketing teams that stopped reporting platform numbers and started proving results
Connect your ad platforms, build your first cross-platform Data Mart, and self-serve in Google Sheets — in under 15 minutes. No SQL. No analyst required.
Walk through the platform with a data strategist. See how your ad data flows from connectors to warehouse to Sheets — with your actual platforms.