How to connect BigQuery to Google Sheets: three ways
There are three ways to get BigQuery data into Google Sheets: save query results from the console once, connect a table with Connected Sheets, or publish the query as a Data Mart and deliver it to a sheet on a schedule. This guide walks through each and says which one fits a one-off look, a self-serve analysis and a recurring report.

There are three ways to get BigQuery data into Google Sheets, and they suit different jobs:
| Way | Best for | Refreshes | Who writes the SQL |
|---|---|---|---|
| Save results from the BigQuery console | a one-off look | no | whoever runs it |
| Connected Sheets | exploring a table from a spreadsheet | manually or on a schedule | the spreadsheet user, or none |
| A scheduled report from a Data Mart | a recurring report many people read | on a schedule | the analyst, once |
If you need the numbers once, the first takes a minute. If the sheet has to stay current and other people rely on it, the choice is between the second and the third, and it turns on who owns the query.
Note: Originally published in August 2023. Fully rewritten in October 2026: every step follows Google’s and OWOX’s current documentation.
Way 1: save query results to Google Sheets
Way 1: save query results to Google Sheets
The BigQuery console can write a result straight into a new spreadsheet. From Google’s export query results page (checked October 2026):
- Open BigQuery in the Google Cloud console and run your query.
- When the results appear, click Save results and choose Google Sheets.
- The first time, allow BigQuery to write to your Google Drive.
The result lands in a new spreadsheet in your Drive. It is a copy: it does not refresh, and the next person who needs newer numbers runs the query again. That is fine for a quick answer and a poor base for anything recurring.
Google notes two limits: this works only from the console, not from the bq tool or the API, and an error when opening the sheet usually means your account needs Drive SDK access to Google Workspace.
Way 2: Connected Sheets
Connected Sheets is Google’s own connector inside Google Sheets. It runs queries on BigQuery on your behalf, manually or on a schedule, and keeps the results in the spreadsheet. From Google’s Connected Sheets guide:
- In Google Sheets, open Data, then Data connectors, then Connect to BigQuery.
- Choose a Google Cloud project.
- Choose a table or view, from your projects or from public datasets.
- Click Connect.
You then work with the table through pivot tables, charts, extracts and calculated columns that run as BigQuery queries, so a sheet can analyse far more rows than it could hold.
What you need: access to Google Cloud and BigQuery, and a project with billing. The queries run in that project and are billed there. Access through Connected Sheets is recorded in Cloud Audit Logs, and you cannot change BigQuery data from the sheet.
It fits people who are comfortable picking tables and building their own analysis. Every person who connects also decides which table to use and how to aggregate it, so two sheets built on the same data can still disagree.
OWOX Data Marts
See your first report built in real time. 15 minutes.
- Connect your data warehouse
- Pick your metrics
- Get a live Google Sheets report
In the time it takes to write a ticket. Then imagine never writing that ticket again.
Book a DemoWe'll use your actual use case
Way 3: a scheduled report from a Data Mart
Way 3: a scheduled report from a Data Mart
The third way puts one step between BigQuery and the spreadsheet: the analyst publishes the query once as a Data Mart in OWOX Data Marts, and Sheets receives that. The spreadsheet user needs no SQL and no BigQuery access, and the analyst writes the query once instead of once per request.
There are two ways to deliver a Data Mart to Sheets: a scheduled report, set up by the analyst, and the Google Sheets extension, used by the business user. Both read the same Data Marts.
Step 1: connect BigQuery
In your OWOX Data Marts project, open Storages, click New Storage and choose Google BigQuery. The setup guide lists what to fill in:
- Project ID: the Google Cloud project that will run the queries. BigQuery usage is billed to this project.
- Location: the data location, such as US or EU.
- Authentication: a service account JSON key, or your Google account through OAuth. Either way the account needs the BigQuery Data Editor and BigQuery Job User roles. For a service account, the guide recommends a dedicated one with least-privilege access.
Step 2: create the Data Mart
A Data Mart can be your own SQL, an existing table or view, or data that an OWOX connector loads into BigQuery. For a channel report, the SQL might be:
SELECT
  order_date,
  channel,
  COUNT(DISTINCT order_id) AS orders,
  SUM(amount) AS revenue
FROM mydataset.orders
WHERE order_date >= DATE_SUB(
    CURRENT_DATE(), INTERVAL 90 DAY)
  AND status = 'paid'
GROUP BY order_date, channel;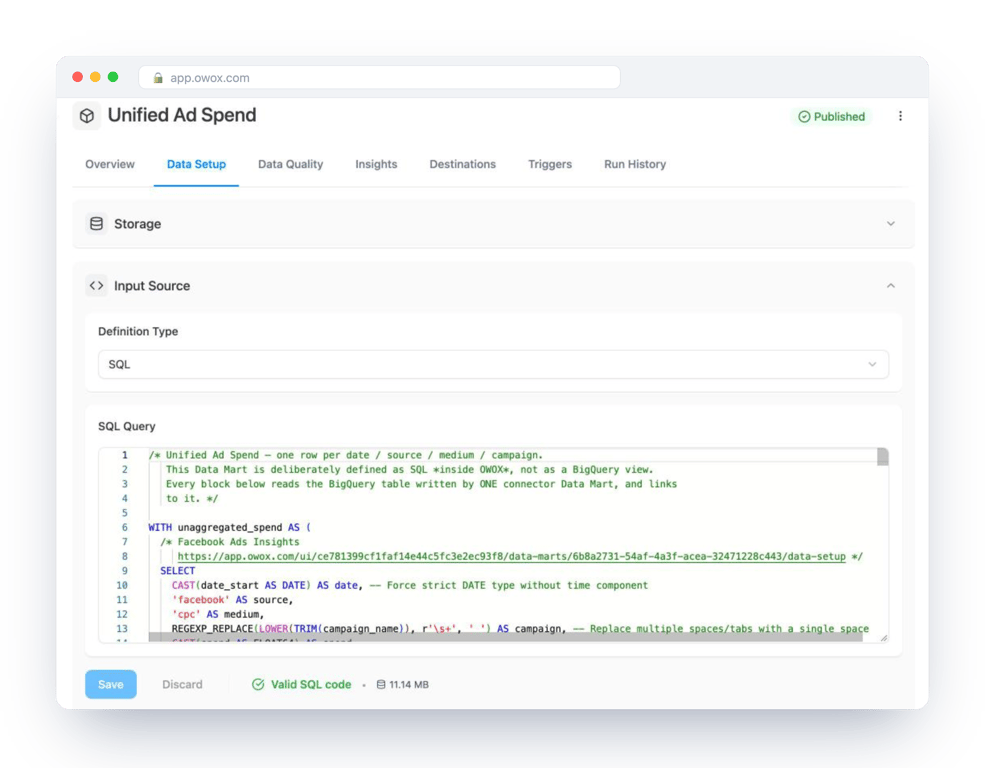
OWOX Data Marts runs this SQL as written, in your BigQuery project. It does not transform the data; the logic is yours. Write the filter on the partition column of a partitioned table and each scheduled run scans only what it needs.
Step 3: describe the output
Once the Data Mart is published, its Output Schema lists every column. Give each a business-friendly alias and a description. The descriptions travel into Google Sheets as notes on the header cells, so a reader can see what “revenue” includes without asking.
Step 4: deliver it to Google Sheets
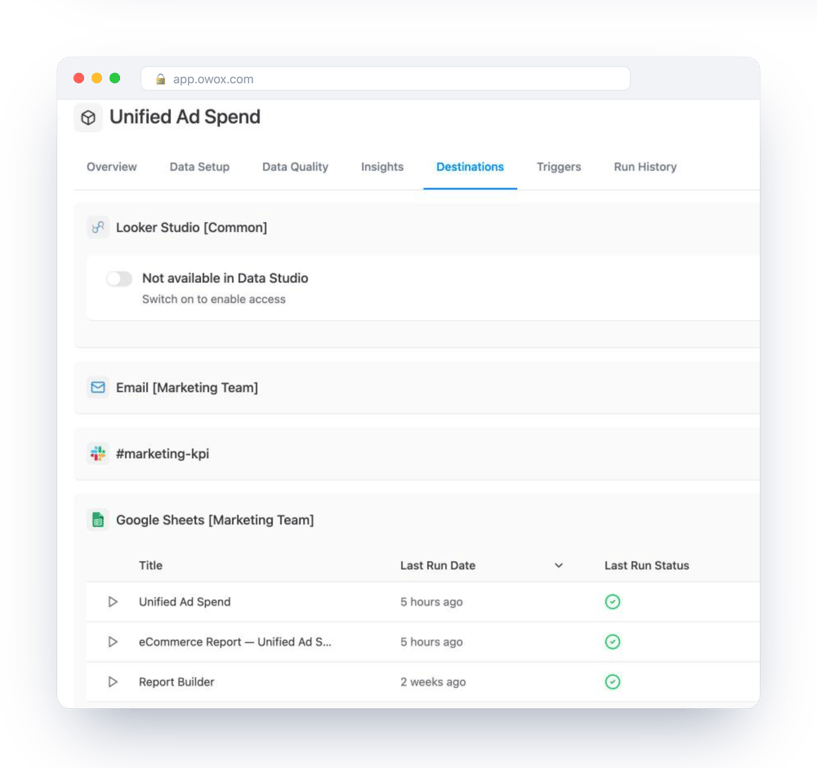
Add Google Sheets as a destination once, with Google OAuth or a service account key. Then, on the Data Mart’s Destinations tab, create a report: the spreadsheet and tab to fill, and the columns to include.
When the report runs, the rows are written into the sheet. Headers and data in the imported range are replaced on each refresh. Columns you add to the right are left alone, and a formula in row 2 is filled down to the new rows, so the reader’s own calculations survive the refresh. Where formulas, totals and lookups can sit so they survive is covered in why a scheduled refresh keeps wiping Google Sheets formulas.
Step 5: schedule it
On the Triggers tab, add a report run trigger: daily, weekly or at an interval, in the time zone you choose. Each run executes the query in BigQuery and rewrites the sheet, and Run History lists every run with its status.
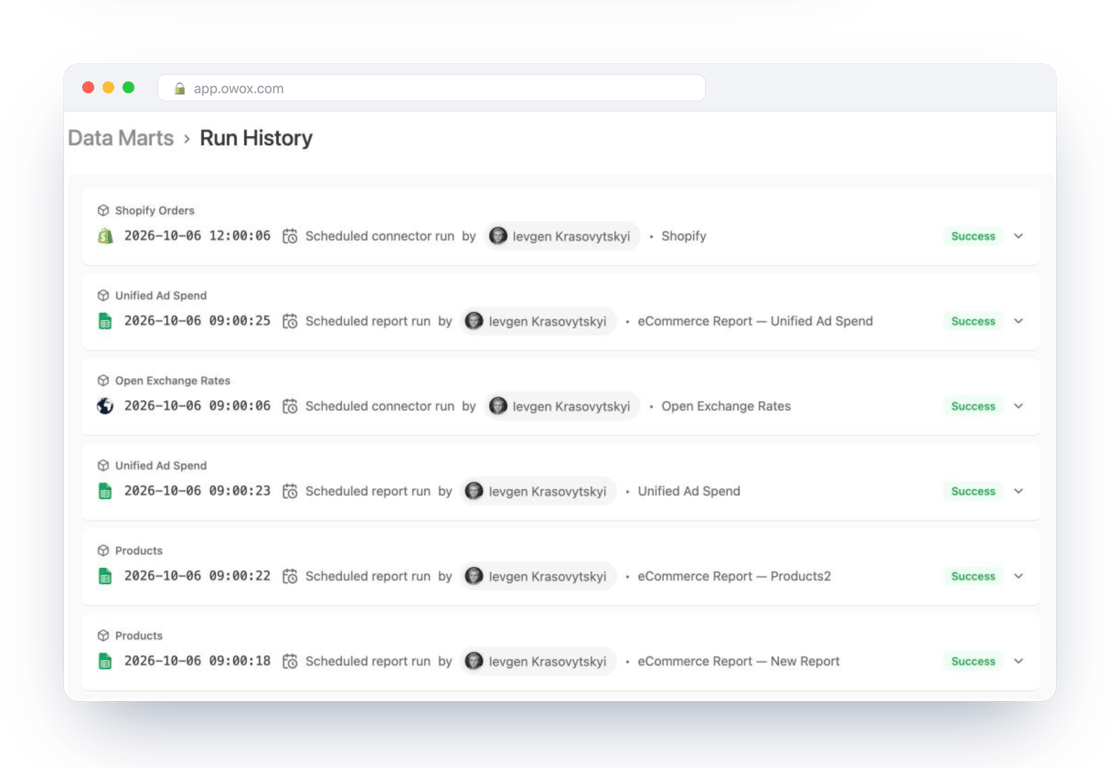
Then share the spreadsheet as usual. The readers get current numbers and never touch BigQuery.
For business users: the Google Sheets extension
A scheduled report answers the questions someone predicted. For the others, the OWOX Data Marts extension lets business users on OWOX Cloud pull a Data Mart into the current sheet themselves: choose a Data Mart, pick columns, add filters and sorting, and run it. Only Data Marts the analyst marked Available for reporting appear. If the analyst has declared how two Data Marts join, their columns show up together in one list. More in spreadsheet reporting.
Which way to choose
- One answer, now: save the results. Do not build on the copy.
- An analyst exploring a big table in a spreadsheet: Connected Sheets.
- A report that several people open every week: a scheduled report from a Data Mart, so the query and the refresh live in one place and every copy of the sheet agrees.
- Business users asking new questions of approved data: the extension, on the same Data Marts.
Many teams use more than one. The cost of each is the queries it runs in BigQuery: a scheduled report is one query per run, however many people read the sheet. See BigQuery pricing for how those queries are billed.
Going the other way: Sheets to BigQuery
Going the other way: Sheets to BigQuery
To load a spreadsheet into BigQuery as a table, see how to connect Google Sheets to BigQuery.
Before you start
- A Google Cloud project with BigQuery and billing set up.
- A Google account with access to Google Sheets.
- For the third way, an OWOX Data Marts project and the roles above for the account that connects BigQuery.
Turn your data into decisions.
Governed data marts give you the clean foundation ML needs to actually work.
- No AI hallucinations
- Analyst-governed definitions
- Every number traces to SQL
Frequently Asked Questions
Which way of connecting BigQuery to Google Sheets should I use?
Save results for a one-off look. Connected Sheets for someone exploring a table in a spreadsheet. A scheduled report from a Data Mart for a recurring report that several people read, so the query and the refresh live in one place.
How do I save BigQuery query results to Google Sheets?
In the BigQuery console, run the query, click Save results and choose Google Sheets. The result is written to a new spreadsheet in your Drive. It does not refresh, and this option is not available from the bq tool or the API.
How do I refresh BigQuery data in Google Sheets automatically?
Connected Sheets can refresh on a schedule. With OWOX Data Marts, a report run trigger on the Data Mart rewrites the sheet daily, weekly or at an interval in the time zone you choose, and Run History lists every run.
How do I connect BigQuery to Google Sheets?
Three ways: save query results to Google Sheets from the BigQuery console, which makes a one-off copy; connect a table with Connected Sheets under Data, Data connectors, Connect to BigQuery; or publish the query as a Data Mart in OWOX Data Marts and deliver it to a sheet with a scheduled report.
How do I install the OWOX Data Marts extension for Google Sheets?
Install OWOX Data Marts from the Google Workspace Marketplace; it then appears under Extensions in Google Sheets. It lists only the Data Marts that an analyst has marked Available for reporting.
What is Connected Sheets?
Google's BigQuery connector inside Google Sheets. It runs queries on BigQuery on your behalf, manually or on a schedule, and keeps the results in the spreadsheet, so you can analyse tables far larger than a sheet holds. You need BigQuery access and a project with billing.