Clinic Attribution Data Model: From Ad Click to Paid Visit on One Identity
You have been asked which advertising brings patients the clinic is actually paid for, not clicks or form fills. This guide gives the marketing or data lead at a clinic the model that answers it: one identity minted at the first page view and kept until the insurer pays; fourteen tables and their keys; the three distinctions that move the numbers (a person is not a browser, an enquiry is not a qualified enquiry, an invoice is not money); what three years of the model's demo data show for each; how to keep patient data out of the reporting layer; one definition per metric, a worked example you can run, a free model to start from, and a note to forward to whoever asked.
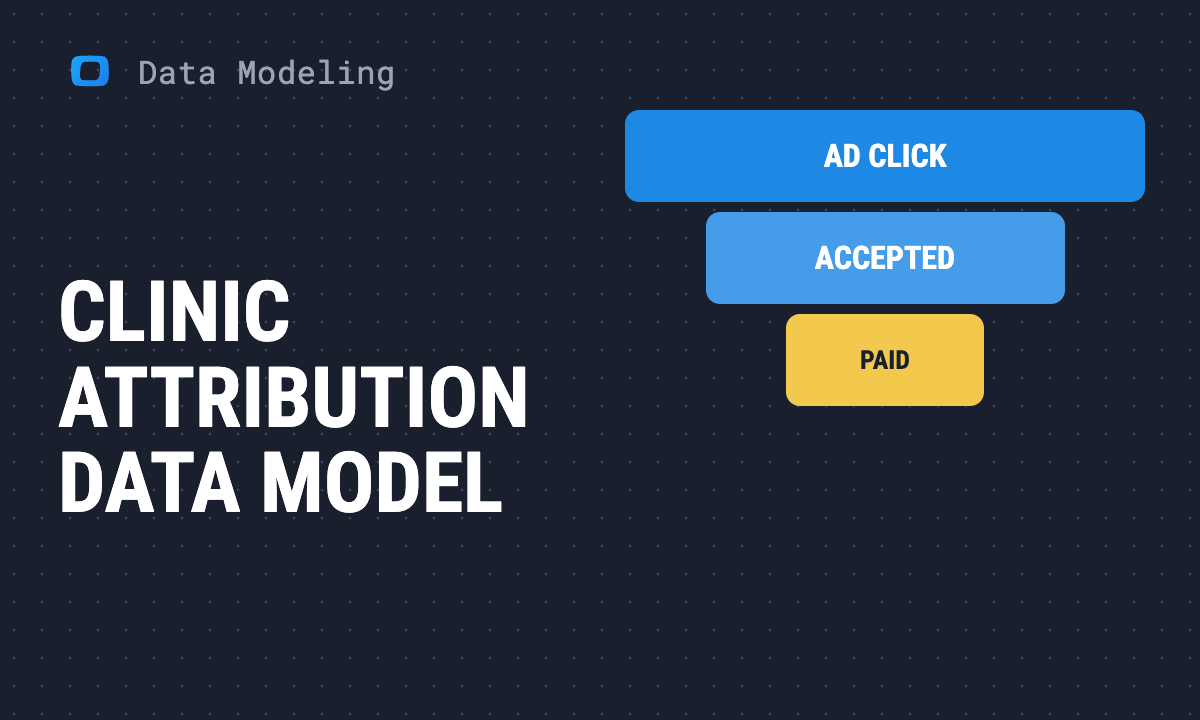
“Which ads bring us patients we actually get paid for?” Ad platforms answer with clicks and conversions, the CRM with enquiries, billing with invoices, and none of the three shares a key with the others. The answer needs one identity, minted at a person’s first page view and kept until the insurer’s payment lands, with every click, visit, call, form, consultation, treatment, bill and payment hanging off it. Then a payment received in March can be traced to the ad that first brought that person in, even if the ad ran in January of the year before.
In the demo data behind the free Clinic Attribution data model, three years of one practice’s trade, the median patient took 35 days from their first page view to their first bill, and one in ten took more than 700. Four in five were first billed in a different calendar month from the one they first arrived in. A report that matches ad spend to revenue within the same month credits the wrong campaigns.
This guide is about the model, not about attribution methods in general: the tables, the keys, and three distinctions that decide whether the answer is right. If you are the practice manager or owner who asked, the last section is a note for you.
Patient data comes first
This model holds names, phone numbers and email addresses on the enquiry and on the paying patient, next to the advertising that brought them. That makes it health data. In the US, HIPAA covered entities have the Office for Civil Rights’ bulletin on online tracking technologies to read, including the note at its top: on June 20, 2024 a federal court vacated part of it, the part about connecting an IP address with a visit to an unauthenticated public page about health conditions or providers. The rest of the bulletin remains, including that disclosing protected health information to tracking vendors for marketing without the patient’s authorisation is not permitted. In the EU, data concerning health is a special category under the GDPR. What applies to your practice is for your compliance lead or data protection officer to say, and they should sign off before any patient-level row reaches the warehouse.
Four design choices follow, the same ones the clinic network data model makes:
- Keep names and contact details in the enquiry and patient tables only, readable by the people who already handle patient records. Reports join on
person_idandcustomer_id, never on a name or a phone number. - Report treatments by type, not by person, and suppress small cells: a campaign, a treatment and a month can come down to one patient.
- Send ad platforms no patient-level conversions. The model joins advertising to outcomes inside your warehouse; nothing in it needs to travel back to the platform.
- Give an AI assistant aggregated Data Marts only, with no person or patient key, and only after your compliance lead has agreed.
The model on one page
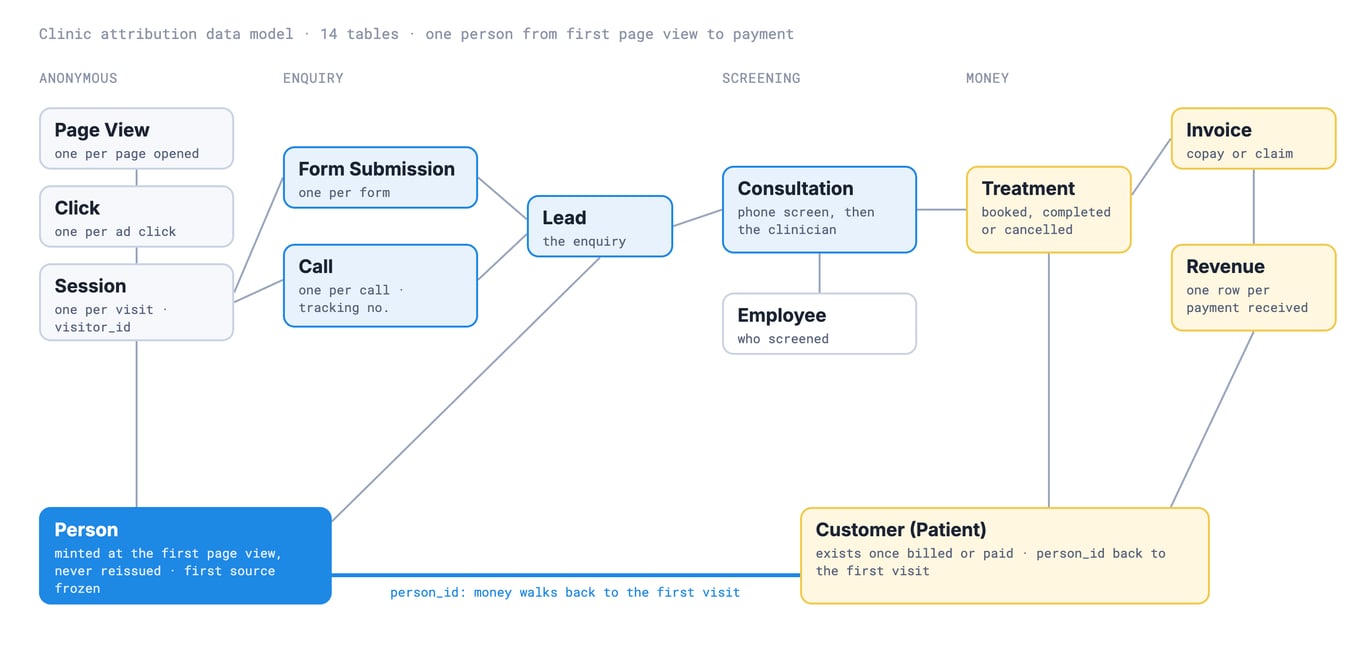
Fourteen tables, read left to right as the journey runs. Start each table’s description with its grain and make the grain the primary key:
| Table | One row per | Primary key |
|---|---|---|
person |
human, across every device and browser | person_id |
session |
website visit | session_id |
page |
page of the site | page_id |
page_view |
page opened in a visit | page_view_id |
click |
ad click, on any platform | click_id |
form_submission |
web form sent | form_submission_id |
call |
phone call, in or out | call_id |
lead |
enquiry in the CRM | lead_id |
employee |
member of staff | employee_id |
consultation |
screening: the phone screen or the clinician’s consultation | consultation_id |
treatment |
booked treatment | treatment_id |
customer_patient |
patient who has been billed or has paid | customer_id |
invoice |
bill: the patient’s copay or the insurer’s claim | invoice_id |
revenue |
payment received | revenue_id |
The chain is held together by person_id. Sessions, page views and clicks carry it from the first page view. The enquiry carries it when the form or call can be matched to a visit. The paying patient carries it, so money can walk back through customer_patient to person and to the source, medium and campaign frozen on that person’s first visit.
What the model leaves out, so nobody goes looking: advertising cost (so no cost per patient or return on ad spend until you add a spend table), insurance claims as objects of their own, more than one location, clinician capacity, and a coded procedure catalogue.
OWOX Data Marts
See your first report built in real time. 15 minutes.
- Connect your data warehouse
- Pick your metrics
- Get a live Google Sheets report
In the time it takes to write a ticket. Then imagine never writing that ticket again.
Book a DemoWe'll use your actual use case
A person is not a browser
session carries two identities. visitor_id is the browser’s, the Google Analytics client_id: a new phone, a cleared cookie or a second browser makes a new one. person_id sits above it, several browsers resolved to one human. Counting visitors counts devices; counting people counts prospective patients.
In the demo data, 84,000 people visited the site under 121,409 browser ids. Among the practice’s patients, everyone who was billed or paid, 64% used more than one browser, 1.86 on average, over 8.5 visits. Credit a payment to the first visit of the browser that sent the form, and for most paying patients you credit a visit in the middle of the journey, not the one that started it. The worked example below shows the three answers one patient can produce.
Check that the first touch came before the enquiry
The person record freezes first_source, first_medium and first_campaign from the first visit the site recorded. That is only a first touch if the visit came before the person got in touch. In the demo data, 1,217 of 4,164 patients, 29%, gave their details before their first recorded visit: they rang first and used the site afterwards. Their “first touch” is a visit made after they had already enquired. Report them as their own row, credited to the call and its tracking number, not to whatever brought them to the site later. The test is one comparison: person.first_seen_at <= person.identified_at.
Clicks and calls that never become visits
Two kinds of demand never show up in a visit-based report:
- Clicks with no visit. In the demo data 15% of ad clicks have no
session_id: the page failed, tracking was blocked, or the person went straight back. They were paid for. Dropping them makes paid channels look cheaper than they are. - Calls. 80% of the demo practice’s enquiries began with a phone call, and 14% of all enquiries came from people never seen on the site, who dialled a number from a leaflet, a sign or a recommendation. A report built on web forms sees one enquiry in five.
call.tracking_numberis the only attribution a caller with no web history has, so publish a different number per place it appears.
One guard on the platform click ids (gclid, fbclid, msclkid, ttclid): treat a value shorter than ten characters as absent. Below that what turns up is undefined, null and truncated fragments, and they inflate whichever channel they land in. In the demo data 7.8% of clicks have a click id that is missing or fails the guard.
Which channel gets the credit
With one identity, the same payments can be credited to the channel of the person’s first visit or to the visit in which they enquired. Here is the demo practice’s revenue both ways, for the patients whose first recorded visit came before their enquiry:
| First channel | Revenue, credited to the first visit | Credited to the visit before the enquiry | Difference |
|---|---|---|---|
| Paid search | $450,354 | $334,697 | +35% |
| Organic search | $417,266 | $474,221 | −12% |
| Google Business Profile | $387,399 | $239,565 | +62% |
| Direct | $302,374 | $525,119 | −42% |
| Referral sites | $151,328 | $111,454 | +36% |
| Paid social | $132,363 | $115,131 | +15% |
| AI assistants | $32,841 | $30,632 | +7% |
| Organic social | $23,882 | $29,788 | −20% |
| $20,212 | $57,414 | −65% |
Demo data: owox-demo.healthcare_clinic_attribution, synthetic, payments received November 2023 to November 2026, run on 2026-11-02. AI assistants groups chatgpt.com, perplexity.ai and gemini.google.com referrals.
Paid search, the Google Business Profile and referral sites start more paid journeys than they finish; direct visits and email finish more than they start. Neither column is wrong. The first answers “what brings people in”, the second “what brings them back to book”. A budget cut made on the second column would cut the channels that create demand and keep the ones that collect it. Show both, and name which one each report uses.
This model has no ad spend, so it stops at revenue per channel. Cost per patient needs a spend table by day, platform and campaign, joined on the campaign name the clicks carry.
An enquiry is not a qualified enquiry
An enquiry is not a qualified enquiry
The CRM has an is_qualified field on the enquiry, and in this model it is empty on every row, by design: at the moment of a form or a call nobody has decided anything. The verdict lives in consultation, one row per screen, in two steps: a phone screen by reception or a practice manager (Pre-Consultation), then the clinician’s consultation (Consultation). A report that reads the enquiry’s empty field as “not qualified” counts every enquiry as a failure. In the demo data that is all 17,139 of them.
Acceptance is then read per enquiry with a verdict: enquiries a clinician accepted ÷ enquiries screened. By the channel of the person’s first visit:
| First channel | Enquiries | Screened | Accepted by a clinician | Acceptance |
|---|---|---|---|---|
| Direct | 3,346 | 2,192 | 1,153 | 52.6% |
| Organic search | 3,164 | 1,846 | 996 | 54.0% |
| Paid search | 2,777 | 1,305 | 709 | 54.3% |
| Google Business Profile | 2,703 | 1,440 | 748 | 51.9% |
| Paid social | 1,412 | 692 | 270 | 39.0% |
| Referral sites | 864 | 413 | 223 | 54.0% |
Demo data, three years to 2026-11-01, run on 2026-11-02. Smaller channels left out.
Paid social brings enquiries a clinician turns away far more often. The model says why, because each refusal carries disqualification_reason: counted per screen, 45% of paid social’s refusals were “expectations do not match the service”, against 12% for every other channel combined. That is fixed in the ad’s promise, not at reception.
Two more gaps sit between a “yes” and money. A qualified person can still not book, and a booking can be cancelled: 11.5% of the demo practice’s decided bookings were cancelled rather than delivered. Count bookings and cancellations, not only verdicts.
An invoice is not money
A treatment is billed in two parts. The patient’s copay is billed at booking and collected before the treatment, so it is money straight away. The insurer’s share is claimed after the treatment and becomes money only when the insurer pays. invoice records what was asked for; revenue records what arrived, one row per payment, joined to the invoice it settles.
In the demo practice’s three years:
- $3.49M billed, $2.70M received. A report on invoices overstates income by the difference.
- Copays were 30% of the value billed, paid on the day they were billed (median 0 days).
- Insurers paid a median of 28 days after the bill, and one payment in ten took more than 44. Revenue belongs to the date it arrived, so a treatment in March can be April’s money.
- 4.9% of the value claimed from insurers was written off. A written-off claim is delivered work that earned nothing, and it belongs in the channel’s result, not out of it.
- $228,447 was still outstanding on open and part-paid bills at the end of the period.
Credit to a channel is the sum of a patient’s payments, and the demo practice’s patients had 2.8 treatments each. So a campaign’s revenue grows for years after it ran, and its recent months always read low. Read it by cohort of first visit, not by calendar month of payment.
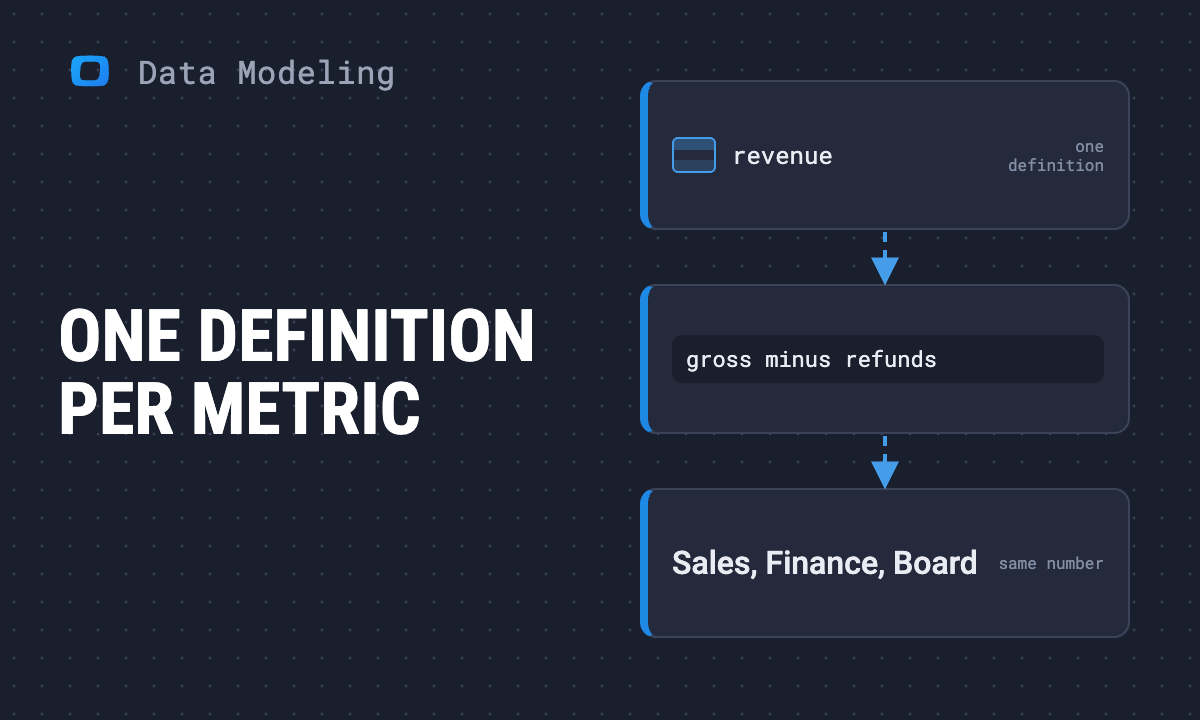
One definition per metric
Revenue has accounting rules behind it. What counts as a qualified enquiry, a new patient or a channel’s revenue does not, so write each one down once:
| Metric | Definition | Reads |
|---|---|---|
| People reached | Distinct person_id with a first visit in the period |
person |
| Enquiries | Distinct leads created in the period, forms and calls together | lead |
| Untraceable enquiries | Leads with no person_id; reported, not dropped |
lead |
| Enquiries screened | Distinct leads with at least one verdict | consultation |
| Acceptance rate | Leads a clinician accepted ÷ leads screened | consultation |
| Cancellation rate | Cancelled ÷ (completed + cancelled) bookings | treatment |
| Billed | Invoice amounts by issued_at |
invoice |
| Revenue | Payments by received_at |
revenue |
| Insurer days to payment | Median days from bill to insurer payment, by received_at; the model’s calculated field gives the average, so show it beside the median |
revenue |
| Insurer write-off share | Written-off claims ÷ all claims, by issue date; last three months provisional | invoice |
| Channel revenue | Payments credited through patient → person to the person’s first visit, with the enquiry visit’s channel shown beside it | revenue, customer_patient, person |
| Time to first payment | became_customer_at − first_seen_at |
customer_patient, person |
Three choices move numbers most:
- First visit or enquiry visit. The table above moves Google Business Profile’s credit by 62%. Pick one for the headline and show the other.
- What counts as qualified. Passing the phone screen is not acceptance; only the clinician’s “yes” is.
- When revenue counts. On the payment date, not the treatment date or the bill date.
A worked example you can run
One person, two devices, three visits, one enquiry, $360 received. Literal rows, so the query runs in any BigQuery project as written. P1 clicks a Facebook ad on a phone on 5 January, comes back on a laptop through Google search two weeks later, and on 2 February types the address on the same laptop and sends the form. The copay and the insurer’s payment total $360.
WITH session AS (
  SELECT * FROM UNNEST([
    STRUCT('S1' AS session_id,
      'P1' AS person_id,
      'V1' AS visitor_id,
      TIMESTAMP '2026-01-05 12:10:00' AS started_at,
      'facebook' AS source,
      'paid_social' AS medium),
    ('S2', 'P1', 'V2', '2026-01-19 21:40:00',
      'google', 'organic'),
    ('S3', 'P1', 'V2', '2026-02-02 20:05:00',
      '(direct)', '(none)')
  ])
),
lead AS (
  SELECT 'L1' AS lead_id, 'P1' AS person_id,
    TIMESTAMP '2026-02-02 20:12:00' AS created_at
),
revenue AS (
  SELECT * FROM UNNEST([
    STRUCT('P1' AS person_id,
      'patient_copay' AS payment_source,
      60.00 AS amount),
    ('P1', 'insurance_reimbursement', 300.00)
  ])
),
paid AS (
  SELECT person_id, SUM(amount) AS amount
  FROM revenue GROUP BY 1
),
before_enquiry AS (
  SELECT s.*
  FROM session s
  JOIN lead l ON l.person_id = s.person_id
    AND s.started_at <= l.created_at
)
SELECT 'person, first touch' AS credited_by,
  ARRAY_AGG(CONCAT(source, ' / ', medium)
    ORDER BY started_at LIMIT 1)[OFFSET(0)] AS channel,
  ANY_VALUE(p.amount) AS revenue
FROM before_enquiry JOIN paid p USING (person_id)
UNION ALL
SELECT 'browser that enquired, first touch',
  ARRAY_AGG(CONCAT(source, ' / ', medium)
    ORDER BY started_at LIMIT 1)[OFFSET(0)],
  ANY_VALUE(p.amount)
FROM before_enquiry JOIN paid p USING (person_id)
WHERE visitor_id = 'V2'
UNION ALL
SELECT 'last visit before the enquiry',
  ARRAY_AGG(CONCAT(source, ' / ', medium)
    ORDER BY started_at DESC LIMIT 1)[OFFSET(0)],
  ANY_VALUE(p.amount)
FROM before_enquiry JOIN paid p USING (person_id)| Credited by | Channel | Revenue |
|---|---|---|
| person, first touch | facebook / paid_social | $360 |
| browser that enquired, first touch | google / organic | $360 |
| last visit before the enquiry | (direct) / (none) | $360 |
Same patient, same $360, three channels. The browser-level answer never sees the phone, so the Facebook ad that started the journey gets nothing. The enquiry-visit answer credits a typed address. Only the person-level answer reaches the ad, and it can only do that because the phone and the laptop were resolved to one person_id.
Start from a free model
OWOX publishes the free Clinic Attribution data model: 14 Data Marts for one practice, the tables above, with the joins declared and the metrics in this article defined as calculated fields (Enquiries Screened, Enquiry Acceptance Rate, Cancellation Rate, Insurer Days to Payment, Insurer Write-off Share, Revenue per Patient). The identity pattern it follows, one person across devices and years, was described for the model by the co-founder of APAS Cloud. It opens on OWOX Model Canvas, where you can edit it and export it as an OKF bundle; the definition is on GitHub.
Adapt three things before loading your own data:
- Add ad spend by day, platform and campaign, or cost per patient has no answer.
- Restrict the tables with names and contact details (
lead,customer_patient,employee) as above, before anything reads them. - For more than one location, start from the clinic network data model instead: it has locations, capacity and no-shows, and less of the identity chain. For a hospital with claims and denials, see the healthcare data model.
It describes a practice; it does not connect to your CRM, call tracking or billing system.
Where OWOX Data Marts fits, and what it does not do
Where OWOX Data Marts fits, and what it does not do
Everything above is warehouse SQL in BigQuery’s dialect, and ports to Snowflake, AWS Redshift, AWS Athena or Databricks with small changes; choose the warehouse region with your compliance lead. OWOX Data Marts takes on three parts:
- Getting the data in: built-in for the ad platforms, and a custom connector for a CRM, call-tracking or practice-management API. OWOX keeps no copy of it.
- Owning the definitions: each table becomes a Data Mart with its grain and primary key in one Model, each metric a calculated field, and quality checks catch a call or a payment loaded twice.
- Delivery: scheduled reports to Sheets; through OWOX MCP for Claude and ChatGPT, part of OWOX Data Marts Cloud, either assistant can query published Data Marts, and the rows returned are sent to that AI provider. Give an assistant aggregated Data Marts only.
What it does not do: it does not stitch browsers into people (your tracking does that and writes person_id), it does not decide which channel deserves the credit, and it does not make your practice compliant with anything.
For the person who asked
A note from the analyst to whoever asked which ads bring paying patients, ready to forward:
- I can show, every month, which channels bring people who enquire, which bring people a clinician accepts, and which bring money actually received, followed on one identity from the first visit to the insurer’s payment.
- It is slower than the ad platforms’ numbers, and that is the point. In our demo practice the median patient was first billed 35 days after first finding us, and four in five in a different month from the one they arrived in. Results by month will keep growing for months after.
- Phone calls are most of our demand. In the demo practice four enquiries in five began with a call, and one in seven came from someone never seen on the website. I will report those, not drop them.
- Two channel views, both honest. One credits the ad that first brought a patient, the other the visit in which they got in touch. I will show both side by side.
- Patient data stays restricted. Reports use coded ids, never names; nothing patient-level goes back to the ad platforms; our compliance lead signs off before we start.
- Decisions for you:
- Which view is the headline: the first visit, or the visit before the enquiry?
- Is a qualified enquiry one that passes the phone screen, or one a clinician accepts?
- How many months after a campaign do we wait before we judge it on revenue?
- Do we add ad spend to the model, so we can report cost per paying patient?
- Until you decide, I will headline the first visit and show the enquiry visit beside it, count only a clinician’s “yes” as qualified, judge campaigns on revenue received within twelve months of the first visit, report revenue on the date it arrived, and say so at the top of the report.
Turn your data into decisions.
Governed data marts give you the clean foundation ML needs to actually work.
- No AI hallucinations
- Analyst-governed definitions
- Every number traces to SQL