Free data model templates: open, edit, and export OKF
A blank modeling canvas is the hardest place to start. You know the tables are in there somewhere, but staring at an empty diagram while you second-guess grain, keys, and join paths is how an afternoon disappears.
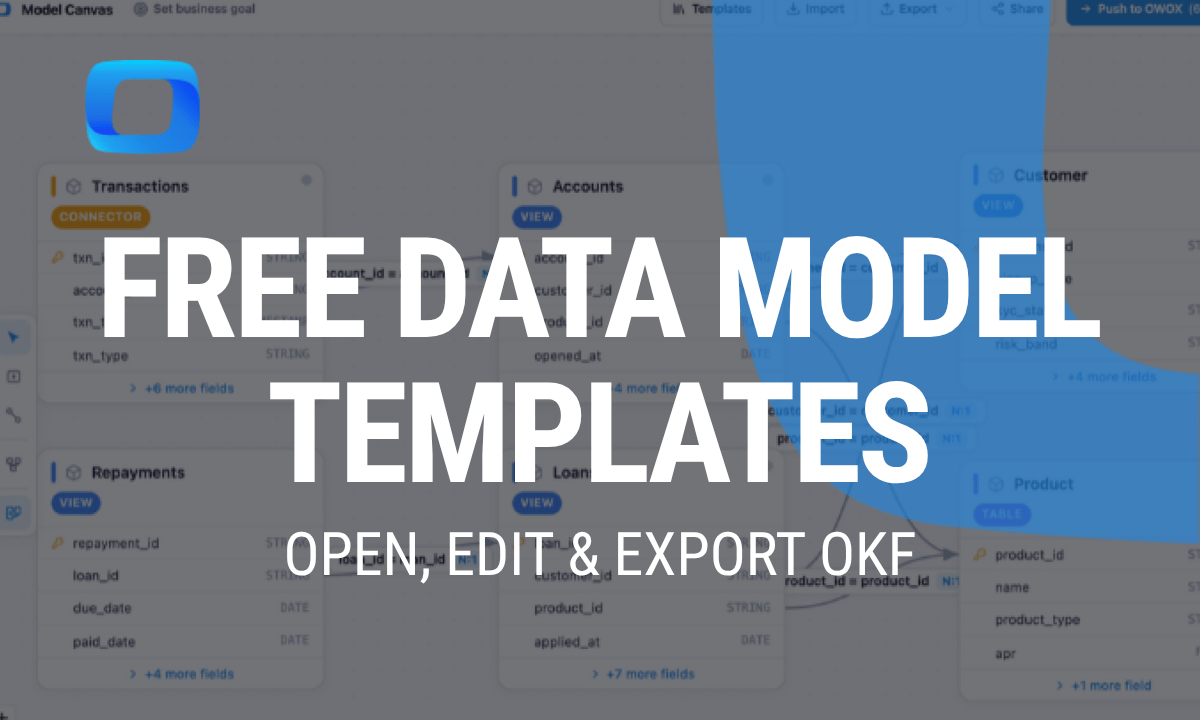
A data model template fixes that. It’s a ready-made set of tables (or data marts) and the relationships that join them, shaped like a real business so you can open it and adapt it instead of building from zero. This page collects nine free data model templates for real industries. Each one opens in your browser, edits like a diagram, and exports to OKF – Google’s open, portable format for data models. No sign-up, no install.
If you want the theory behind the practice first, our full guide to data modeling covers the fundamentals. Otherwise, let’s get into the templates.
What is a data model template?
What is a data model template?
A data model template is a pre-built data model you reuse as a starting point. Instead of an empty page, you get named tables, typed fields, primary and foreign keys, and the joins that connect everything – already laid out as an entity relationship diagram (ERD).
Think of the difference between a blank spreadsheet and one with the columns, formulas, and structure already in place. A blank diagram tells you nothing. A populated, business-ready model shows you a sensible shape you can argue with, trim, and extend.
What’s inside a template
Every template here includes the same building blocks you’d design by hand:
• Entities (tables / data marts) – the nouns of the business, like customers, orders, or sessions.
• Fields and types – the columns on each table, with data types.
• Primary and foreign keys – the identifiers that make rows unique and joinable.
• Relationships and grain – how tables connect, and what one row actually represents.
Starting from a template gives you three things fast: speed, a best-practice shape that someone has already thought through, and a shared vocabulary your team can react to in minutes. The benefits of data modeling compound when everyone is looking at the same picture instead of describing it in words.
Conceptual vs. logical vs. physical data models
Conceptual vs. logical vs. physical data models
Most “data model template” results online quietly assume one of three levels of detail, and they rarely tell you which. Knowing the difference saves you from grabbing the wrong kind of template.
A conceptual data model is the high-level map: the main entities and how they relate, with no fields or keys. A logical data model adds the detail – attributes, keys, and precise relationships – while staying independent of any specific database. A physical data model is the implementation: actual tables, column types, and indexes for a particular warehouse.
The templates on this page sit at the logical-to-physical level. They name tables, fields, keys, and joins, but stay database-agnostic, so you can adapt one to BigQuery, Snowflake, or anything else and export it when you’re ready. If you want to go deeper on the distinctions, see conceptual data modeling explained and logical vs. physical data models.
OWOX Data Marts
See your first report built in real time. 15 minutes.
- Connect your data warehouse
- Pick your metrics
- Get a live Google Sheets report
In the time it takes to write a ticket. Then imagine never writing that ticket again.
Book a DemoWe'll use your actual use case
Types of data models (and which these are)
Types of data models (and which these are)
“What are the four types of data models?” is one of the most-asked questions on this topic, and the answer depends on whether someone means levels of abstraction or structural styles.
By abstraction, the types are the three above: conceptual, logical, and physical. By structure, the common ones are relational (tables and keys), dimensional (star and snowflake schemas built from fact and dimension tables), document, and graph. For a fuller breakdown, our guide to the types of data models walks through each with examples.
These nine templates are relational and dimensional. Most follow a Kimball-style star – a central fact table surrounded by dimensions – because that shape answers business questions cleanly and powers reporting well. If that’s new to you, understanding star schema and dimensional data modeling are the two to read, and the three types of fact tables explains the grain choices behind each one.
The nine data model templates
Here’s the gallery. Each template is a working model you can open in the canvas, edit, and export – pick the one closest to your business and remix from there. Every model is built from data marts, the reporting-ready tables described in our approach to data marts.
E-commerce data model
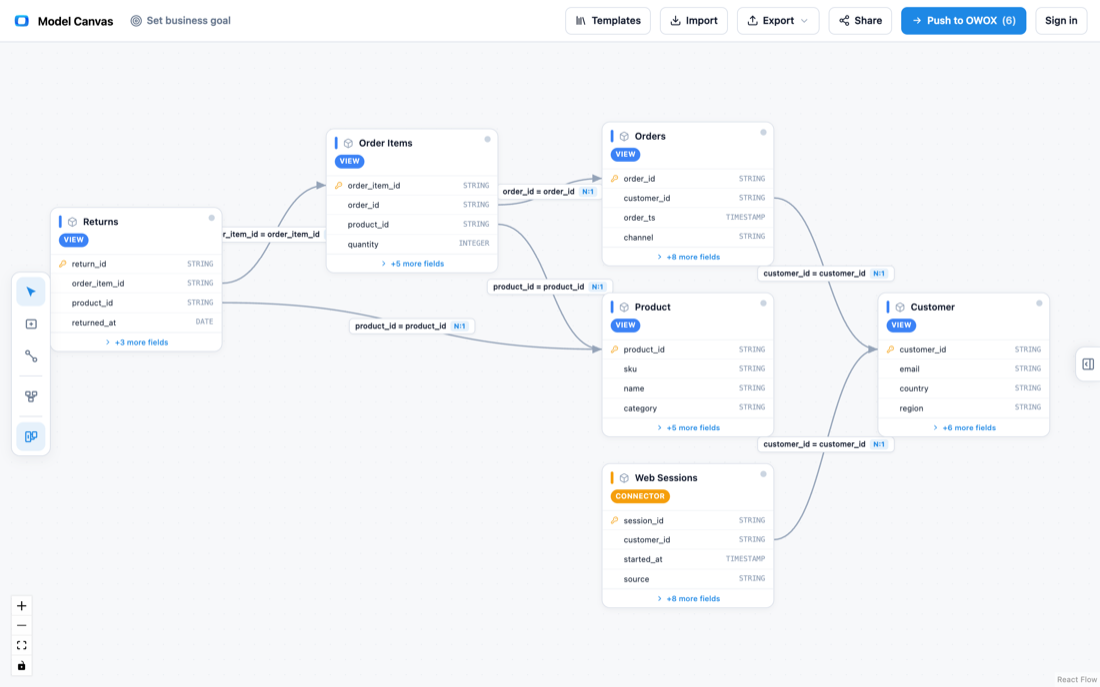
A Kimball-style sales star for online retail: Customers and Products as dimensions, with Orders, Order Items (where true line margin lives), Web Sessions, and Returns as facts. It answers line margin by category, repeat-buyer rate by acquisition channel, and return rate by product.
SaaS data model
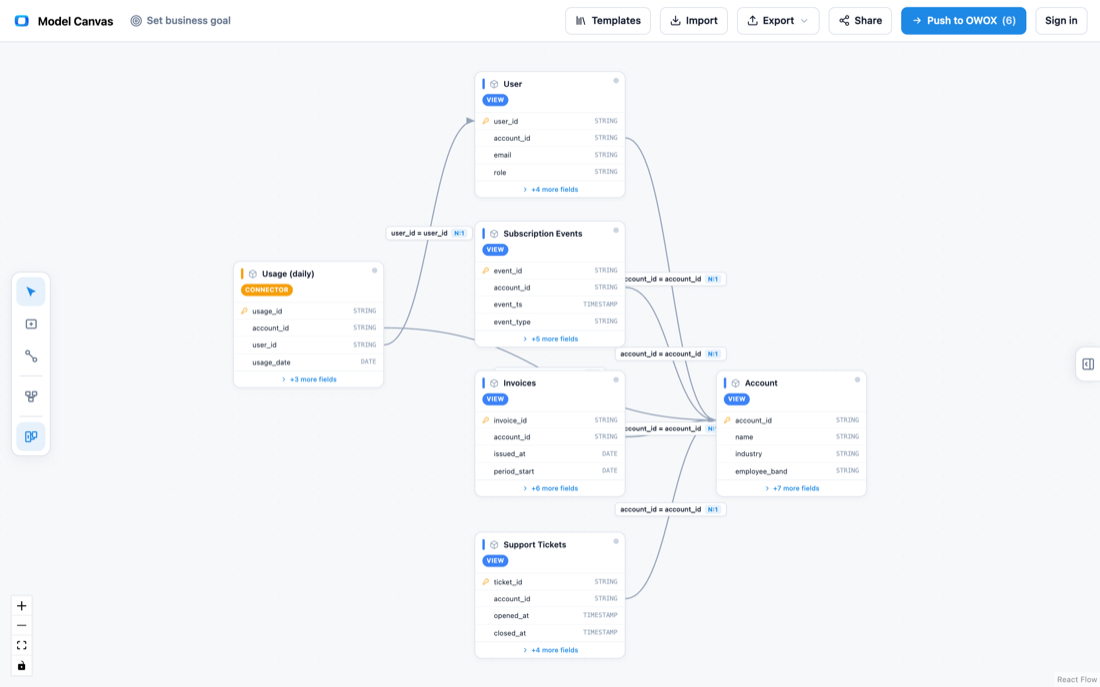
Recurring revenue, built around Subscription Events – one row per MRR movement (new, expansion, contraction, churn) – plus Accounts, Users, Invoices, daily Usage, and Support Tickets. It reconstructs the MRR waterfall and feeds net and gross revenue retention.
Marketplace data model
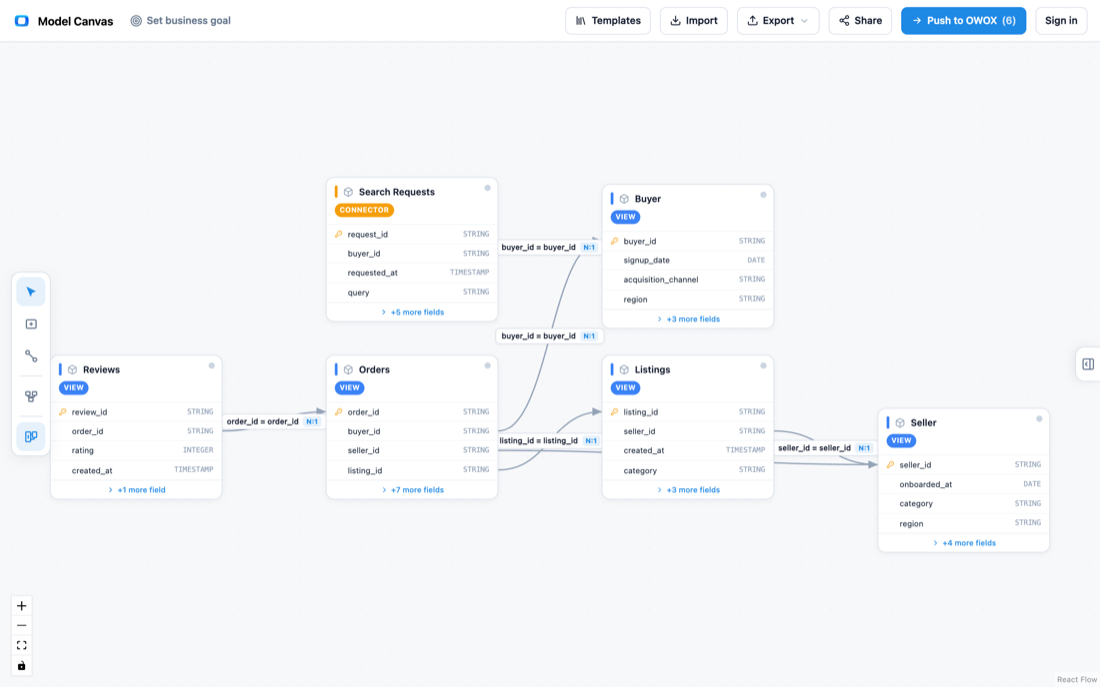
A two-sided platform where supply and demand meet at the order: Buyers, Sellers, Listings, Search Requests, Orders (GMV and take-rate), and Reviews. It answers liquidity (search-to-order conversion), take-rate by category, and time-to-match.
Marketing and lead-gen data model
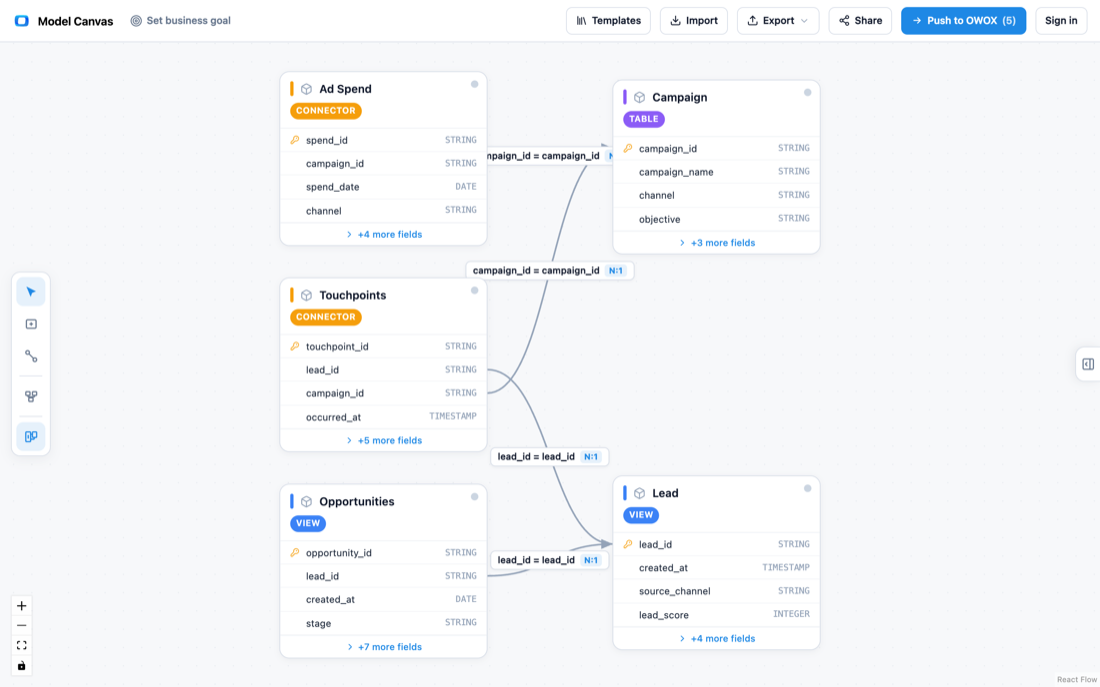
The spend-to-pipeline funnel for B2B: Campaigns, Ad Spend, Leads, Touchpoints, and Opportunities (MQL to SQL to Won). It ties channel cost to closed revenue without forcing a single rigid credit rule.
Mobile and gaming data model
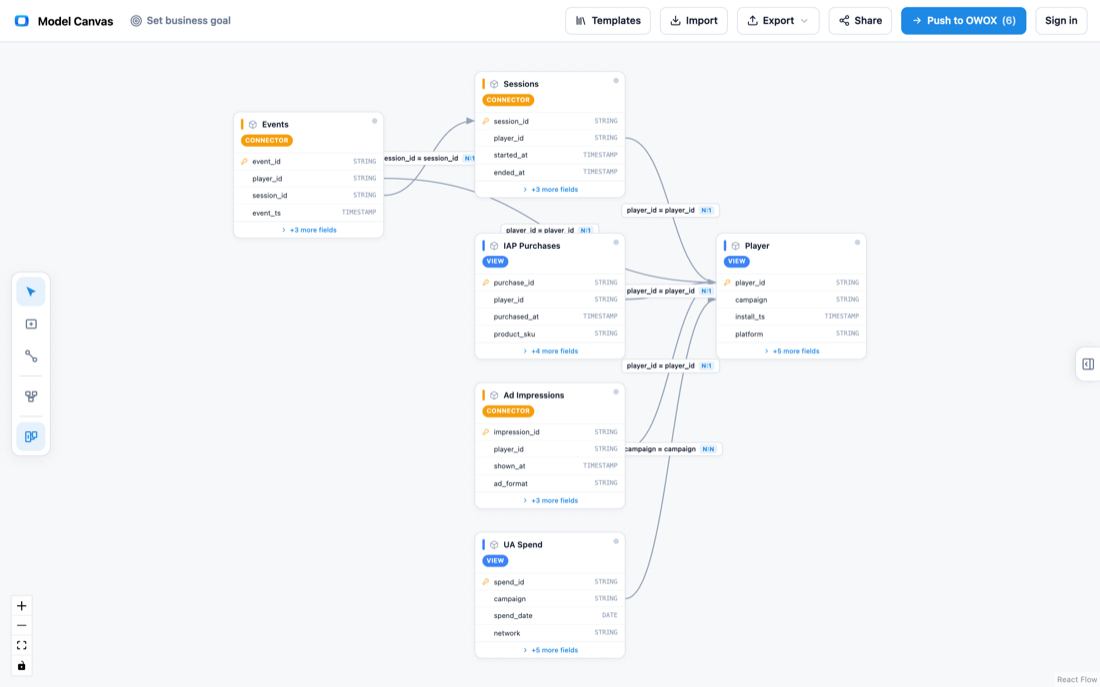
Free-to-play telemetry: Players, Sessions, Events, IAP Purchases, Ad Impressions, and UA Spend. It covers D1/D7/D30 retention, ARPPU and payer conversion, ad ARPDAU, and ROAS by acquisition campaign.
Fintech data model
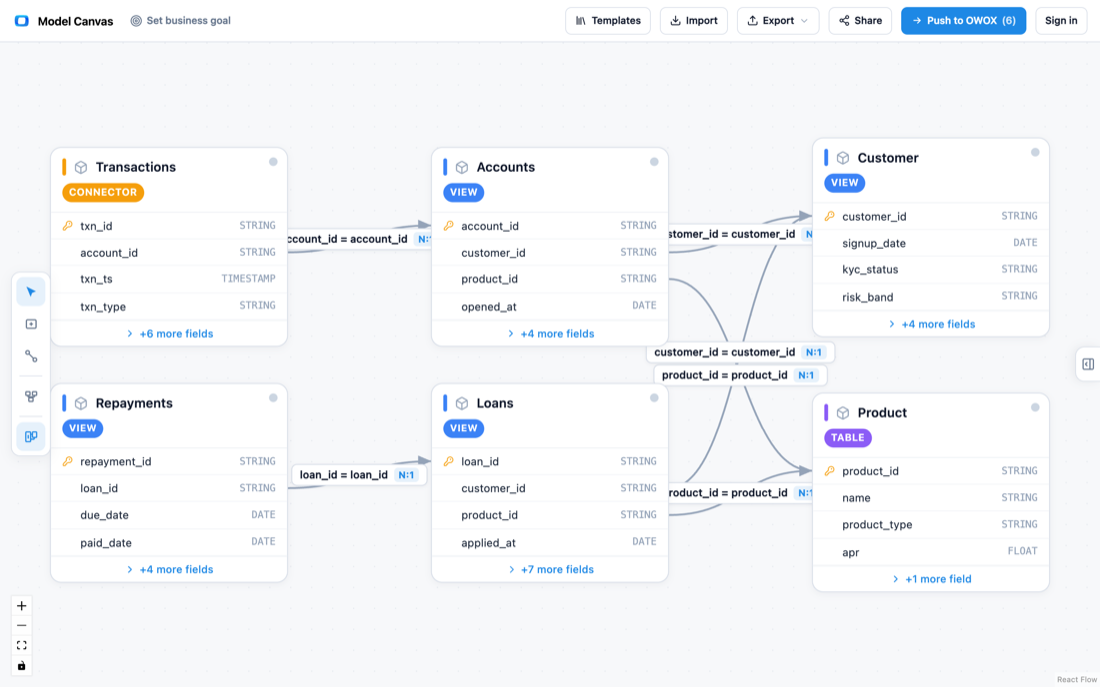
A neobank-plus-lending model with two fact streams: Customers (KYC and risk), Products, Accounts, Transactions (card and money movement), Loans (origination funnel), and Repayments (delinquency and charge-off). It answers funded rate, loan pull-through, and engagement.
Healthcare data model
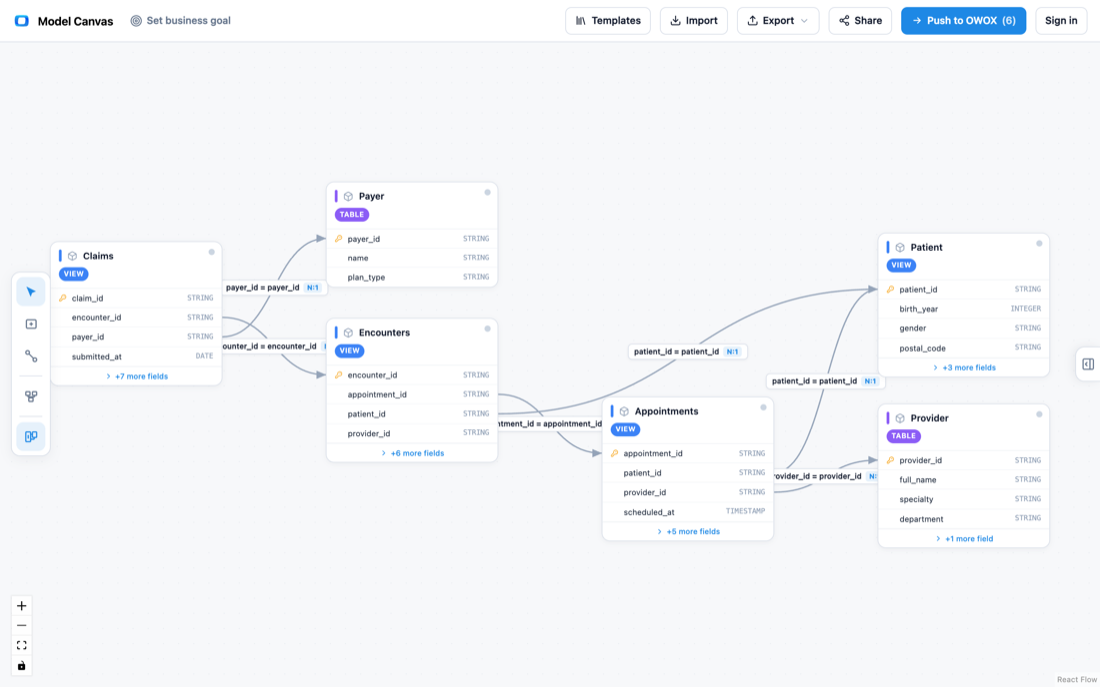
Provider operations and the revenue cycle: Patients, Providers, Payers, Appointments, Encounters (length-of-stay and readmission), and Claims (denials and AR days). It answers no-show rate, readmission, and denial rate by payer.
Bitcoin data model (public BigQuery dataset)
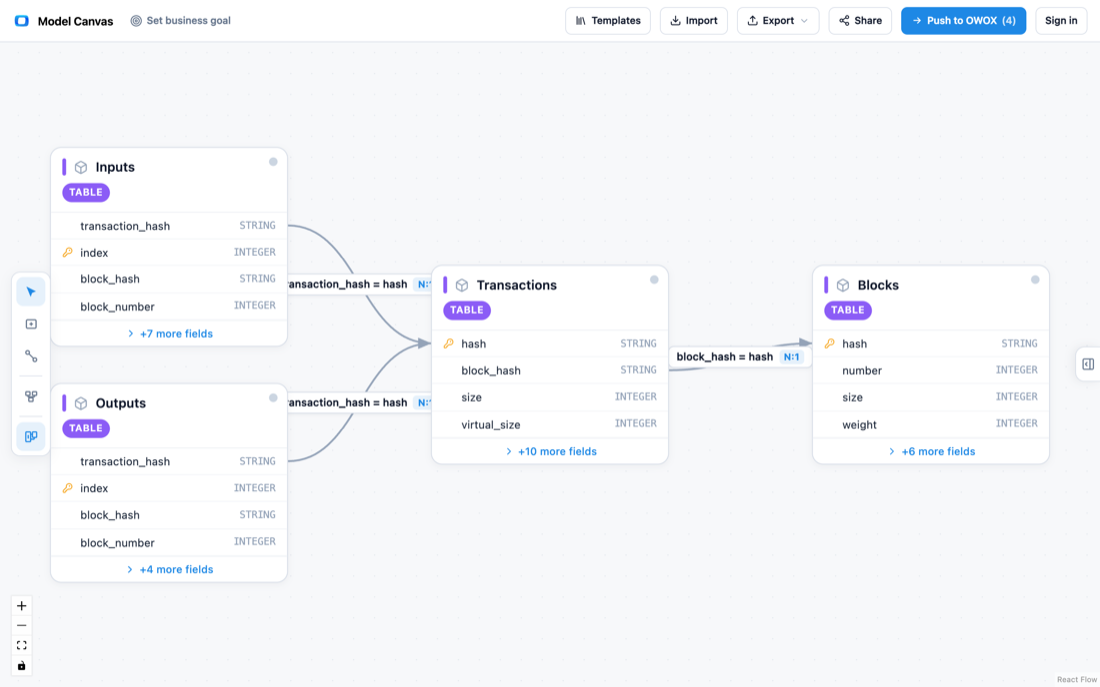
The public Bitcoin BigQuery dataset, modeled cleanly: Blocks, Transactions, Inputs, and Outputs – the UTXO flow, ready to explore. A good way to see how a real public dataset looks as a navigable model.
Stack Overflow data model (public BigQuery dataset)
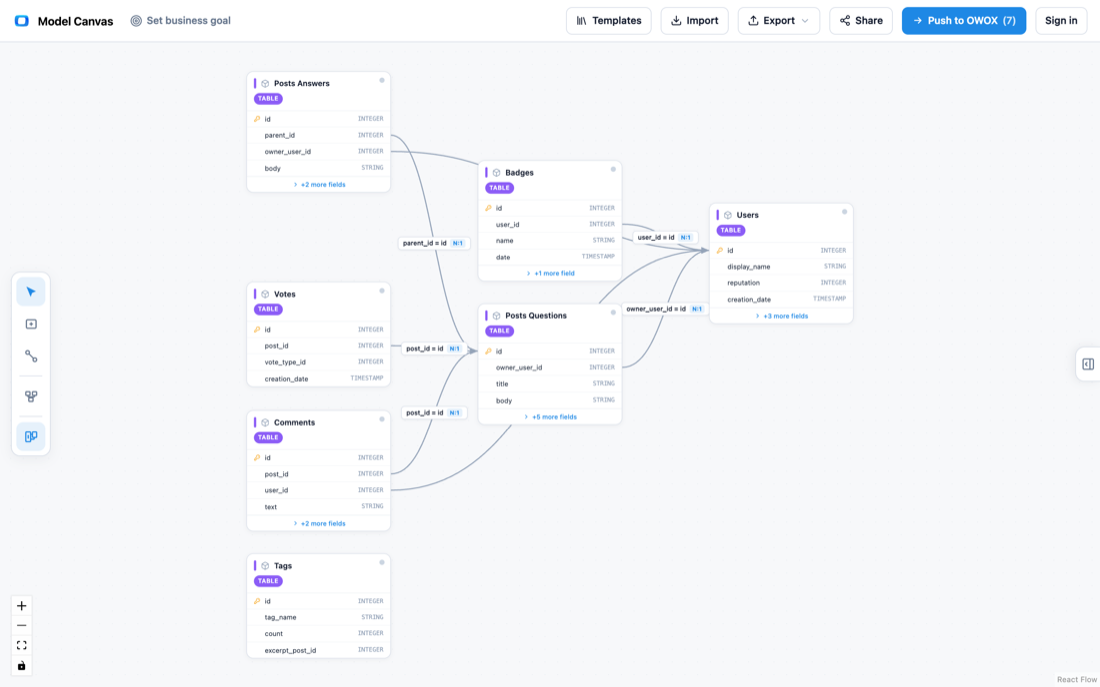
The public Stack Overflow dataset as a model: Users, Questions, Answers, Comments, Votes, Badges, and Tags, and how they all link together. Useful for exploring answer rates, reputation, and top tags.
How to use a data model template
How to use a data model template
Opening a template and shipping a usable model takes about two minutes of setup and however long you want to spend refining. The flow is the same for all nine.
(1) Open the closest template. Click any “Open in the canvas” link above. It loads in your browser with no sign-up.
(2) Reshape it. Rename tables, add or drop fields, and redraw joins directly on the canvas until it matches your business.
(3) Adjust grain and keys. Set what one row means on each fact table, and confirm the primary and foreign keys that join them.
(4) Export it. Use Export → OKF for a portable model file, or grab a diagram image. Keep the OKF in git, hand it to a teammate, or push it into OWOX Data Marts when you want it live in your warehouse.
If you’re comparing tools while you’re here, our roundup of free database diagram design tools puts the canvas in context next to the usual diagramming apps.
Templates in a doc vs. a real modeling canvas
Templates in a doc vs. a real modeling canvas
A lot of “data model template” downloads are Word, Excel, or PowerPoint files. Those are fine for a quick sketch in a meeting, but it’s worth being honest about where they stop.
A document can’t validate that a join actually works, isn’t queryable, and can’t produce a machine-readable model your warehouse or a teammate’s tool can consume. You end up redrawing the same diagram three times. A real modeling canvas keeps a live ERD and gives you a portable output you can version and reuse.
| Capability | Doc / spreadsheet template | Visual modeling canvas |
|---|---|---|
| Live, connected ERD | No – static shapes | Yes |
| Machine-readable export | No | Yes – OKF + image |
| Version control friendly | Hard (binary files) | Yes – plain-text OKF |
| Cost to start | Free | Free, no sign-up |
Export to OKF: a portable, open data model
Export to OKF: a portable, open data model
The part most template galleries skip is what happens after you finish the diagram. A picture is nice, but you can’t diff a picture or feed it to your warehouse.
Every template here exports to OKF (Open Knowledge Format), Google’s open, markdown-based standard for describing data models. Because it’s plain text, you can keep your model in git, review it in a pull request, and hand it off without lock-in to any tool. That’s the difference between a one-off drawing and a model that lives alongside your code.
New to the format? Our explainer on what OKF is covers where it came from and why a portable standard matters. When you’re ready to take a model from diagram to live tables, OWOX turns OKF data marts into governed outputs in your own warehouse.
Remix one, or start from scratch
Remix one, or start from scratch
Every template is fully editable. Open the one closest to your business, reshape it, and export an OKF model you own – or draw a fresh model on a blank canvas if none of the nine fit. It’s free and runs in your browser, and you only need an OWOX account when you want to push a model into OWOX Data Marts.
The fastest path to a good data model is rarely a blank page. Pick the closest shape, argue with it, and make it yours.
Turn your data into decisions.
Governed data marts give you the clean foundation ML needs to actually work.
- No AI hallucinations
- Analyst-governed definitions
- Every number traces to SQL
Frequently Asked Questions
Do you have a data model template for my industry?
There are nine to start: e-commerce, SaaS, marketplace, marketing, mobile and gaming, fintech, healthcare, and two public BigQuery datasets (Bitcoin and Stack Overflow). If none fit exactly, open the closest one and remix it, or start from a blank canvas.
What format can I export the data model in?
OKF (Open Knowledge Format), an open markdown-based standard, plus a diagram image. OKF is plain text, so it is easy to keep in version control and hand off without lock-in.
What does a data model or database schema template include?
Tables (or data marts), their fields and data types, primary and foreign keys, and the relationships and grain that connect them, usually drawn as an entity relationship diagram (ERD).
Can I build a data model in Excel?
You can build a basic relational model in Excel using its built-in Data Model feature, which links tables for PivotTables. For anything you need to validate, diagram, version, or export as a portable model, a dedicated modeling canvas is a better fit.
How do I create a data model from a template?
Open the closest template, rename and add tables and fields, redraw the joins to match your business, set the grain and keys, then export to OKF or a diagram image. Setup takes about two minutes.
Are these data model templates free?
Yes. Every template opens in your browser at no cost and with no sign-up. You only need an OWOX account if you choose to push a model into OWOX Data Marts.
What is the difference between conceptual, logical, and physical data models?
A conceptual model shows entities and relationships only. A logical model adds attributes, keys, and precise relationships while staying database-agnostic. A physical model is the implementation for a specific warehouse, with real table and column types.
What are the four types of data models?
It depends on what's meant. By level of abstraction, the types are conceptual, logical, and physical. By structure, the common types are relational, dimensional (star and snowflake), document, and graph. The OWOX data model templates are relational and dimensional, at the logical-to-physical level.