How to connect Databricks to Google Sheets, without CSV exports
There are two routes from Databricks to Google Sheets that hold up. The analyst publishes a Data Mart and schedules a report that writes it into a sheet. Or the business user opens the OWOX Data Marts extension in Sheets and pulls a published Data Mart themselves. Both read the same definition, and neither involves a CSV.
Getting data from Databricks into Google Sheets should not need a manual export every time someone wants fresh numbers. For most data teams it still does: run the query, download a CSV, paste it into a sheet, fix the headers, share the link. Repeat tomorrow.
This guide covers two workflows that replace that, both through OWOX Data Marts. One is for the analyst who wants reports delivered on a schedule. The other is for the business user who wants to pull data on demand without writing SQL. In both, the data team decides what is shared.
Why CSV exports from Databricks do not scale
Why CSV exports from Databricks do not scale
One analyst refreshing one sheet is a chore. The real problem starts when marketing, finance and operations each need their own view of the same data, every day or every week.
Versions diverge. People build formulas on data that was pasted three days ago. Nobody knows which sheet has the right numbers, and the query that produced them lives in one person’s editor.
There is also no control. Whoever has the link sees everything that was pasted, whether or not they should.
The options
Manual export. Fine for a one-off question. For anything recurring it has no refresh, no single definition and no access control.
The Databricks Connector for Google Sheets. Databricks has its own connector, which lets a user query Databricks from inside a by selecting tables or writing SQL, and refresh on a schedule. It fits people who are comfortable writing SQL against the catalog themselves.
A published Data Mart. OWOX Data Marts puts one layer between Databricks and the spreadsheet: the analyst publishes a query, table or view as a Data Mart, and Sheets reads that. The person in the spreadsheet does not need SQL or a Databricks login, and the analyst does not need to rewrite the query for each sheet.
The rest of this guide is the third option, in both of its forms.
OWOX Data Marts
See your first report built in real time. 15 minutes.
- Connect your data warehouse
- Pick your metrics
- Get a live Google Sheets report
In the time it takes to write a ticket. Then imagine never writing that ticket again.
Book a DemoWe'll use your actual use case
The analyst way: scheduled reports
The analyst way: scheduled reports
If you write the SQL and field the requests for updated numbers, this is your workflow.
Step 1: connect Databricks
In your OWOX Data Marts project, open Storages and add a new storage.
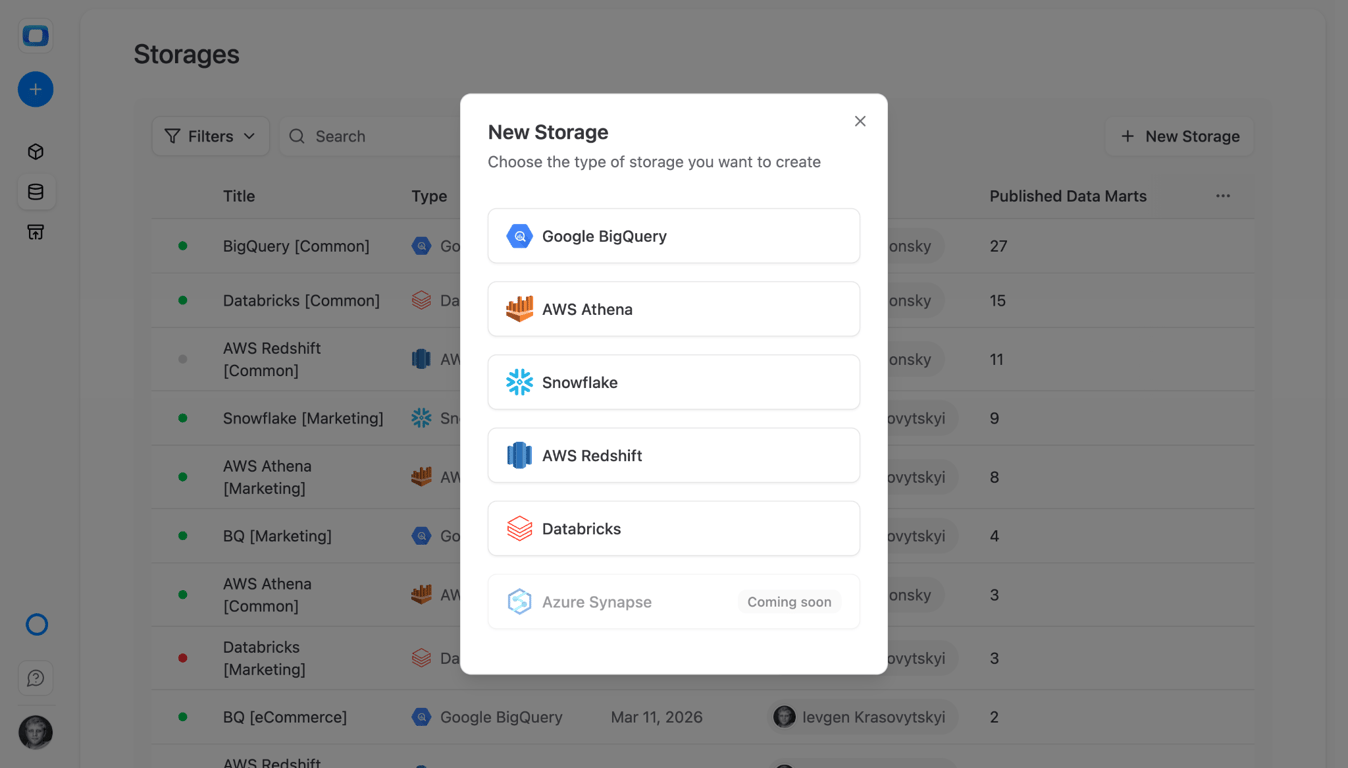
Choose Databricks and fill in three values, described in the setup guide:
- Host: your workspace URL.
- HTTP Path: the path of the SQL warehouse that should run the queries, from that warehouse’s connection details.
- Personal Access Token: generated in your Databricks user settings.
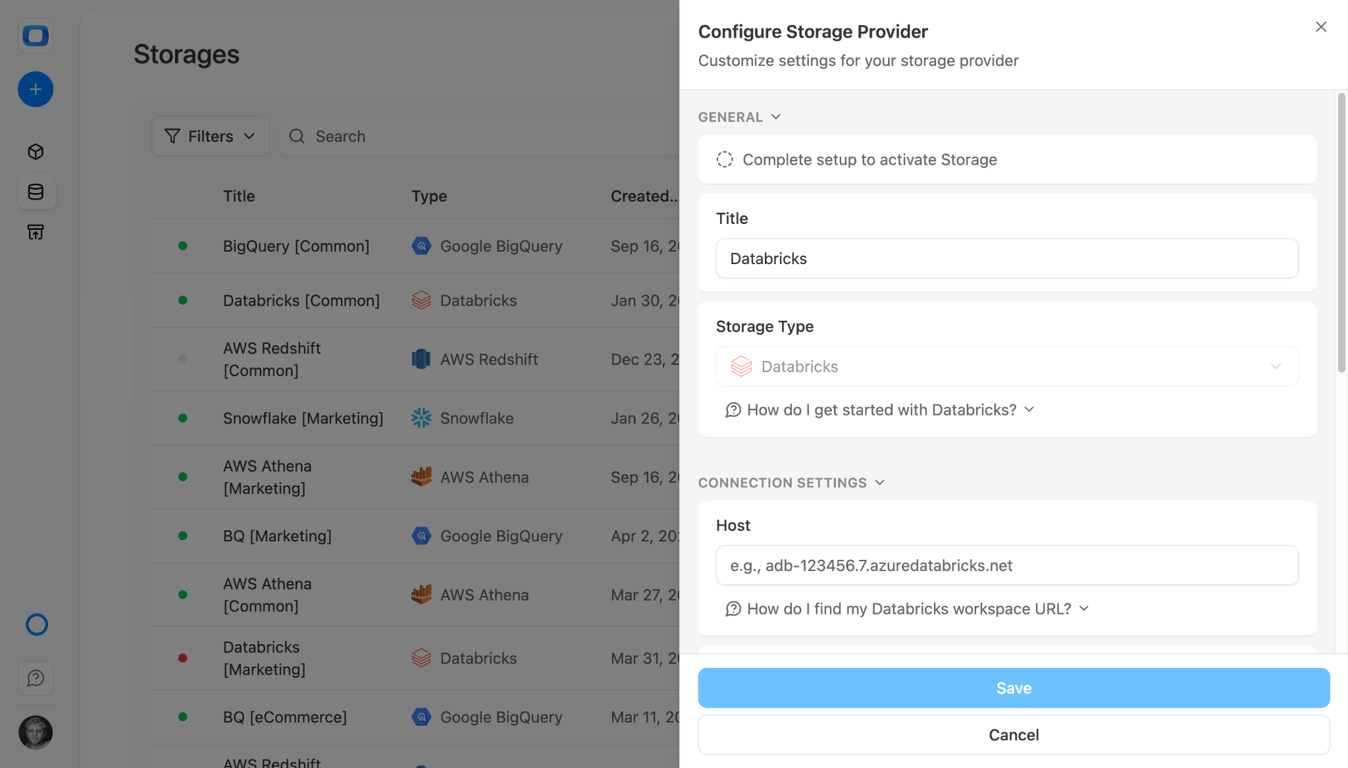
The HTTP path decides which SQL warehouse does the work, so it also decides the cost. The guide recommends turning on auto stop, starting with a small warehouse and using serverless where it is available. Databricks pricing explains what each of those is worth.
Step 2: create Data Marts
You can create Data Marts one at a time, or in bulk. From the Data Marts list, Import lets you pick tables and views from the storage, and each becomes a Data Mart.
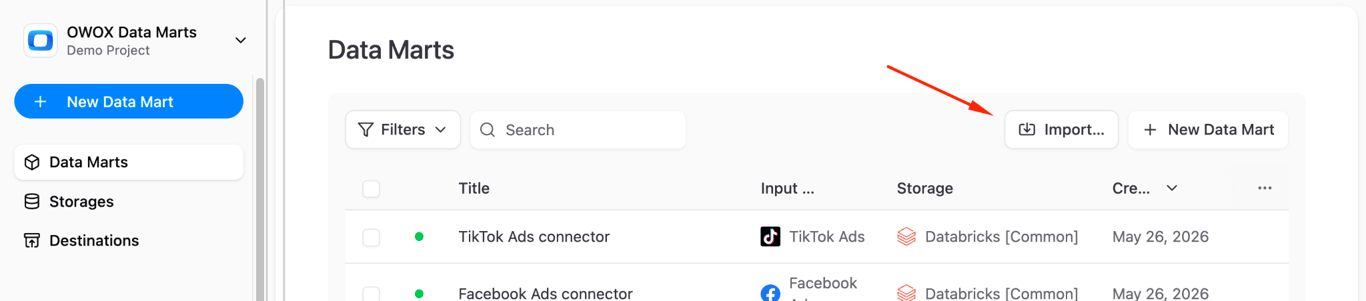
A Data Mart can be defined in several ways:
- SQL: your own query against Databricks tables.
- Table or view: an object that already exists in the catalog.
- Connector: data loaded from an ad platform or another source into Databricks, as in Facebook Ads to Databricks.
For a report of sessions, orders and revenue by channel and day, a SQL Data Mart looks like this:
SELECT
  s.date,
  s.source_medium,
  COUNT(DISTINCT s.session_id) AS sessions,
  COUNT(DISTINCT o.order_id) AS orders,
  SUM(p.price * o.quantity) AS revenue
FROM workspace.default.sessions s
LEFT JOIN workspace.default.orders o
  ON s.session_id = o.session_id
LEFT JOIN workspace.default.products p
  ON o.product_id = p.product_id
WHERE s.date >=
  date_sub(current_date(), 90)
GROUP BY s.date, s.source_medium;
OWOX Data Marts runs this SQL as written. It does not transform the data; the logic is yours.
Step 3: describe the output
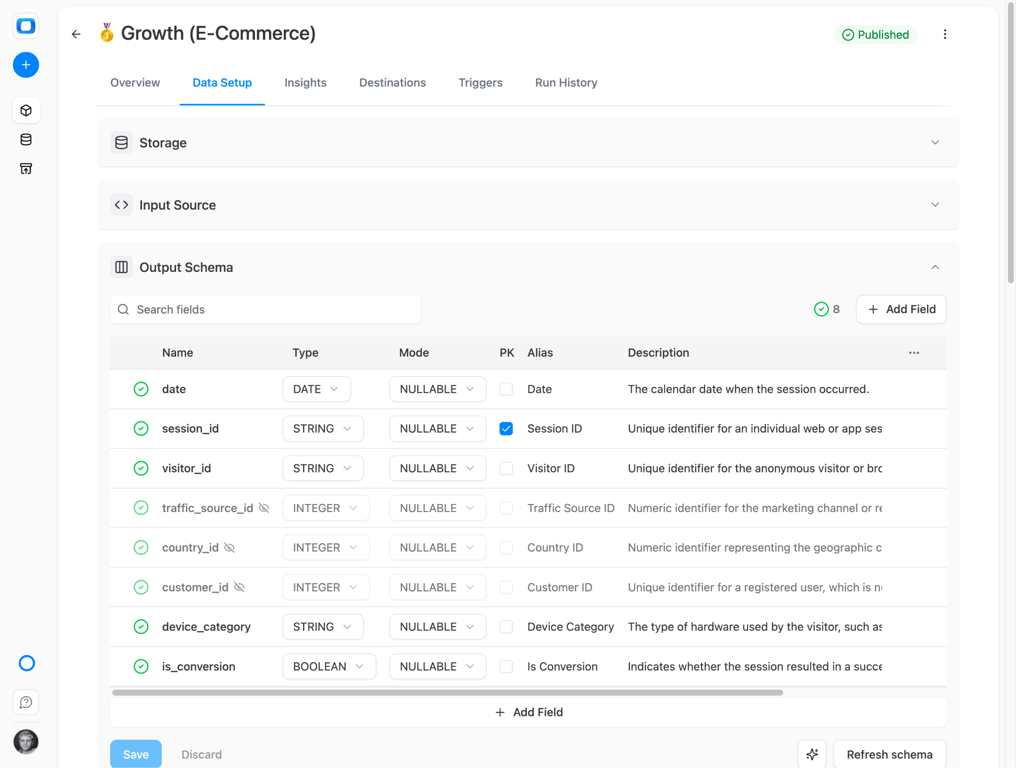
Once a Data Mart is published, its Output Schema lists every column with its type. This is where you make it readable for someone who has never seen the tables: primary keys, a business-friendly alias for each column, and a description.
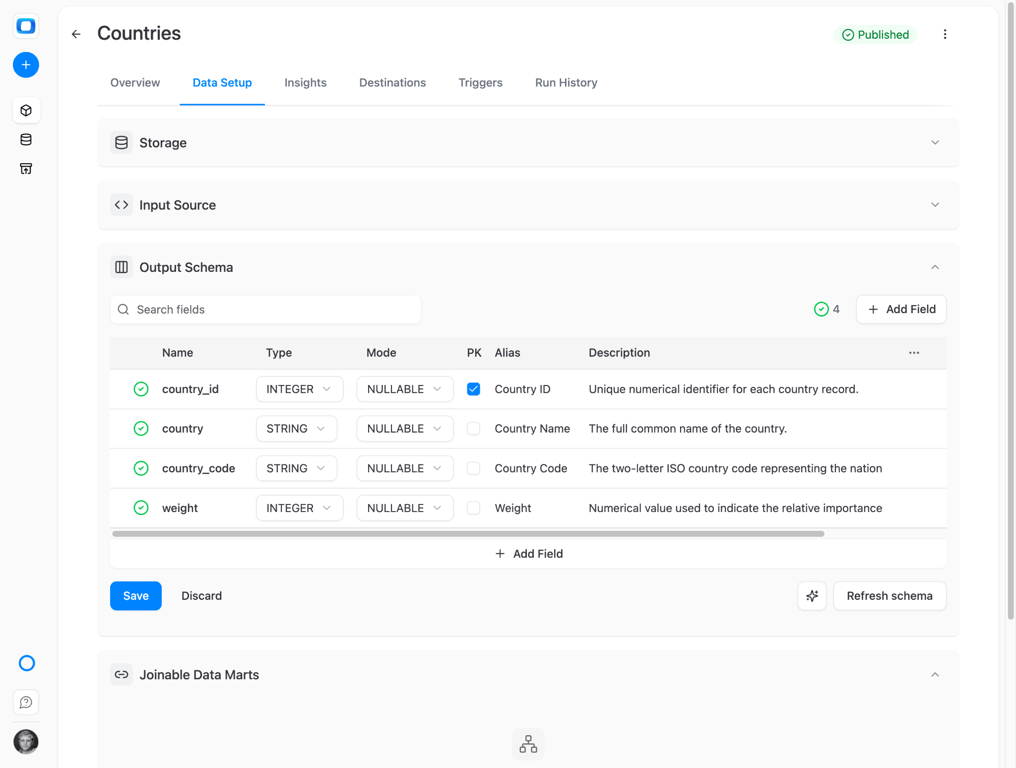
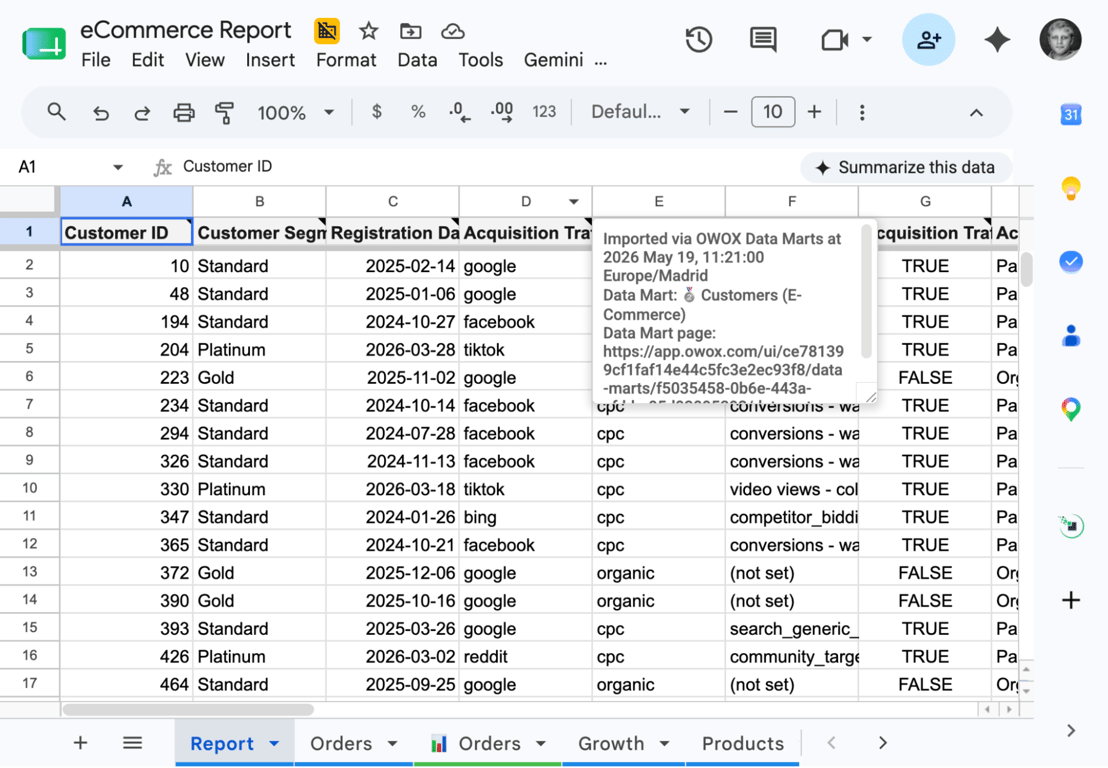
Do not skip the descriptions. They travel with the data into Google Sheets as notes on the header cells, so the reader can see what a column means without asking.
Step 4: deliver it to Google Sheets
Add Google Sheets as a destination, once, with either Google OAuth or a service account JSON key. Then, on the Data Mart’s Destinations tab, create a report: the document and tab to fill, and the columns to include.
When the report runs, the rows are written into the sheet. Headers and data in the imported range are replaced on each refresh. Columns you add to the right are left alone, and a formula in row 2 is filled down to the new rows.
Step 5: schedule it
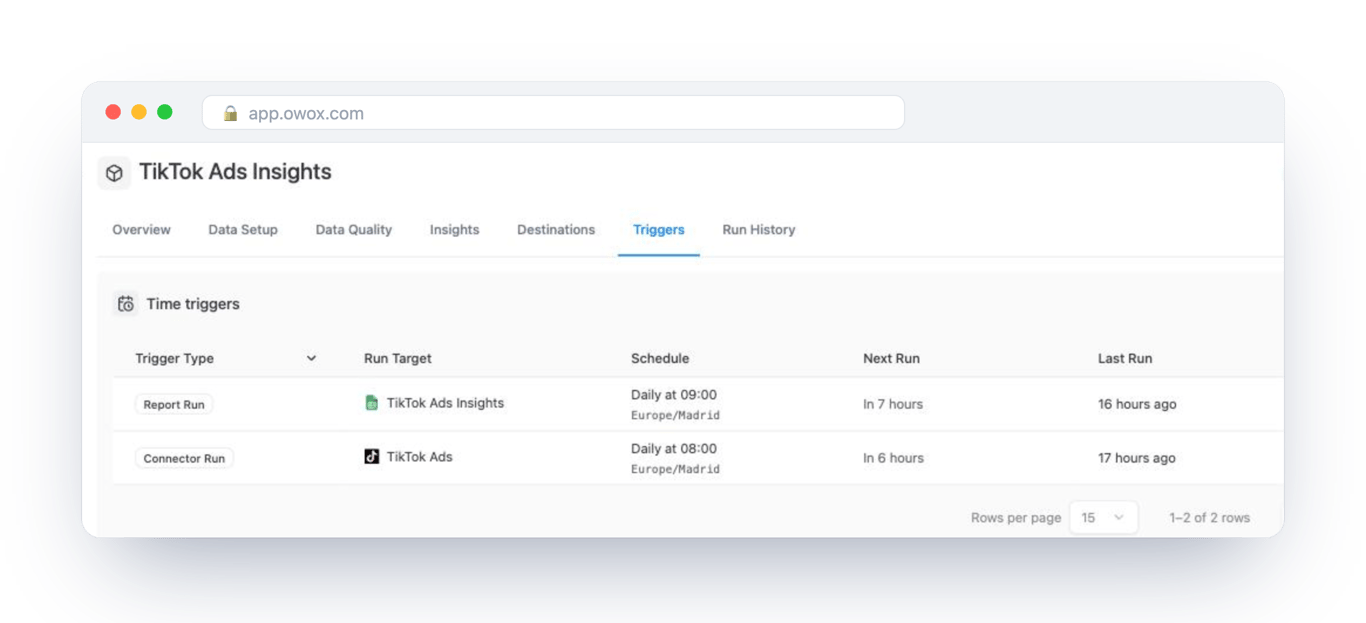
On the Triggers tab, add a report run trigger: daily, weekly or at an interval, in the time zone you choose. Each run executes the query on your SQL warehouse and rewrites the sheet. Run History lists every run with its status.
Then share the sheet the usual way. The readers get current numbers and never touch the Data Mart. You control the SQL, the columns and the schedule.
The business user way: self-service from the Sheets extension
The business user way: self-service from the Sheets extension
Scheduled reports solve the refresh problem, but every new slice is still a request to the analyst. The OWOX Data Marts extension for Google Sheets lets business users on OWOX Cloud pull published Data Marts themselves.
What the analyst sets up
Two settings decide what a business user can reach.
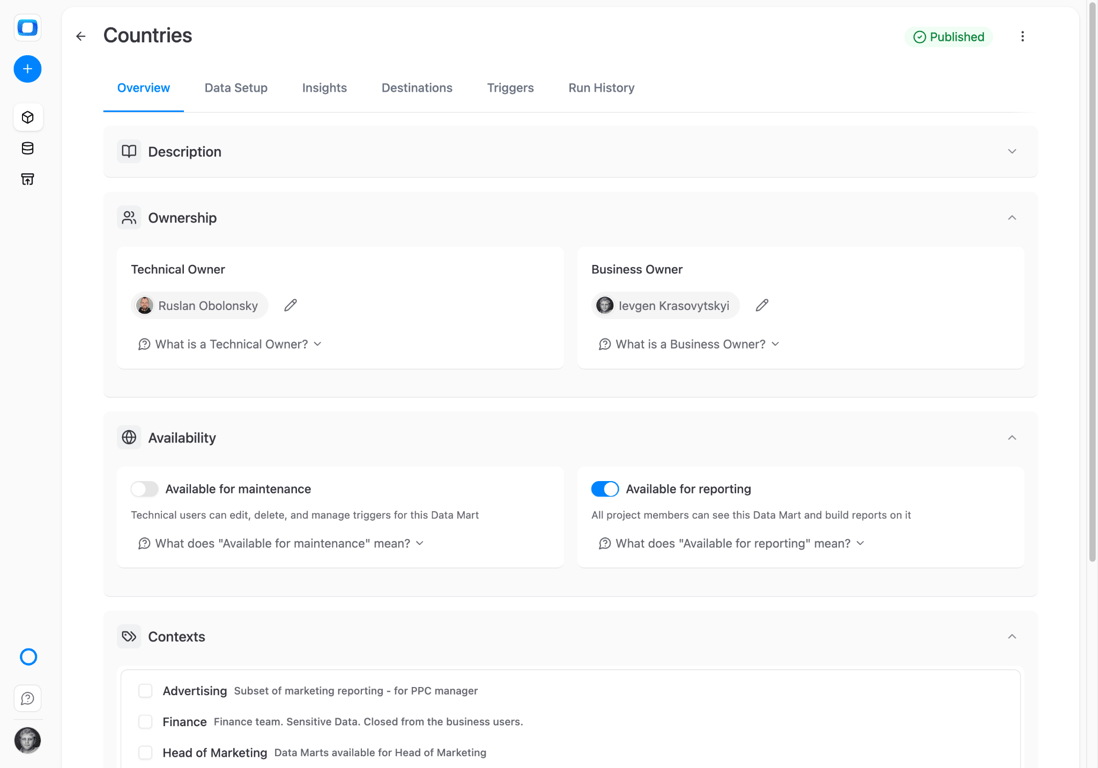
Availability. On a Data Mart’s Overview tab, Available for reporting makes it visible in the extension. Everything else stays out of sight, so an analyst can keep dozens of working Data Marts and expose only the validated ones.
Joins. Instead of one enormous query that joins campaigns, revenue and customers into a flat table, you can keep a Data Mart per subject and declare how they join on shared keys. These are joinable Data Marts.
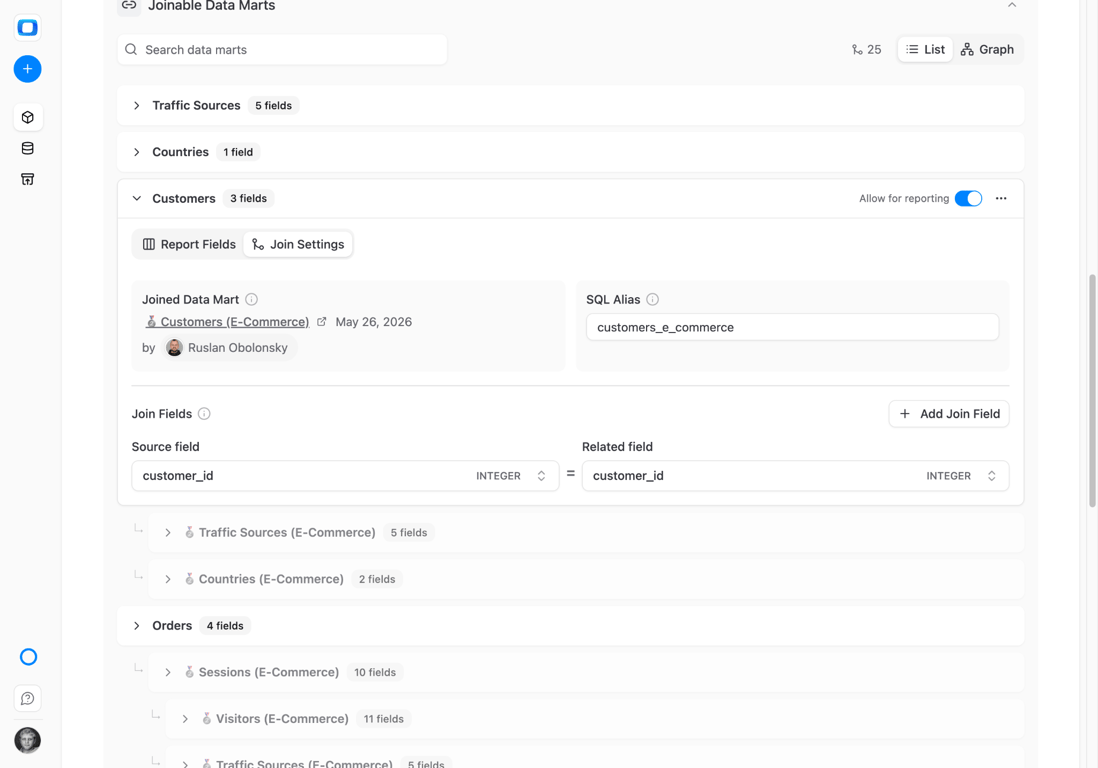
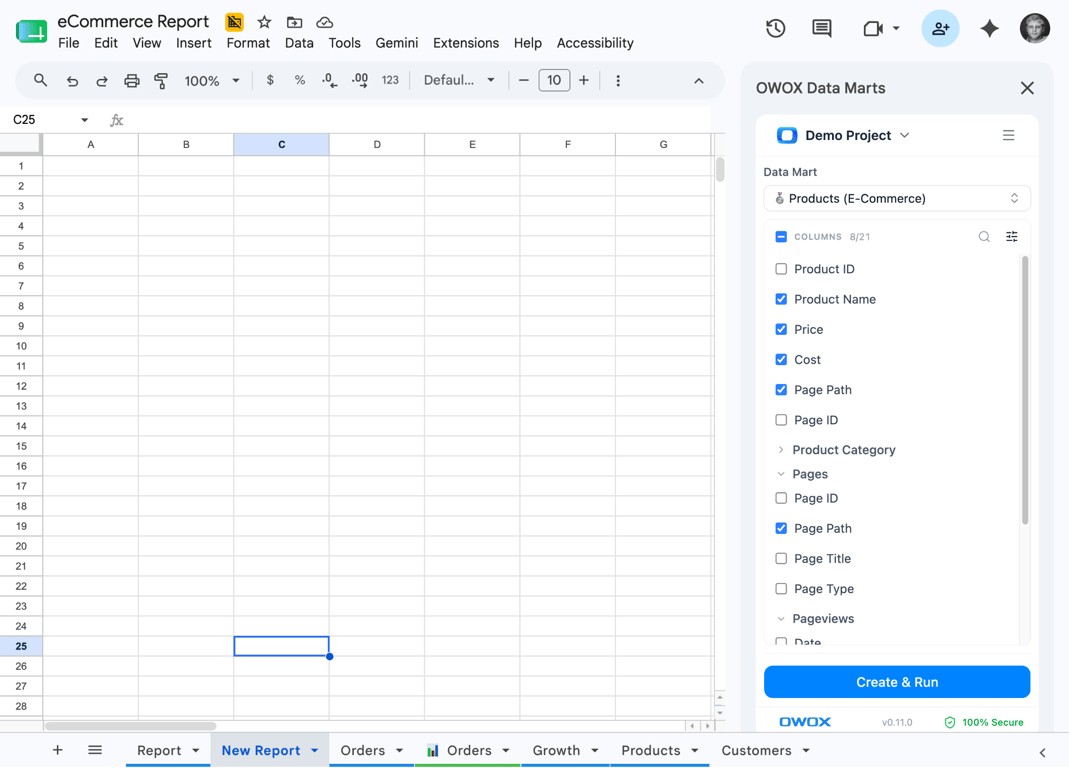
Once a join is declared, the business user sees columns from both Data Marts in one picker, as if they were one table. The SQL is generated from the relationships the analyst defined, so nobody in the spreadsheet is guessing how tables connect.
What the business user does
- Install OWOX Data Marts from the Google Workspace Marketplace. It then appears under Extensions in Google Sheets.
- Open it and choose a Data Mart. Only the ones marked available are listed.
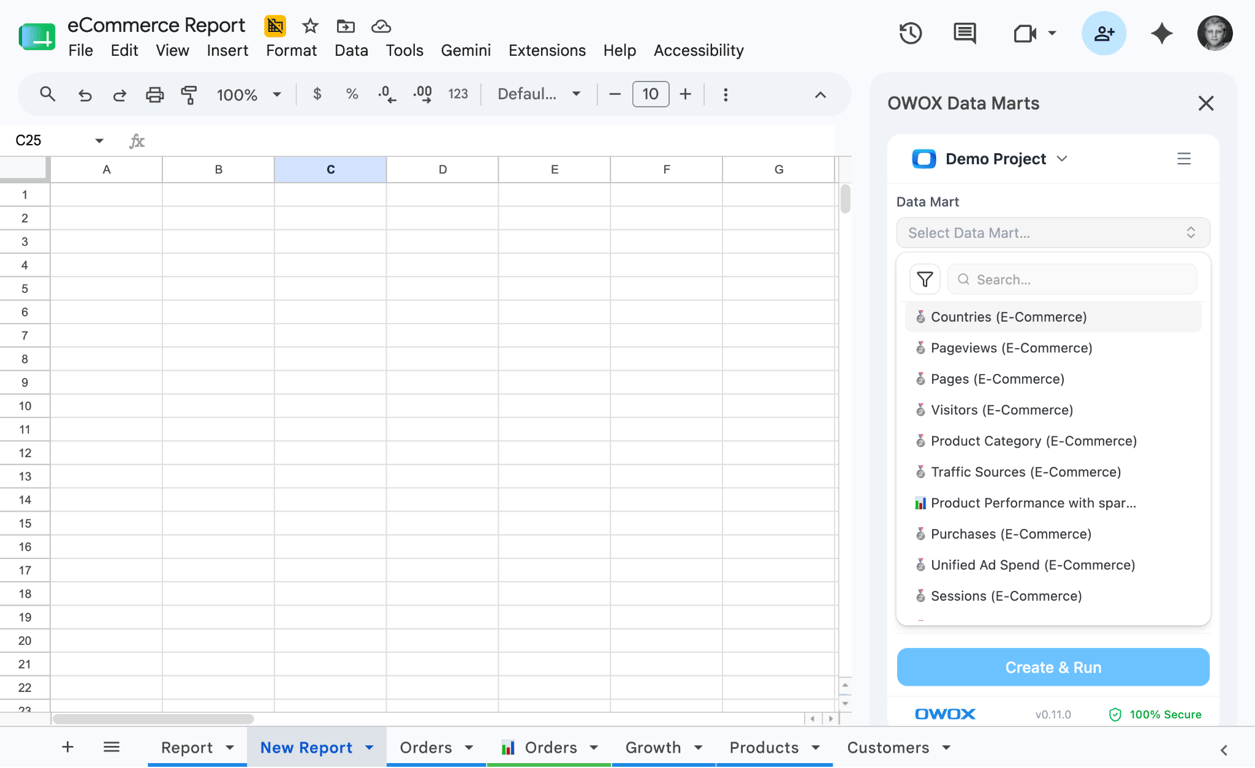
- Select columns. Fields from joined Data Marts appear in the same list.
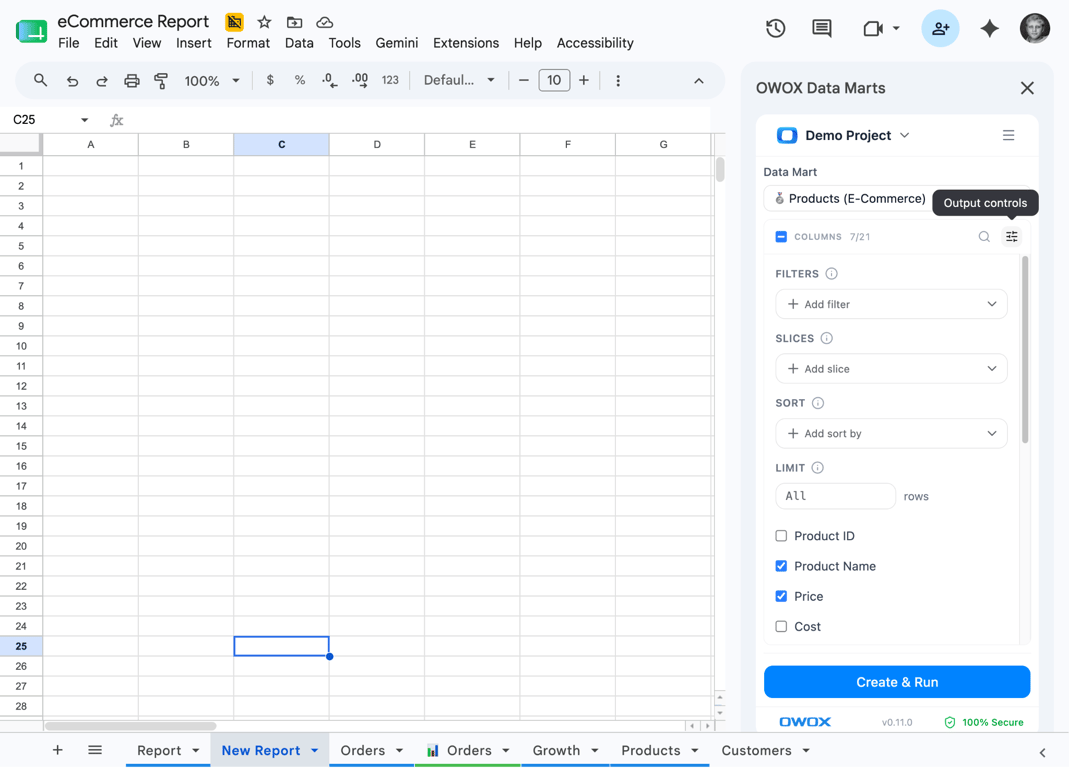
- Add filters, slices, sorting or a row limit.
- Click Create & Run. The rows land in the current sheet, and the pull can be kept on a schedule.
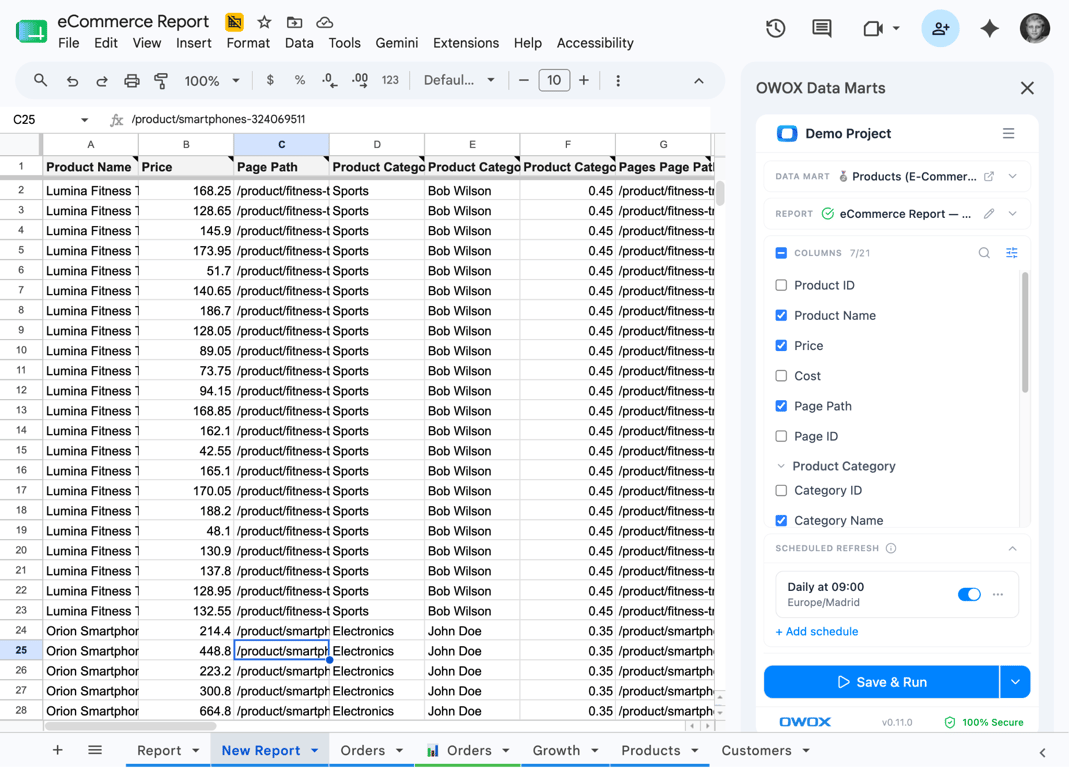
No CSV, no SQL and no ticket. The analyst decided which Data Marts exist, which columns they expose, how they join and what the descriptions say. The business user decided what to look at, and when.
Which workflow to use
They are not alternatives. Most teams use both.
- Scheduled reports for fixed deliverables that many people read: the weekly channel report, the finance summary.
- The extension for questions nobody predicted, asked by people who know the business but not the catalog.
Both read the same Data Marts, so the two sheets agree with each other. And because each run is a query on the SQL warehouse you named in the storage, a daily report is one short run a day, however many people read the result.
Before you start
- A Databricks workspace with a SQL warehouse, and a personal access token.
- A Google account with access to Google Sheets.
- An OWOX Data Marts project. For self-service, the extension from the Workspace Marketplace.
If Databricks is new to you, what Databricks is and how it works covers the platform. The same route on Snowflake is described in Snowflake reports in Google Sheets, and spreadsheet reporting shows the business user’s side in more detail.
Turn your data into decisions.
Governed data marts give you the clean foundation ML needs to actually work.
- No AI hallucinations
- Analyst-governed definitions
- Every number traces to SQL
Frequently Asked Questions
How do I set up Google Sheets as a destination for Databricks data in OWOX?
In OWOX Data Marts, create a destination of type Google Sheets once and connect it with Google OAuth or with a service account JSON key. Then open the Data Mart's Destinations tab and create a report: the document and tab to fill, and the columns to include. On each run the report's range is rewritten, columns you added to the right are left alone, and a formula in row 2 is filled down.
What are joinable Data Marts in OWOX?
Joinable Data Marts let an analyst keep a separate Data Mart per subject, for example campaign performance and revenue, and declare how they join on shared keys. Business users then see columns from both in one picker, as if they were one table, and the SQL is generated from the relationships the analyst defined.
What is the difference between OWOX Data Marts and the Databricks native Google Sheets connector?
The Databricks Connector for Google Sheets lets a user query Databricks from inside a spreadsheet by selecting tables or writing SQL, and refresh on a schedule. OWOX Data Marts adds a published layer in between: analysts define Data Marts once, decide which are available for reporting, and business users pull them from the Sheets extension without SQL or a Databricks login.
Can business users access Databricks data in Google Sheets without SQL?
Yes. An analyst publishes Data Marts and marks them available for reporting. A business user on OWOX Cloud installs the OWOX Data Marts extension for Google Sheets, picks a Data Mart, selects columns, adds filters and runs it, all without writing SQL. The data team controls which Data Marts and columns are visible.
How do I automate Databricks reporting in Google Sheets?
Create a Data Mart in OWOX Data Marts from a SQL query, a table or a view on your Databricks storage. Add Google Sheets as a destination, create a report for the tab you want filled, and add a report run trigger on the Triggers tab: daily, weekly or at an interval. Each run executes the query on your SQL warehouse and rewrites the sheet.
Can you connect Databricks to Google Sheets without CSV exports?
Yes, in three ways. The Databricks Connector for Google Sheets lets a user who writes SQL query Databricks from inside a spreadsheet. With OWOX Data Marts, a scheduled report writes a published Data Mart into a sheet on a set cadence, and the Sheets extension lets business users pull a published Data Mart on demand without SQL.