
Automate Snowflake to Google Sheets Reporting with OWOX Data Marts
Explore how governed data marts create scalable Snowflake to Sheets reporting with refreshes and trusted metrics. Get started Free!

Most teams still move data from Snowflake to Google Sheets the hard way: exporting CSVs, copy‑pasting ad hoc query results, or relying on brittle direct connectors. It works until it doesn’t – dashboards get out of sync, metrics drift, and analysts end up spending more time fixing reports than finding insights.
.png)
This article walks through a different approach: introducing a governed, reusable Data Mart layer between Snowflake and Google Sheets, and automating the entire reporting pipeline. You’ll see how to design and document business-ready data marts on top of Snowflake data, expose them safely to business teams, and keep Sheets refreshed on a schedule – all without creating another shadow BI system.
By the end of this article, you’ll learn how to:
- Transform Snowflake data into simple, analyst-owned Data Marts.
- Push these Data Marts directly into Google Sheets with scheduled refreshes.
- Give business users self-service access to trusted metrics – without sacrificing governance.
Why Modern Snowflake to Sheets Reporting Needs a Data Mart Layer
Connecting Google Sheets directly to Snowflake (or exporting CSVs by hand - ouch, but that still happens!) feels fast at first, but it doesn’t scale:
- Every spreadsheet becomes its own “version” of the truth, as it becomes disconnected from the source of truth.
- Slightly different SQL logic creeps into each report.
- Minor schema changes in Snowflake break multiple Sheets tabs at once.
- Analysts become gatekeepers for even basic questions from the stakeholders; they grow the queue of tasks and get overwhelmed quickly.
A Data Mart layer is a modern approach that changes this dynamic.
Instead of every report hitting core warehouse tables or raw events, data teams:
- Define curated, business-friendly data marts answering a specific business question with a clear description and ownership;
- Standardize metric logic in one place, then reuse it across dozens of Sheets, BI dashboards, or make those AI-accessible (yes, that’s right, but more on that later);
- Isolate downstream business users from schema changes (as you control the Output schema of a data mart the same way you do that in the table);
- Monitor and govern access (and usage!) from a central point.
This is the foundation for reliable, scalable reporting – especially when marketing, product, and finance teams all rely on Google Sheets reports for daily decisions.
What ‘Governed, Reusable Data Marts’ Mean in Practice
In this context, a Data Mart is not a separate database or a copy of your warehouse, or not even a part of your warehouse. It’s a thin “semantic layer lite” (it’s easy, trust me. Nobody wants to build a semantic layer) on top of Snowflake, purpose‑built for a specific analysis domain (e.g., marketing performance, product usage, or revenue analytics).
Reusable Data Marts in OWOX share a few characteristics:
- Domain‑focused: Each Data Mart is designed around a clear business question or function.
- ‘Designed’ for analysis, not storage: Tables (or SQLs) are denormalized and organized for exploration by stakeholders in Sheets, not for OLTP use (eg. you avoid using IDs and Timestamps in the Output Schema as much as you can)
- Documented and discoverable: Columns and metric definitions are described in business language by using Aliases and Field Descriptions. .
- Stable interfaces: You can safely change underlying pipelines while keeping Data Mart schemas consistent.
- Access‑controlled: Different teams see the views they need, with appropriate row/column-level restrictions.
With this layer in place, Google Sheets isn’t querying arbitrary Snowflake tables or Snowflake SQL; it’s reading from curated surfaces that analysts trust and maintain.
Introducing OWOX Data Marts as Your Reporting Layer
To fix the scalability problems related to ad‑hoc Snowflake to Sheets tasks on the data teams boards, you need a reporting layer that sits between your warehouse and your spreadsheets.
OWOX Data Marts is an extremely simple and lightweight data analytics platform that helps you operationalize this data-mart-first approach without spending time on building a semantic layer (that you will never end-up building), modeling data or trying to figure out how to setup another analytics tool.
Instead of manually stitching together scripts, connectors, and refresh jobs, you can:
- Define and manage Data Marts on top of Snowflake.
- Configure how those Data Marts are exposed to Google Sheets.
- Schedule automatic refreshes that keep Sheets in sync with the warehouse.
Also, the platform allows you to:
- Connect data from 3rd party platforms right into Snowflake;
- Connect BI tools like Looker Studio as Destinations to the same Data Marts;
- Enable AI Insights on top of Snowflake data delivered on a scheduled and fully controlled by the data team (we use SQL to generate every number, even with AI!)
If you don’t have access yet, you can start working with governed Data Marts and automated reporting by getting started free below.
This architecture transforms your Snowflake Google Sheets integration from a tangle of one‑off connections into a clean, scalable pipeline:
- Snowflake holds all Bronze & Silver-layer data (and some of the gold-layer data as well, thats fine).
- Google Sheets (and other tools) “run” Gold-layer Data marts on a schedule.
What a Data Mart Is and How It Fits Between Snowflake and Google Sheets
In the OWOX platform, a Data Mart is an intermediary layer between the corporate data and the BI Tools (including spreadsheets), but also - that’s a hand-off artifact of a data analyst to a business user.
Think of it as a “query library” or “semantic layer lite” on top of Snowflake:
- It aggregates, joins, and reshapes data from your Snowflake bronze and silver layer tables into the one that answers specific business questions.
- It exposes metrics and dimensions using business-friendly names (we call that Aliases).
- It enforces consistent filters, rules, or cohort logic.
In a typical workflow:
- You use raw data from Snowflake (or modeled via dbt).
- You define a Data Mart using SQL in OWOX that references those tables.
- Business users access the Data Mart from Google Sheets without touching the underlying SQL.
Note: If you have data already modeled into Tables in Snowflake - you can re-use that as well.
This way, data analysts maintain control over logic and schema, while non‑technical users get a simple, stable dataset surface to work with in Sheets.
How One Data Mart Can Serve Multiple Teams and Destinations
A key benefit of using reusable Data Marts is that each one can power many downstream use cases:
The same “Marketing Performance” data mart can feed:
- Weekly campaign reporting in Google Sheets for the performance team.
- A summary tab for leadership KPIs.
- BI dashboard in Looker Studio.
- AI Insights delivered to slack #performance-marketing channel with a summary and analysis for yesterday, with a quick information of which campaigns to stop first, which to scale (but this is a recommendation, not an action)
The same “Product Usage” data mart can serve:
- Growth experiments tracking in Sheets.
- Customer Success health-check scorecards in Looker Studio.
- Product ops ad‑hoc analysis.
- AI insights delivered by email to a product team to track funnel leaks.
You configure the Data Mart once – including fields, filters, and calculated metrics – and different teams access it in the way that best fits their workflow, without redefining logic.
This reuse is what turns the reporting layer into infrastructure: stable definitions upstream, flexible consumption downstream.
Separation of Data Modeling in Snowflake from Data Consumption in Sheets
With OWOX, you keep complex data tasks where it belongs – in Snowflake – while simplifying business-user exploring data in Google Sheets:
In Snowflake
Data engineers and analytics engineers build models, enforce data quality, and optimize performance. They expose clean tables or views that represent core entities and events.
In OWOX Data Marts
Analysts define business logic on top of those data: metric definitions, aggregations, derived fields, and business terminology.
In Google Sheets
Business users work with tabular, well-labeled record-level data coming from Data Marts, using familiar formulas and charts, without needing to understand SQL or warehouse schemas.
This hard-separation ensures that:
- Schema changes and SQL refactors are absorbed at the Data Mart layer, not in dozens of Sheets, so you have one place to do tweaks (even if necessary);
- Governance and documentation live close to the data, and delivered into the first row of every spreadsheet or into metrics and dimensions names into BI Dashboards;
- Data analysts focus on designing robust artifacts, while end users focus on interpreting and acting on the data.
I know, you’re ready to start layering OWOX Data Marts on top of your existing Snowflake environment and automate delivery into Google Sheets, Slack (with or without AI) or Looker Studio.
Automating Snowflake Reports in Google Sheets
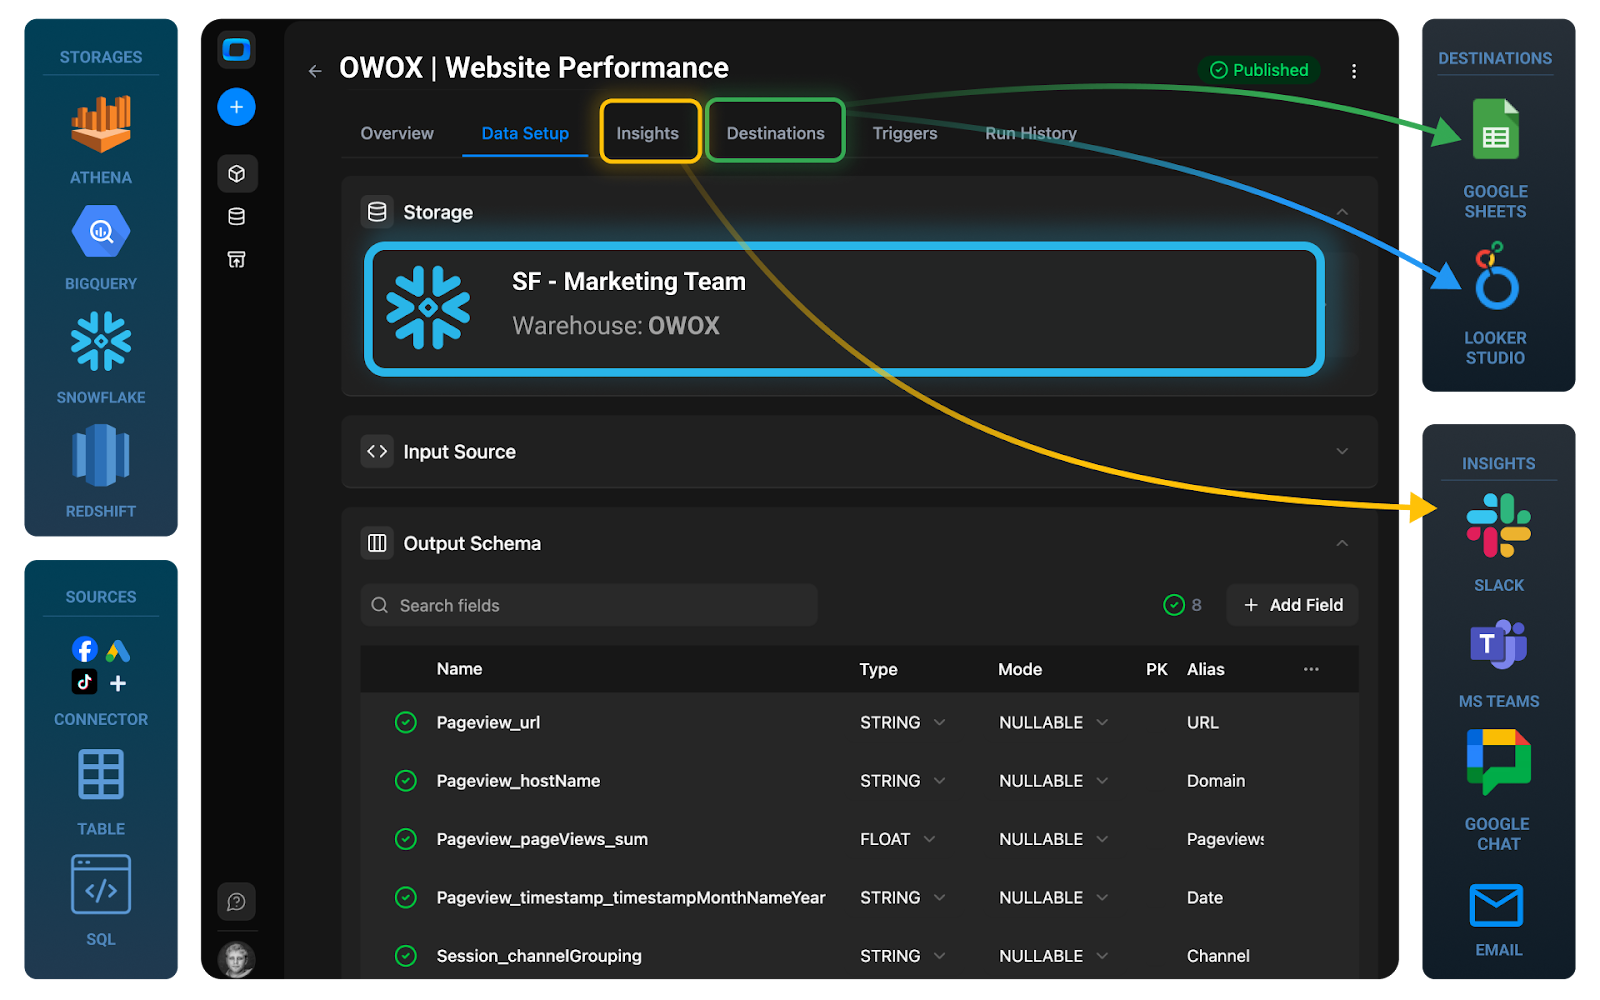
Before automating Snowflake reports in Google Sheets, you need a secure, governed connection between your warehouse and OWOX. This starts with defining a Storage layer in OWOX to centrally manage credentials, permissions, and infrastructure — creating a reliable foundation for scalable reporting.
Step 1: Set up Snowflake as a Data Storage
Under the hood, OWOD Data Marts need a secure and reliable connection to your Snowflake account. That’s the role of Storages in OWOX.
A Storage is the technical bridge between OWOX and your warehouse:
- It stores the Snowflake connection details (account, role, warehouse).
- It defines where OWOX can read data from (with as minimum permissions as possible).
- It encapsulates credentials and permissions so you don’t hard‑code them into every report.
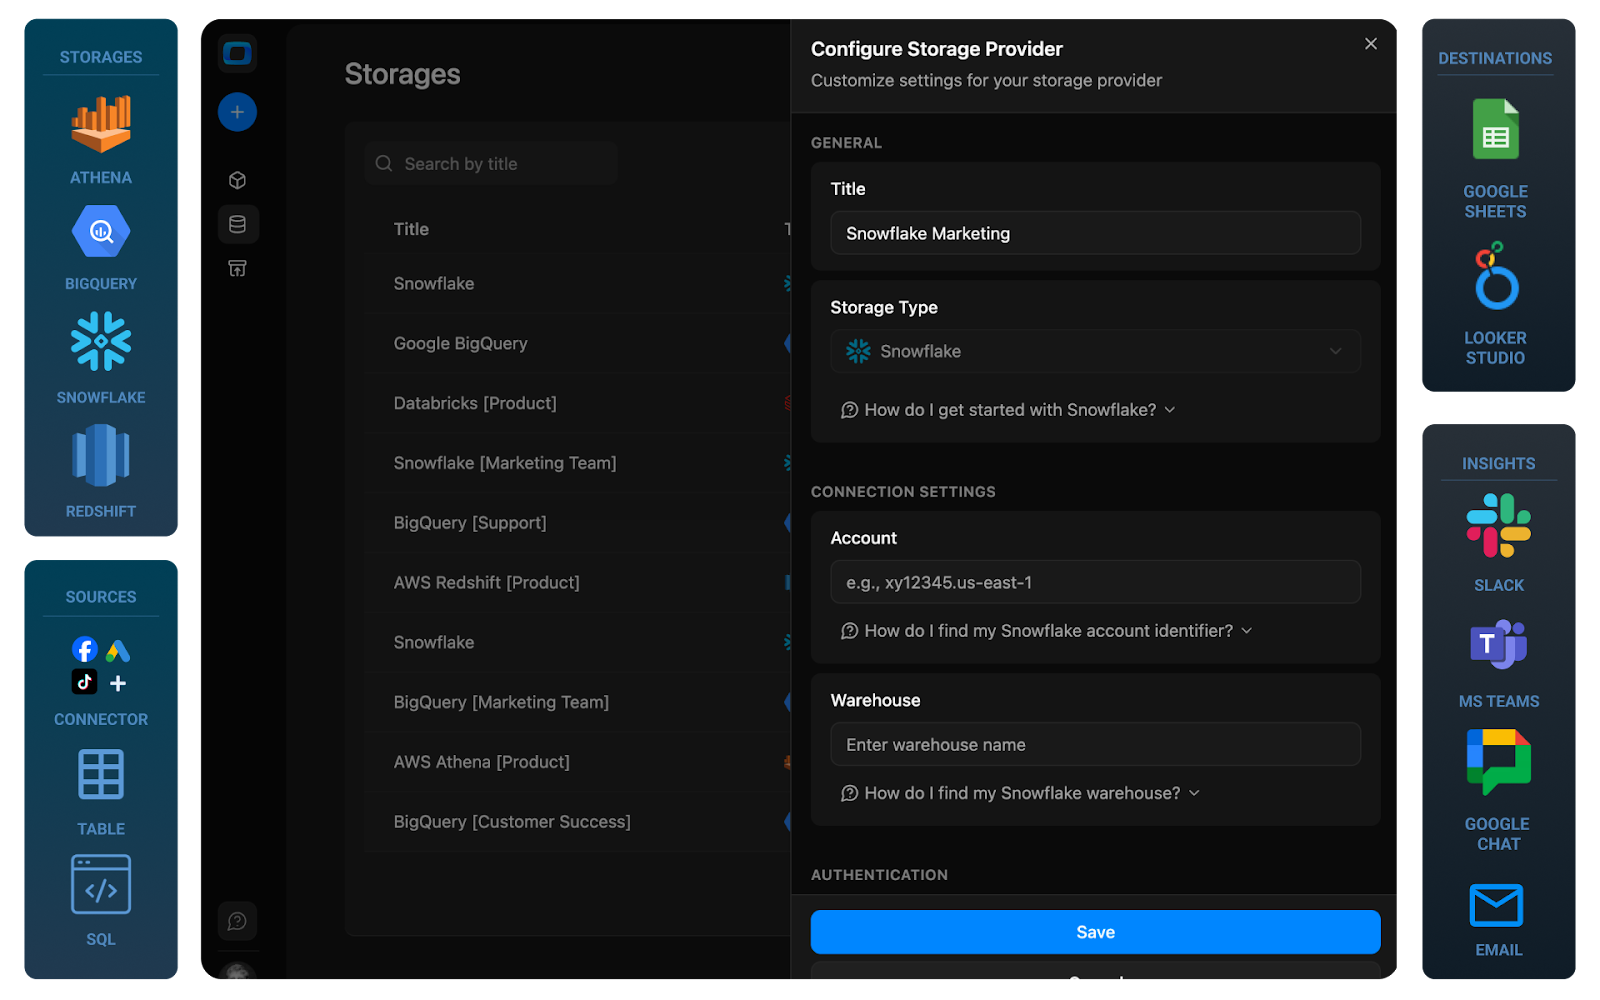
Once you configure a Storage for Snowflake in OWOX:
- Data Marts can query your modeled tables through that Storage.
- You maintain access control at the Storage and Snowflake-role level.
- Any changes to warehouse infrastructure are managed centrally rather than in each Sheet.
This design keeps operational concerns (credentials, roles, warehouses) separate from analytical concerns (metrics, joins, aggregations).
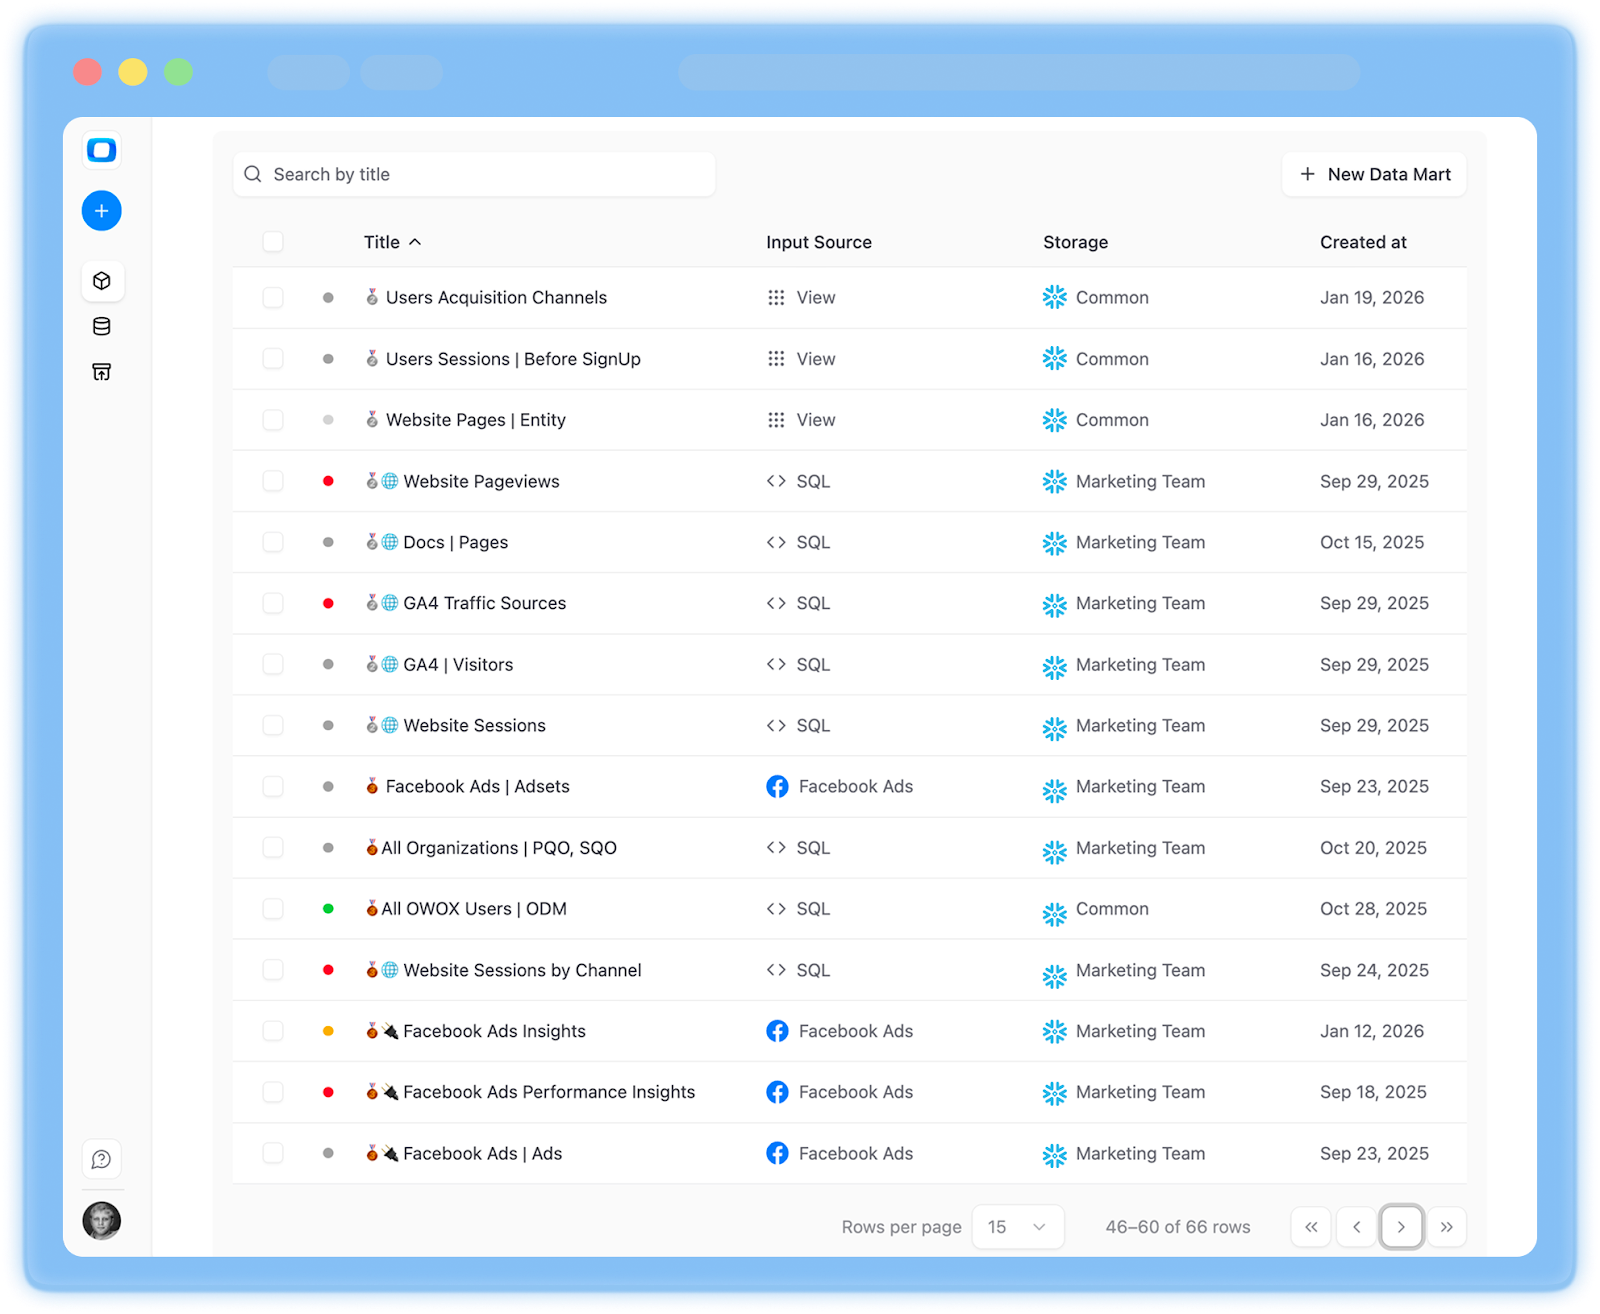
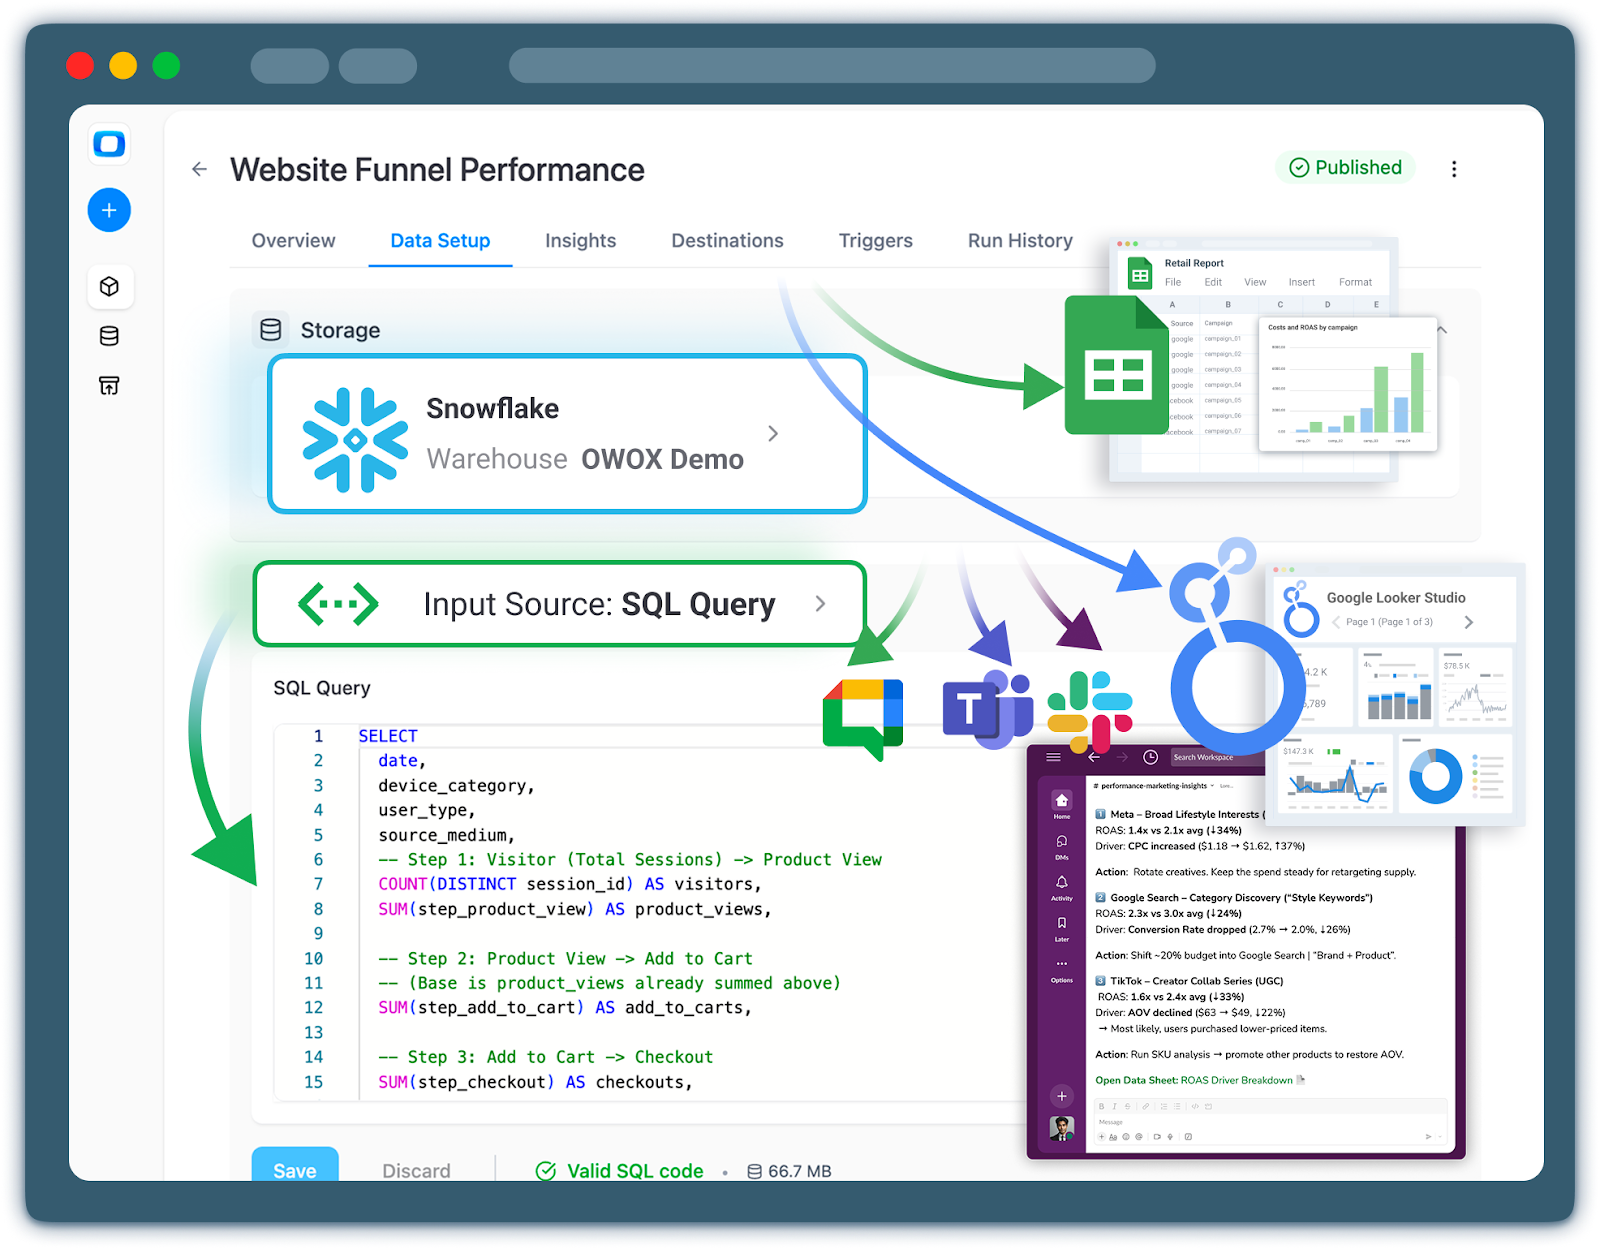
Step 2: Creating a Reusable Data Mart
The next step is to design reusable data marts that your teams can rely on for Snowflake data mart to Sheets workflows.
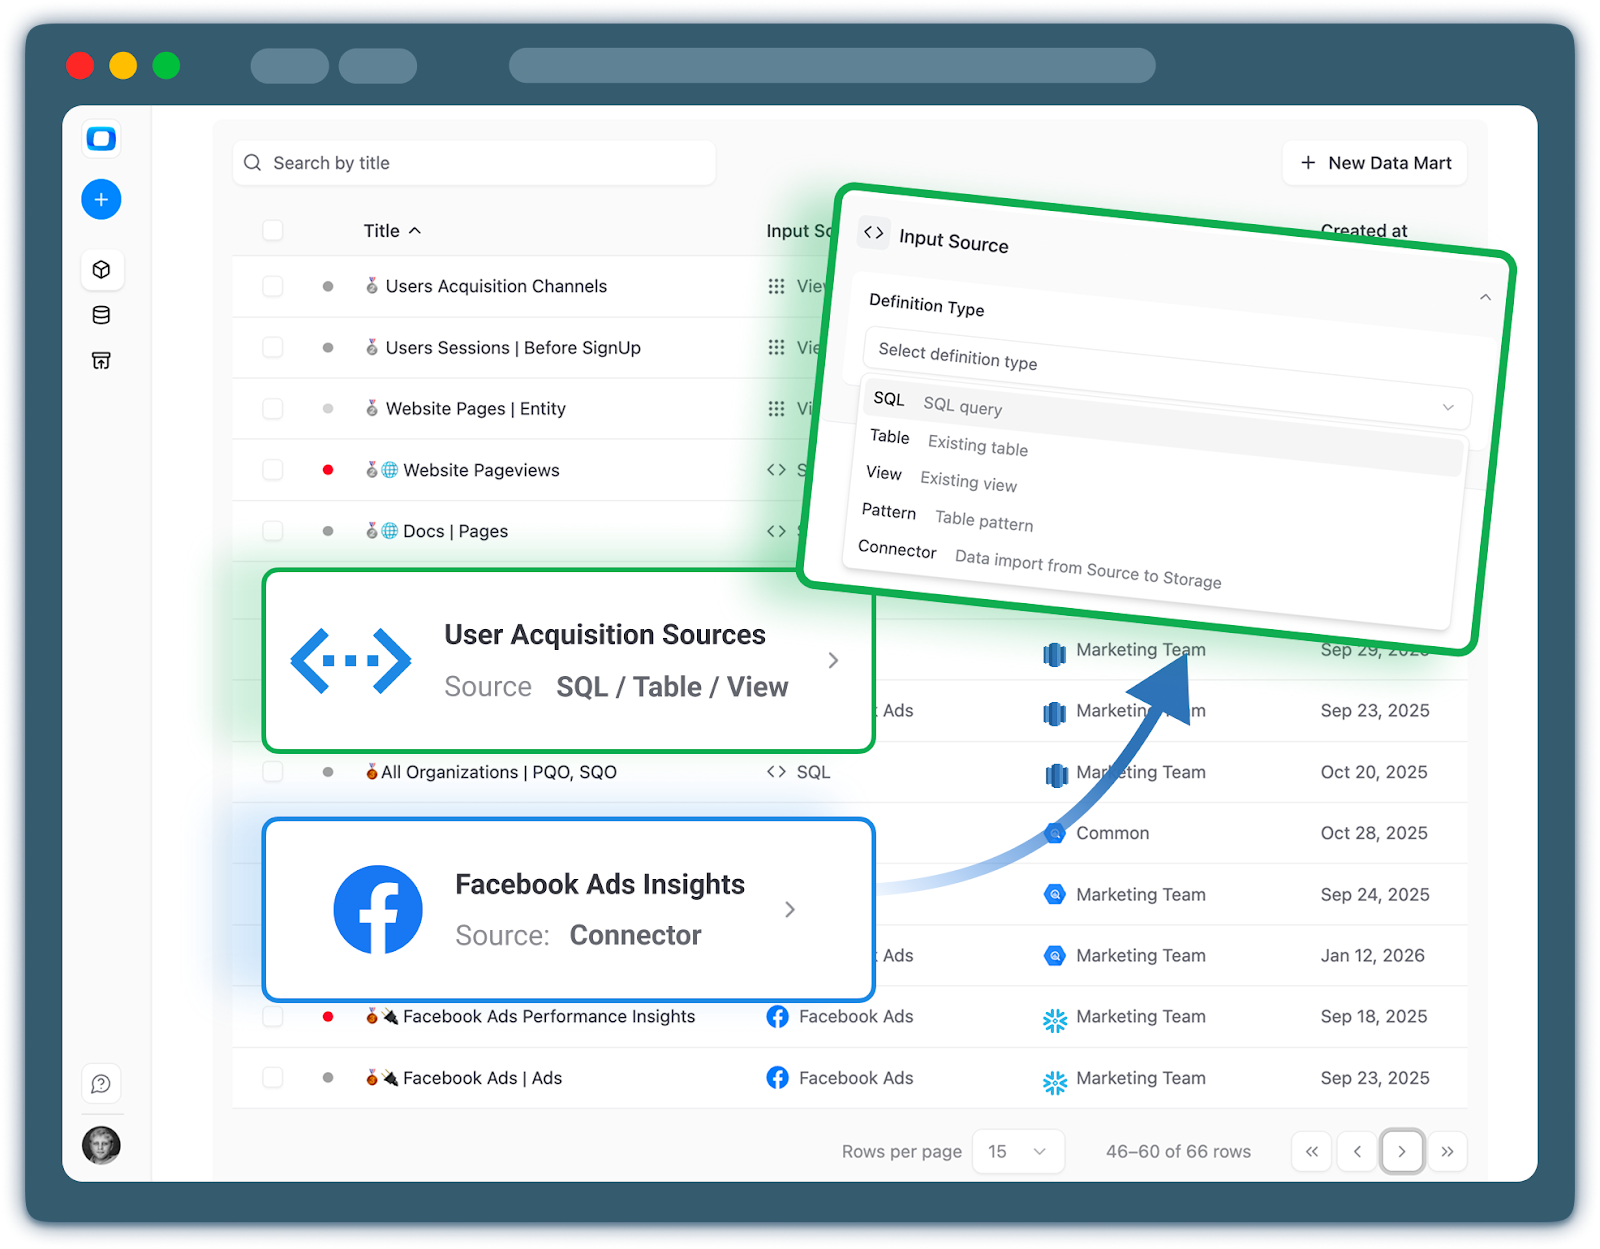
Choosing Input Source
Each Data Mart starts with an input source that defines which Snowflake data it will expose. OWOX supports multiple input types, so you can align with how your warehouse is built today:
Option 1: SQL-based Data Mart
You write a custom SQL query that selects and transforms data from one or more Snowflake tables. This is ideal when:
- You need non‑trivial joins and aggregations.
- You want to prototype a new mart quickly.
- Your logic doesn’t yet live in a persistent Snowflake view.
Option 2: Table-based Data Marts
You point the mart directly at an existing Snowflake table. Use this when:
- You already have a well-modeled, analytics-ready table in Snowflake.
- You want to expose it “as is” but still benefit from documentation and governance in OWOX.
Option 3: View-based Data Marts
You reference an existing Snowflake view as the input. This fits well when:
- Your team manages business logic in version-controlled SQL or dbt models.
- You want a clean separation: Snowflake handles transformations; OWOX focuses on exposure, documentation, and access.
Option 4: Pattern-based Data Marts
You define a pattern (e.g., table name patterns or partition patterns) and let OWOX resolve matching tables. This is useful when:
- You use the data from partitioned tables.
- You want a single data mart to operate across a dynamic set of underlying tables without constant manual updates.
You can even use a connector to a third-party platform, like Facebook Ads.
You can mix and match these approaches across your environment. The key is to pick the input type that best reflects how your logic is currently structured in Snowflake, without duplicating transformation work inside OWOX.
Just don’t forget to publish the data mart.
Step 3: Output Schema & Fields
Once the input source is selected and data mart is published, OWOX reads the schema of a table or a query, and you can carefully document every important field to have a business-friendly alias & purpose description.
Auto‑detected schema is just the starting point. For a Data Mart to be truly reusable across teams, you need to turn raw column metadata into a shared language.
In OWOX, you can enrich each field with:
Aliases: Business-friendly names that hide warehouse-specific conventions. For example:
- user_id → “Customer ID”
- revenue_gross_usd → “Gross Revenue (USD)”
Descriptions:
Short, clear explanations of what each field represents and how it’s calculated. This is where you encode governed metrics definitions:
- Explain the currency and tax treatment for revenue.
- Clarify whether “sessions” are deduplicated across devices.
- Note if a field is pre‑aggregated or still at event level.
Primary keys:
Mark one or more fields as the primary key of the dataset. This helps downstream users (and AI if you use Insights) understand:
- The grain of the Data Mart (e.g., “one row per user per day”).
- Whether it’s safe to aggregate or join without introducing duplicates.
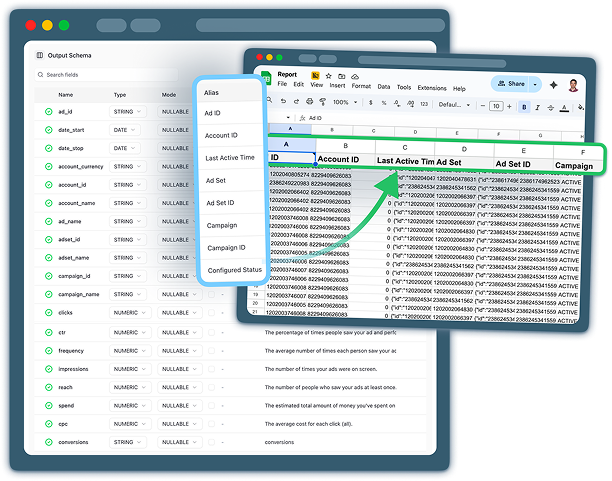
This level of documentation means that when someone uses the Snowflake data mart to Sheets pipeline, they aren’t just seeing cryptic column names – they’re working with a self‑describing dataset that encodes your team’s decisions about definitions and relationships.
If you want to start defining your own documented, reusable Data Marts on top of Snowflake, you can create an account and explore the workflow here.
Step 4: Pushing Snowflake Data into Google Sheets
Once your Data Mart is defined and documented, the next step is to deliver it into Google Sheets where your stakeholders actually work.
So go to Destinations, click ‘+ New Destination’. Select Google Sheets. Give it a name, something like ‘Your Company Name | Common’, enter a Service Account JSON and click ‘Save’.

From here, the configuration is straightforward:
- Select the relevant Data Mart
- Configure a Google Sheet
- Go to the Destinations tab under your Data Mart and click ‘+ Add Report’.
- Give your report a title.
- Pick the specific Google Sheets document & paste its URL.
- Grant OWOX permission to write to your Sheets (Just share a document with a service-account email address (it’s available exactly when you setup the report).
- Set the schedule (eg. every day at 9 am your time).
- Click ‘Save & Run Report’.
- See how your Snowflake data loads into Google Sheets right away.
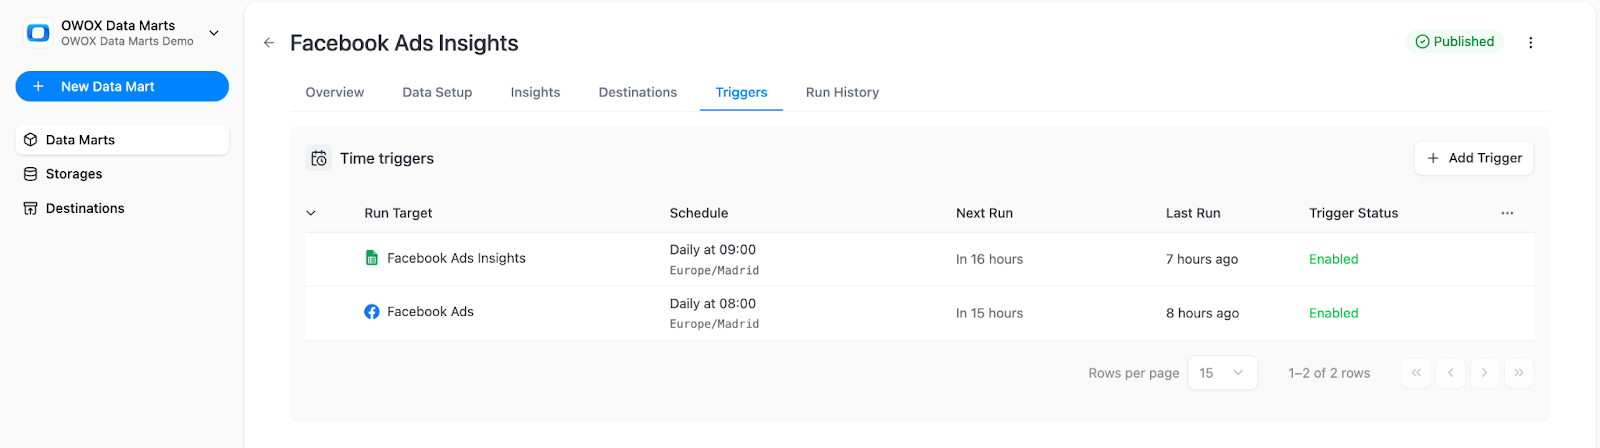
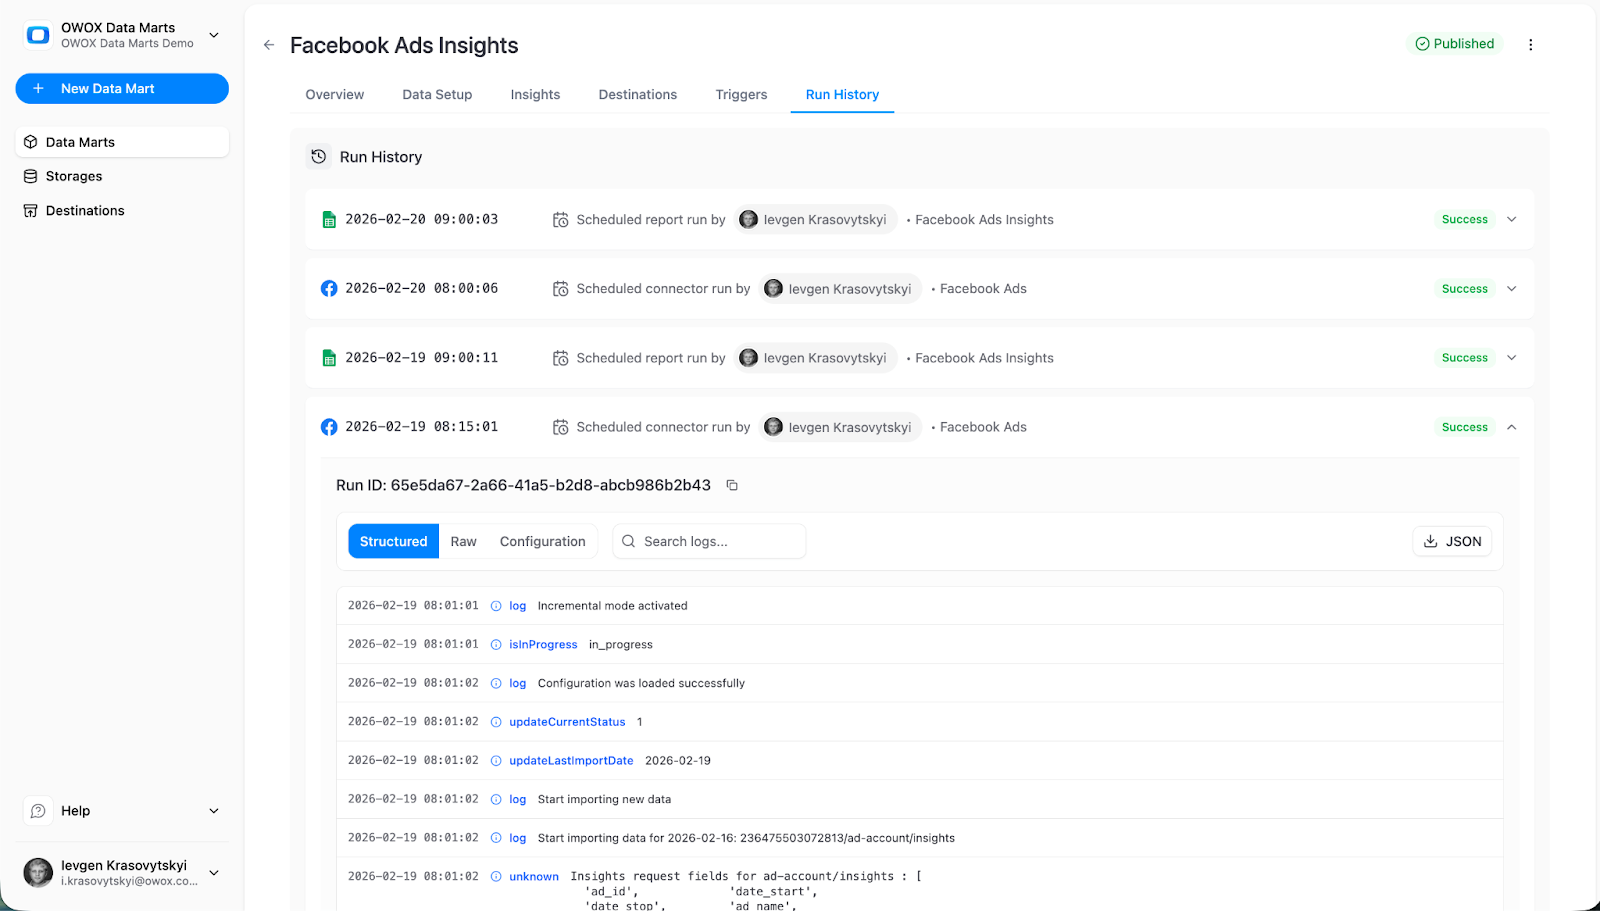
You can always see all the executions under the ‘Run history’ tab, as well as manage all of the triggers (you may have more than one) under the ‘Triggers’ tab.
This turns your Snowflake Google Sheets integration into a predictable pipeline: analysts design and govern the mart, then re-use it for multiple stakeholders across all of their reporting documents.
And look, Google Sheet will have all of the Aliases as the column names and Descriptions of the fields hidden inside the ‘Notes’. You will always know when the report was updated in the Note to the cell A1.
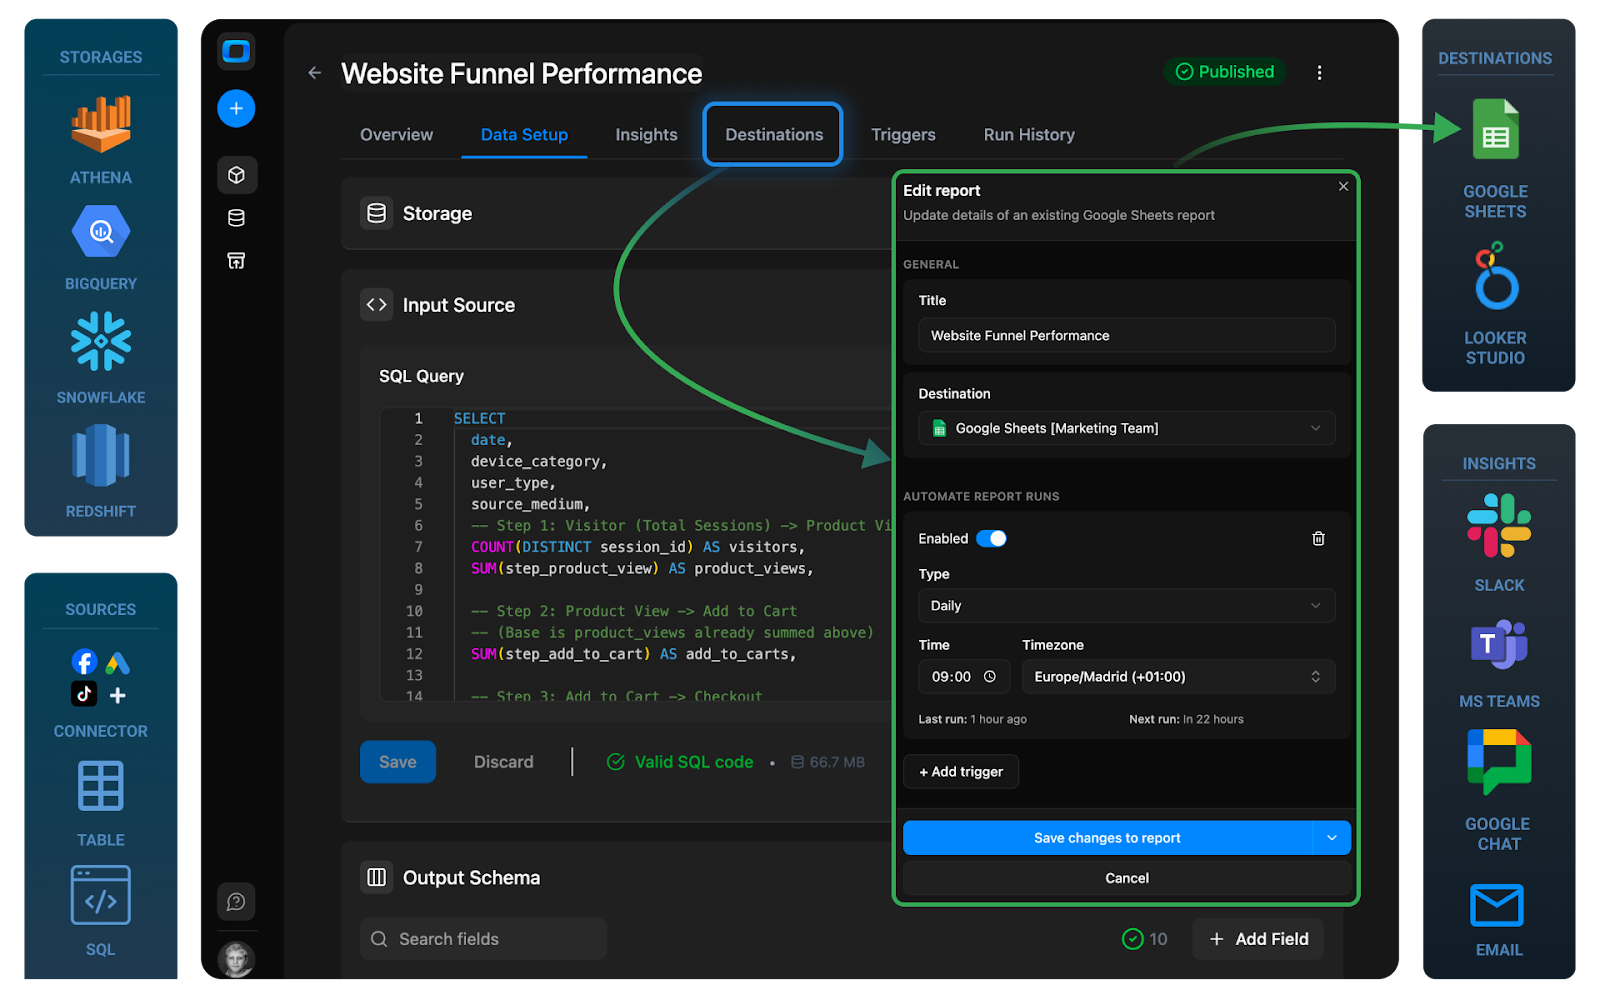
Once saved, this Report becomes the “contract” between your Snowflake Data Mart and a particular Sheets tab – consistent source, consistent destination, and no ad‑hoc, one-off CSV uploads in the middle.
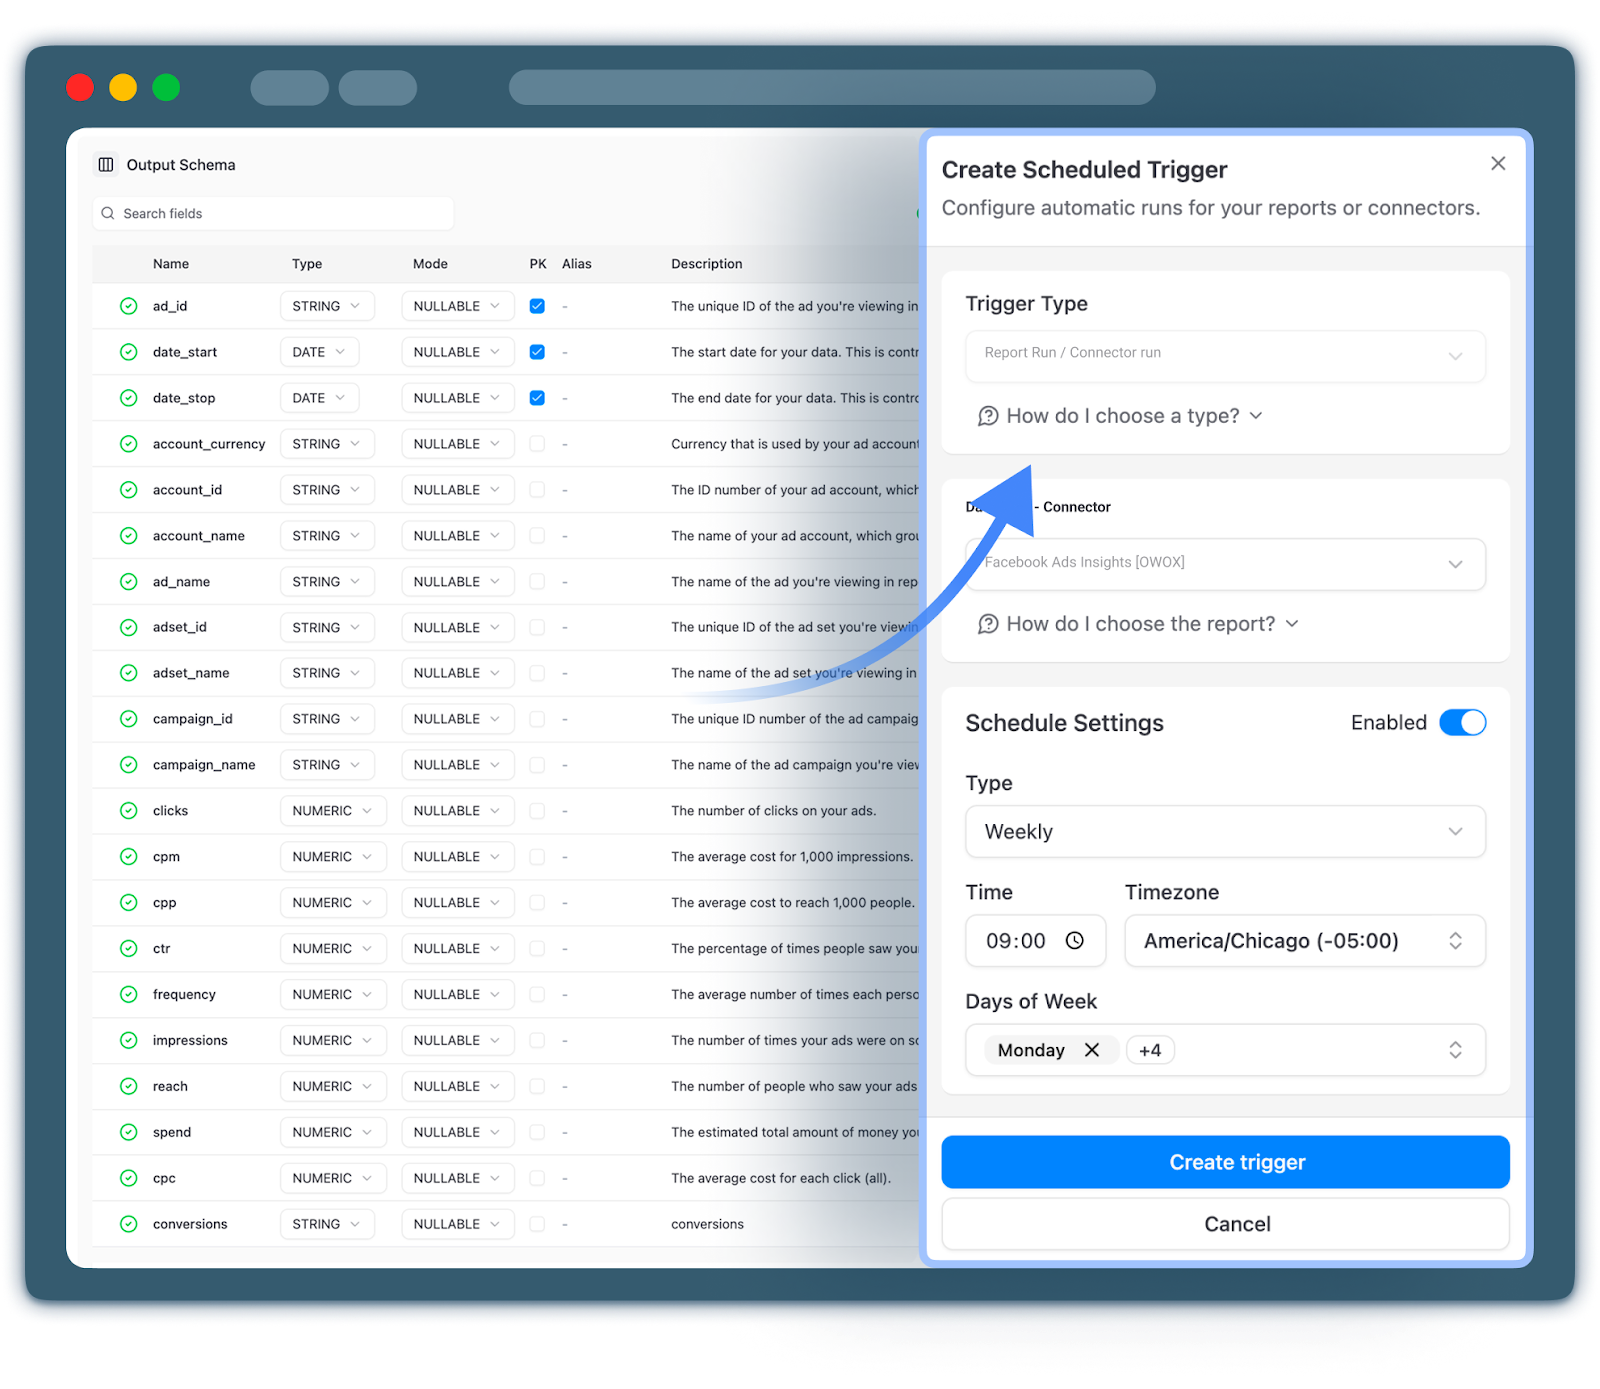
Step 5: Managing Refreshes with Report Triggers
Defining Data Marts and Reports is only half of the story. To truly automate Snowflake exports to Google Sheets and maintain a reliable governed reporting layer, you need scheduling, monitoring, and access control.
OWOX handles this with Triggers and Run History:
- Triggers define when a Report runs and pushes fresh data into Sheets.
- Run History shows what happened during each run: success, duration, row counts, and errors.
This combination lets you replace manual CSV refresh habits with predictable, auditable processes: scheduled report refresh instead of “who exported which file when”. If you want to configure this for you - sign up and explore OWOX free.
Setting Up Report Run Triggers for Daily, Weekly, or Interval-Based Refresh
Every Report in OWOX can be wired to one or more Run triggers that define how often it should refresh its destination (like a specific Google Sheets tab). This is where you turn a one-time export into a fully automated pipeline.
Typical scheduling patterns include:
Daily refresh:
- Ideal for operational dashboards, marketing performance reviews, or previous‑day revenue summaries.
- You choose the time of day (e.g., 7:00 AM in your timezone) so that Sheets are ready for morning standups.
Weekly refresh:
- Suited for strategic reviews, management reports, or cohort analyses that don’t need daily updates.
- You specify the day(s) of the week and time, aligning with internal reporting cycles.
Interval-based refresh (e.g., every N hours):
- Useful for use cases needing more frequent updates without going fully real‑time: performance campaigns, support load monitoring, etc.
- You define the interval (e.g., every 3 hours) and optionally set active time windows to avoid running at night.
To configure a trigger:
- Opening the Data Mart in OWOX.
- Navigating to the “Triggers” tab.
- Select the trigger type (Report Run).
- Set timezone, time, and recurrence details.
- Save.
Use Run History to Monitor Execution, Freshness, and Errors
Once reports are scheduled, analysts need visibility into whether they’re running as expected. That’s where Run History comes in. For each Data Mart, Run History shows:
- Timestamp of each run: So you can see exactly when a report last refreshed the Sheet.
- Execution status: Success, failure, or partial completion, with clear status indicators.
- Runtime and row counts: Useful for spotting performance regressions or suspicious changes in data volume.
- Error details: If a run fails (for example, due to an upstream schema change in Snowflake or a permission issue), you can inspect logs and error messages directly.
From an operational standpoint, Run History answers three critical questions:
- Is this Sheet up to date?
Business users can rely on “Last successful run” to know how fresh their numbers are. - Did anything break after a warehouse change?
Analytics engineers can correlate Snowflake changes with failed Report runs and address issues quickly. - Are we staying within performance and cost expectations?
Consistently growing runtimes or row counts can signal that a Data Mart or Report needs optimization.
This monitoring layer is critical when your Snowflake to Google Sheets reporting becomes central to decision-making across teams.
Best Practices for Structuring Sheet Tabs for Stakeholders
How you structure your Google Sheets tabs can make or break usability for business teams. A few patterns work particularly well when using OWOX Reports:
Separate “data” and “presentation” tabs:
- Use one or more tabs purely as data sinks for OWOX Reports (no manual edits).
- Build charts, pivots, and dashboards in separate tabs that reference these data ranges.
Use consistent naming conventions:
- Name data tabs clearly, e.g., dm_marketing_performance or dm_revenue_daily.
- Add a short description in the first row or a dedicated “README” tab explaining each data tab.
Avoid overwriting analytical formulas:
- Let OWOX own the data tabs; don’t place formulas or manual entries inside them if you’re using full overwrite mode.
- If you must calculate inside the data tab, keep formulas outside the range that OWOX writes to.
Design for growth:
- Assume row counts will grow over time. Use dynamic ranges (e.g., A:Z or named ranges) instead of fixed ranges like A1:Z500.
- Keep one Data Mart per tab where possible to avoid confusion about the origin and grain of the data.
Following these practices ensures that as your Snowflake to Google Sheets workflows scale, you preserve clarity, avoid accidental formula breakage, and keep Sheets easy to navigate for non-technical users.
Controlling Who Can Change Logic Versus Who Can Change Sheets
A key principle of a governed reporting layer is separating ownership of data logic from day‑to‑day usage in tools like Google Sheets.
In OWOX (Data Marts)
- Data analysts own Data Mart definitions: SQL, metrics, fields, and documentation.
- They also configure Reports and their triggers: which marts feed which Sheets, at what cadence.
In Google Sheets
- Business users – marketers, PMs, finance – own the dashboards, charts, and interpretations on top of the pushed data.
- They can add formulas, build pivot tables, or create charts, but they don’t change the underlying Data Mart logic.
This separation gives you:
- Control and auditability: Only authorized users can change metric definitions or expose new fields into Sheets.
- Flexibility for end users: Teams can customize their views in Sheets without risking accidental changes to shared definitions.
- Safer collaboration: Even if someone accidentally alters a formula or chart, the underlying data feed remains intact and governed in OWOX.
Combined with permissions in Snowflake and Google Workspace, this model keeps your critical logic centralized while still empowering self‑service analysis.
Avoiding CSV Exports and Metric Drift by Centralizing Updates
Finally, automation and governance only work if teams actually stop relying on manual workflows. The OWOX model helps you eliminate:
Ad-hoc CSV exports:
Scheduled Reports mean Sheets are always populated with up-to-date data from Snowflake. There’s no need for analysts to pull files and upload them manually – and no more hidden copies of “final_v3.csv” circulating in email.
Metric drift across spreadsheets
When Data Marts hold the canonical metric definitions and Reports are the only way data moves from Snowflake to Sheets, everyone consumes the same logic:
- One definition for revenue.
- One definition for active users.
- One attribution model for campaigns.
Shadow pipelines in formulas
Because updates are centralized in OWOX, any changes to definitions are applied consistently across all downstream Sheets on the next scheduled run.
This is the core benefit of using OWOX as a governed reporting layer on top of Snowflake: you automate Snowflake exports to Google Sheets in a way that’s reliable, observable, and consistent – and you avoid the slow slide back into fragmented CSVs and one-off connectors.
If you’re ready to centralize your updates and retire manual exports, you can get started with OWOX here.
Snowflake to Sheets in Action: ROAS Analysis for a Marketing Team
To see how this works end to end, let’s walk through a concrete Snowflake marketing reporting scenario: a performance team wants consistent, trustworthy Snowflake ROAS analysis in Sheets for paid campaigns across Google Ads, Meta, and other channels.
Instead of building custom SQL and exports for every request, you define a single ROAS-focused Data Mart in OWOX, document it thoroughly, and connect it to a set of Google Sheets tailored for different stakeholders.
Analysts stay in control of the SQL and logic; marketers get self-service analytics on Snowflake through familiar spreadsheets.
This example illustrates how governed Data Marts and Spreadsheet Reports translate into day-to-day marketing workflows – and how you avoid the usual tangle of CSVs and ad-hoc connectors.
SQL-Based ROAS Data Mart on Snowflake for Marketing Team
Start by designing a SQL-based Data Mart focused on the marketing performance questions your team actually asks: “What is ROAS by campaign, channel, and date?” and “How does performance differ by country or product line?”
In Snowflake, you likely already have:
- A spend or ad performance table with:
- date
- channel (google_ads, meta, etc.)
- campaign_id, campaign_name
- adset_id / adgroup_id
- clicks, impressions
- cost (in original currency and/or normalized)
- A conversions (from GA4) or orders (from CRM) table with:
- order_id or conversion_id
- order_date
- customer_id
- campaign_id / click_id / attribution key
- revenue
Your SQL-based ROAS Data Mart in OWOX should:
- Join spend to conversions using campaign- or click-level attribution logic.
- Normalize currencies to a single reporting currency (e.g., USD).
- Aggregate at a business-friendly grain, such as:
- One row per date, channel, campaign_id, and country.
- Calculate core metrics:
- spend
- revenue
- roas = revenue / spend
- cpc = spend / clicks (with safeguards against division by zero)
- ctr = clicks / impressions
- conversions
- conversion_rate = conversions / clicks
A SELECT clause might include dimension & metrics like:
- date
- channel
- campaign_id
- campaign_name
- country
- impressions
- clicks
- spend_usd
- conversions
- revenue_usd
- roas
- cpc
- ctr
- Conversion_rate
- optional: product_category, device_type
This SQL lives in the Data Mart definition. Once it’s stable, marketers don’t see the query – they see a clean, tabular output ready to land in Sheets.
Documenting Metrics and Dimensions So Marketers Understand
With the SQL in place, the next step is to make the Data Mart self-explanatory for non-technical users. In OWOX, you annotate each field so that marketers don’t have to guess what “roas” or “spend_usd” really mean. Here are a few of the best practices for documentation in this ROAS Data Mart:
Business-friendly aliases
- spend_usd → “Ad Spend (USD)”
- revenue_usd → “Revenue Attributed (USD)”
- roas → “ROAS (Revenue / Spend)”
- conversion_rate → “Conversion Rate (Conv / Clicks)”
Clear descriptions
- For ROAS: “Revenue from attributed orders divided by ad spend in the same period and campaign; excludes refunds and tax.”
- For Revenue: “Post-discount order revenue in USD, attributed using last-click campaign logic.”
Grain and keys
- Mark date, channel, campaign_id, and country as the combined primary key to clarify that each row is unique per day-campaign-country.
- Mark campaign_id as a join key to link with a separate “Campaign Metadata” mart if needed.
Data Mart Description
- “Includes only campaigns tagged with valid UTM structure.”
- “Data is updated daily at 7:00 AM; suitable for daily and weekly reporting, not for real-time optimization.”
When marketers open a Google Sheet powered by this Data Mart, these aliases and descriptions flow through into column headers and documentation, making self-serve exploration far easier and safer.
Connecting the ROAS Data Mart to Multiple Google Sheets for Different Stakeholders
Once the ROAS Data Mart is defined and documented, you can connect it to multiple Google Sheets – each tailored to a specific stakeholder group, but all drawing from the same governed source. Typical reuse patterns:
Performance marketing dashboard (team-level)
- Report 1 pushes the full ROAS dataset (all channels, all campaigns) into a “ROAS_Data” tab in a shared performance marketing Sheet.
- Marketers build pivot tables and charts by campaign, channel, and country, and create weekly optimization dashboards.
Executive summary (leadership-level)
- Report 2 adds a filtered view (e.g., top 50 campaigns by spend, or channel-level aggregates) into a separate “Exec_ROAS_Data” tab in a leadership-friendly Sheet.
- High-level KPIs are visualized without exposing campaign-level clutter.
Budget reconciliation (finance)
- Report 3 writes a simplified set of fields (date, channel, spend, revenue, ROAS) into a finance-owned Sheet.
- Finance uses this for budget vs. actuals comparisons and forecasting.
Because each Report references the same ROAS Data Mart:
- Any logic change (e.g., updated attribution window, new currency handling) is applied once at the mart level.
- All downstream Sheets pick up the change on the next scheduled run.
- There is no risk of one team quietly using outdated SQL.
This is the power of reusability: consistent metrics, different views.
Frequently asked questions
.png)


Finally, a tool that doesn't ask business users to learn a new dashboarding UI. Our marketing team already knows Sheets. OWOX just delivers the right data.
Joinable data marts concept was the thing that sold us. We can now use the semantic layer without building one.
Self-hosted the OSS version on Digital Ocean. Zero vendor lock-in. Contributed a Shopify connector back in week two.