What is the ROPO effect and how to measure it
ROPO means research online, purchase offline. Learn why it hides the value of online ads and how to measure it by matching web sessions to store purchases.
The ROPO effect (research online, purchase offline) is when customers find and compare products on your website or in your ads and then buy them in a physical store. Because the sale is recorded at the store’s till rather than in web analytics, online channels look less profitable than they really are, and campaigns that drive store sales can get switched off. You measure ROPO by matching online sessions to offline purchases through an identifier both sides share, such as a loyalty card number, phone number or email, and joining the two datasets in your warehouse.
This article explains why ROPO matters, which categories it affects most, how to use ROPO data, and the stages of a ROPO analysis, from collecting data to the reports you build on it.
Originally published in March 2019. Updated in October 2026: removed retired product sections and rewrote the measurement steps around your own warehouse.
Companies that don’t track the relationship between online and offline customer behavior risk reducing their sales, for example by disabling advertising that, at first glance, doesn’t pay off. The same thing happens to omnichannel internet marketers who don’t conduct ROPO analysis: undervalued online marketing is just the tip of the iceberg.
What is the ROPO effect

Let’s start with the theory. ROPO (research online, purchase offline) describes the behavior of customers who look for products on the internet and buy them in physical stores. Nowadays, 99% of consumers are set on a digital journey before going to a physical store. Why?
There are several reasons why customers do this:
- It’s more convenient to compare prices and features and read reviews on the website.
- People want to evaluate goods by holding them in their hands, checking how they work, and trying them on.
- Some customers want to get things here and now.
- The type of product: Few people make very expensive or very cheap purchases on the internet.
- Habit or lack of confidence in the security of online payments.
It’s clear that the share of ROPO purchases varies depending on the specifics of the business, the market, the region, the mentality and age of users, etc.
However, numerous studies have shown that the percentage of such purchases is too large to ignore:
- According to a study by Ibi and the University of Regensburg, 82% of Germans study product information on the Internet before buying.
- A survey of Australian users by Barilliance showed that 21% always check out a product online before making an offline purchase, and 71% do so from time to time.
- According to Consumergravity, 81% of consumers worldwide research products online before buying.
Significance of the ROPO effect for retail businesses
Significance of the ROPO effect for retail businesses

Ignoring the ROPO (Research Online, Purchase Offline) effect in your sales, marketing, advertising, and pricing strategies means overlooking a crucial aspect of your product range.
ROPO, far from being just a trendy term, significantly boosts revenue. The following statistics highlight its impact:
- An overwhelming 99% of consumers engage in online research before visiting a physical store.
- A substantial 77% of consumers specifically look for websites that offer product ratings and reviews during their online research.
- Product reviews have a major influence, with 90% of buyers considering them as a key factor in their purchasing decisions.
- More than half of consumers, 56%, prefer a tactile shopping experience, choosing to see, touch, and feel products in person before buying.
Integrating ROPO strategies into your existing business plan opens up numerous opportunities for increasing sales, expanding your market reach, and maintaining a competitive edge in today’s dynamic marketplace.
Consider a scenario where your online marketing team aims to increase digital sales. Without acknowledging the ROPO effect, they might stop advertising products that don’t generate significant online sales. However, by factoring in the ROPO effect, you might discover that some items, like sports equipment, may have low online sales but significantly boost in-store traffic.
Here’s an alternative example: Imagine a furniture store sells both decorative items and large furniture pieces. Online data shows high sales for decorative items but fewer for large furniture. Without considering the ROPO effect, you might conclude that decorative items are more popular and allocate more advertising budget to them.
However, in-store data could reveal that while customers browse decorative items online, they prefer to purchase large furniture pieces in-store after seeing and testing them. In this case, even if online sales for large furniture are low, these products are essential drivers of in-store traffic.
Understanding the ROPO effect helps recognize that certain products, although not selling well online, are crucial in driving customers to physical stores. This insight can lead to a more balanced advertising strategy that supports both online and offline sales channels.
-
Additionally, having customers in-store increases opportunities for additional sales and customer engagement.
-
Adapting your strategy to accommodate the ROPO effect allows you to view your product assortment as a unified channel, where your online presence complements your physical store, enhancing the overall customer experience and sales potential.
OWOX Data Marts
See your first report built in real time. 15 minutes.
- Connect your data warehouse
- Pick your metrics
- Get a live Google Sheets report
In the time it takes to write a ticket. Then imagine never writing that ticket again.
Book a DemoWe'll use your actual use case
Categories most affected by the ROPO effect
Categories most affected by the ROPO effect

In the ROPO effect, not all product categories are influenced equally. Generally, categories most impacted by ROPO tend to involve products where tactile or experiential qualities are significant. Below are some key categories that are notably affected by the ROPO effect:
- ✅ Fashion: Highly susceptible to the ROPO effect, fashion items often require customers to try them on for size and fit before purchasing. Despite the growth of online fashion retail, physical stores remain popular due to the tactile nature of clothing shopping and the convenience of avoiding returns via mail.
- ✅ Beauty Products: This category experiences a significant ROPO effect, with many consumers preferring in-store purchases. The beauty retail space often includes hands-on experiences with products, aided by sales consultants and makeup artists who provide demonstrations and advice, enhancing the in-store buying experience.
- ✅ Sports Retail: Sports equipment and apparel are greatly influenced by the ROPO effect. Customers typically research these items online but visit stores to try or test them, especially if it’s a first-time purchase.
- ✅ Household Items: Both large and small household items are responsive to ROPO. For smaller, everyday items like kitchen tools or light bulbs, the immediate need often leads consumers to check availability online and then purchase in-store for convenience.
- ✅ Furniture and Lighting: This category is crucial for the ROPO effect. Assessing the look and feel of furniture and lighting fixtures is challenging online, leading many customers to visit stores to examine these high-ticket, bulky items before making a purchase, especially given the complexities of delivery and assembly.
Challenges of the ROPO effect

While the ROPO (Research Online, Purchase Offline) effect is a voluntary choice for consumers, it comes with its own set of challenges:
- ⚠️ Tracking the effectiveness of digital marketing efforts becomes complex, as the main conversion point – the actual purchase – happens offline and is hard to quantify.
- ⚠️ Retailers need to invest in both digital and physical aspects of their business. This includes maintaining an appealing and functional website, implementing email marketing strategies, and managing databases, as well as investing in physical store aspects like location, decoration, and staff.
- ⚠️ For businesses with an e-commerce platform, the ROPO effect can pose a risk to online sales. Countermeasures might include offering additional benefits to discourage the ROPO effect, such as reducing or eliminating shipping costs or offering easy returns.
These challenges highlight the need for a balanced approach in managing both online and offline facets of a business in response to the ROPO effect.
How to use information about ROPO purchases
How to use information about ROPO purchases
How you should use the results of ROPO analysis depends on the goals you want to achieve. Do you want to find out the real effectiveness of your online channels, improve advertising campaigns and save money, increase sales online or offline, or increase profits? Let’s consider each of these goals in more detail.
1. Find out the real value of advertising channels
So you’ve made sure that a sufficiently large percentage of users who study goods on your site go buy them in retail stores. Because of this, it’s difficult to calculate the exact conversion and payback of online advertising, which could lead to poor decisions.
If a product sells poorly online, don’t rush to remove it from the site or turn off the advertising campaign. It may turn out that sales of this product offline are three times higher than online. Compare the activity of website visitors with purchases in physical stores and you’ll find out whether you’re wasting your money or sitting on a gold mine.
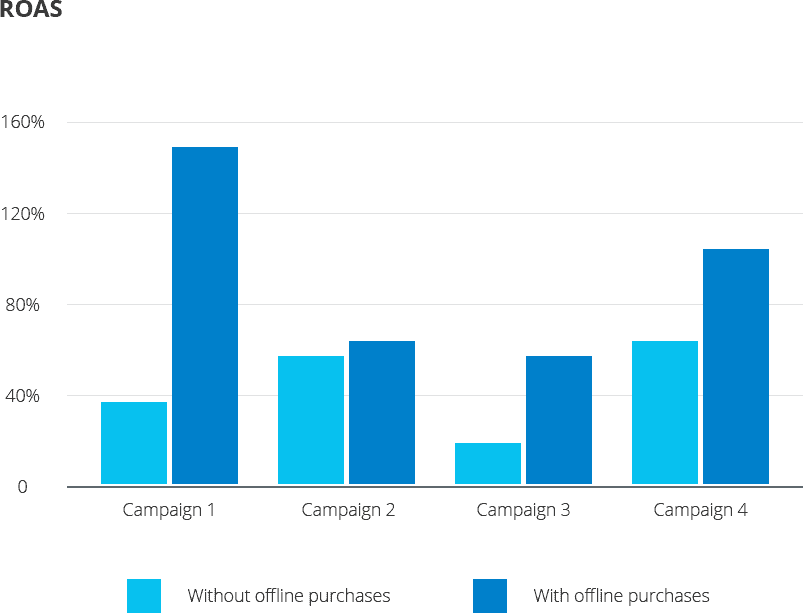
When you determine the share of ROPO sales, you can go ahead and calculate the ROAS of any advertising channel or campaign based on offline purchases. This may show a completely different picture.
2. Improve marketing campaigns
Only by studying the customer journey can you make advertising campaigns as effective as possible. Suppose you’ve configured an automated email for abandoned shopping carts. Some customers may use the shopping cart as a shopping list and then go and shop in a physical store. By identifying such users, you can exclude them from these reminder emails and save money.
3. Increase profits
People who look at your site before they purchase tend to spend more than those who don’t. Having determined which products on your site sell well according to the ROPO principle, you can focus on promoting them and thereby increase your profits.
4. Improve the site and increase online sales
If you conduct an ROPO analysis and find that your customers prefer to buy certain products in retail stores, you should think about what’s wrong with your website. Why don’t customers, or why can’t customers, buy online, instead of going to your store (hopefully) or even to your partners or competitors? There may be various reasons for this behavior:
- ⚠️ Prices online and offline are different.
- ⚠️ Some functionality isn’t available on the site, for example, it’s impossible to pay in installments.
- ⚠️ Delivery takes too long.
- ⚠️ There’s a complex interface or a long payment process.
After examining the behavior of your users in detail, you’ll be able to understand what prevents them from making purchases on the site and fix it by:
- ✅ offering discounts in the online store
- ✅ offering an additional warranty or free or fast delivery
- ✅ providing convenient payment methods
- ✅ adding a section with frequently asked questions
- ✅ providing information on how to contact you.
In short, you can adapt your website to the customer’s custom path.
Stages of conducting ROPO analysis
Stages of conducting ROPO analysis

Conceptually, there are two ways to assess the impact of online advertising on offline sales. The first is based on identifying specific users and linking the actions of visitors on the site with purchases in a physical store. For this to happen, users must be identifiable on both sides: logged in on the site, and known at the till through a loyalty card, phone number or email.
The second solution is so-called impersonal data fusion. You can use impersonal data fusion to assess the impact of television advertising on offline sales or in the event that your site doesn’t let users register. Similar tasks are for those who advertise products sold on Amazon or other marketplaces on Facebook. In such cases, it’s impossible to associate conversions from advertisements and banner views with orders for particular users. This problem is solved using indirect correlation, which is a topic for a separate article.
In this article, we’ll focus on identifying specific users, which is a priority for any business. Doing so provides an estimate of the effectiveness of online advertising based on a combination of user actions both online and offline.
The main stages of identifying users:
- Combine online data with transaction data from your CRM.
- Identify a segment of ROPO purchases and understand the share of these purchases in relation to online and offline sales.
- Build dashboards for high-level monitoring of data and its dynamics.
- Build detailed tables for agencies so they can use ROPO data in their media planning and track results.
- Find answers to these questions: Do ROPO buyers order through the website? What prevents them from initially placing an order on the site? How can you save on remarketing to these customers?
Stage 1: Plan how to merge online and offline data
Merging online and offline data is a critical process for businesses seeking to gain comprehensive insights into customer behavior, marketing effectiveness, and overall operational efficiency.
To merge online and offline data effectively for ROPO analysis, plan the work in your warehouse (Google BigQuery, Snowflake, AWS Redshift, AWS Athena or Databricks):
-
Data Collection and Storage: Store both online and offline transaction data in the warehouse, ensuring each transaction (both paid and unpaid) is assigned a unique identifier, such as transaction_ID.
-
Linking Online Transactions: Utilize transaction_ID to connect online transaction data with corresponding order details, identifying completed online orders.
-
Integrating Offline Purchase Data: Merge offline purchase data with online session data using user_ID as the key, revealing online activity for customers who made offline purchases.
-
ROPO Analysis Scheme: Categorize each transaction as Online, Offline, or ROPO based on the presence of online session data and the location of the purchase.
-
Session Data Analysis: Investigate the data of customer sessions to identify the last session’s source before a purchase, understanding the influencing factors for each transaction.
-
Time Analysis Between Session and Purchase: Calculate the time span between the last website session and the actual purchase to differentiate between online, offline, and ROPO transactions.
-
Geolocation Analysis: Determine the geolocation of the last session, providing insights into where decisions for purchases were made, especially for ROPO transactions.
A cloud warehouse doesn’t require investment in hardware and makes it easy to combine data regardless of volume, so as your data grows you won’t need to change all your queries and settings.
In addition, a warehouse supports data reprocessing. If a customer makes an order offline and then goes to the site and logs in, you can retroactively combine all their actions. That’s not possible with Google Analytics 4.
Stage 2: Collect relevant data for ROPO analysis
You’ll need to collect 3 types of data for conducting a proper ROPO analysis: user behavior data from the website, advertising cost data, and revenue data from the CRM/ERP system.
1. On-site analytics data
If you’re using GA4, you can export user behavior data from Google Analytics 4 to Google BigQuery using standard export. It’s free on the analytics side; you’ll just need to pay for data processing in BigQuery.
Note: It’s necessary to verify the source data. You must have configured and transferred from the site to Google Analytics 4 the User ID (or another common user ID). Since the data will be connected precisely by this ID, it’s important that it’s present in both tables and is correct. Make sure the same ID isn’t used by multiple users. Check the percentage of users with a User ID and the values themselves over time to see if there are any anomalies. For this purpose, it’s possible to build a segment of users with IDs in Google Analytics 4 and look at how this segment correlates with the total number of users.
Also check for anomalies in data on the number of sessions, users, transactions, and income by day and by traffic source. The easiest way to do this is in the GA4 interface: take a time interval of several months and look at the standard acquisition and ecommerce reports. Check if these reports have unreasonable peaks or failures.
You’ll also need to sessionize the raw data: group the tracked events into sessions so user interactions are grouped correctly.
2. Advertising cost data
If you want to not only find out the share of ROPO purchases but also calculate their ROAS, you’ll need cost data from your advertising sources. Here is how you can import your expenses from different services into Google BigQuery.
3. Offline orders data
You can import orders from your CRM to the warehouse one time or set up a scheduled upload to regularly calculate the share of ROPO purchases.
Here is the list of required fields you need to have in the table uploaded from your CRM/ERP system:
- Date of the transaction
- Transaction ID
- Order price
- User ID
Additional fields that will allow you to get reports in additional sections:
- City
- Item ID
- Number of items in the order
- Price of each item
- Payment type
- Delivery type
- Order status
With CRM data, pay attention to:
- Availability of all required fields
- Availability of data for all days
- Comparable format for date, income, and city
- Presence of the User ID parameter in all transactions
- Duplicate transactions
Stage 3: Link user actions on the site and offline
After you collect all the data in your warehouse, you link it with SQL. Match each offline order to a known customer by the identifier recorded at the till, such as a loyalty card number, phone number or email (hashed), then join that customer’s User ID to their website sessions. Every order then gets a label: online, offline only, or ROPO, when the customer had a session within the conversion window before buying in store.
The labelling is one query. The version below runs as printed in Google BigQuery; the three CTEs stand in for your CRM orders, the table that maps loyalty cards to User IDs, and the GA4 sessions export:
WITH orders AS (
  -- stands in for CRM orders: online ones come from the site,
  -- store ones the loyalty card scanned at the till
  SELECT 'T-101' AS order_id, DATE '2026-09-03' AS order_date,
         'online' AS channel, CAST(NULL AS STRING) AS loyalty_card,
         120.0 AS revenue
  UNION ALL SELECT 'T-102', '2026-09-05', 'store', 'LC-7', 340.0
  UNION ALL SELECT 'T-103', '2026-09-06', 'store', 'LC-9', 85.0
  UNION ALL SELECT 'T-104', '2026-09-12', 'store', 'LC-4', 510.0
  UNION ALL SELECT 'T-105', '2026-09-20', 'store', NULL, 60.0
),
customers AS (
  -- loyalty card -> the User ID sent to GA4 on login
  SELECT 'LC-7' AS loyalty_card, 'U-22' AS user_id
  UNION ALL SELECT 'LC-9', 'U-31'
  UNION ALL SELECT 'LC-4', 'U-48'
),
sessions AS (
  -- stands in for GA4 sessions exported to BigQuery
  SELECT 'U-22' AS user_id, DATE '2026-08-29' AS session_date,
         'facebook / cpc' AS source_medium
  UNION ALL SELECT 'U-22', '2026-09-04', 'google / organic'
  UNION ALL SELECT 'U-48', '2026-07-30', 'google / cpc'
),
labelled AS (
  SELECT o.order_id, o.channel, o.loyalty_card, o.revenue,
    COUNT(s.session_date) AS sessions_in_window,
    ARRAY_AGG(s.source_medium IGNORE NULLS
      ORDER BY s.session_date LIMIT 1)[SAFE_OFFSET(0)]
      AS first_source
  FROM orders AS o
  LEFT JOIN customers AS c USING (loyalty_card)
  LEFT JOIN sessions AS s
    ON s.user_id = c.user_id
   -- the 30-day conversion window
   AND s.session_date BETWEEN
       DATE_SUB(o.order_date, INTERVAL 30 DAY) AND o.order_date
  GROUP BY o.order_id, o.channel, o.loyalty_card, o.revenue
)
SELECT order_id, revenue,
  CASE
    WHEN channel = 'online' THEN 'online'
    WHEN loyalty_card IS NULL THEN 'store, not identified'
    WHEN sessions_in_window > 0 THEN 'ROPO'
    ELSE 'offline only'
  END AS label,
  first_source
FROM labelled
ORDER BY order_id| order_id | revenue | label | first_source |
|---|---|---|---|
| T-101 | 120 | online | |
| T-102 | 340 | ROPO | facebook / cpc |
| T-103 | 85 | offline only | |
| T-104 | 510 | offline only | |
| T-105 | 60 | store, not identified |
Two rows carry the lessons. T-104’s customer did visit the site, but 44 days before buying, outside the 30-day window, so the window you pick moves orders in and out of ROPO; report it next to the share. T-105 was paid without a loyalty card, so nobody can say whether it was ROPO. Keep those orders as their own label rather than folding them into “offline only”: the ROPO share you report is a floor, and the unidentified share tells you how far below the truth it may sit. And in T-102, the first-source column gives the paid Facebook session that opened the journey credit for a $340 store sale the platform never saw.
You can find a detailed instruction on how to setup UserID in GA4 in this complete guide.
This unique identifier, which can be associated with a user’s email address or loyalty card, is assigned to each user in your database. When users log into your website and access their personal account, their User ID is transmitted to GA4, assuming you have configured this functionality.
This process enables the connection of individual user actions on your website with their corresponding User ID, thereby facilitating a more comprehensive and cross-device analysis of user behavior in the warehouse.
In order to recognize as many of your users as possible, you can offer bonuses for logging in: discounts for logging in, useful downloadable materials, promotions, etc.
You can also add a URL parameter carrying the CRM User ID to links you send to your customers by email. This will help you identify a user even if they haven’t logged in on the site. For example, say you already have a customer in your CRM with an email and a unique User ID. You send an email to this customer with a link that includes the ID. The customer clicks on the link and goes to your website and performs some actions on the site without registering. Through Google Tag Manager, you can transfer this identifier to Google Analytics 4 in the UserID or a custom dimension.
If the user leaves a request on your site and then comes to the store and makes a purchase, you can link their actions using the transaction ID.
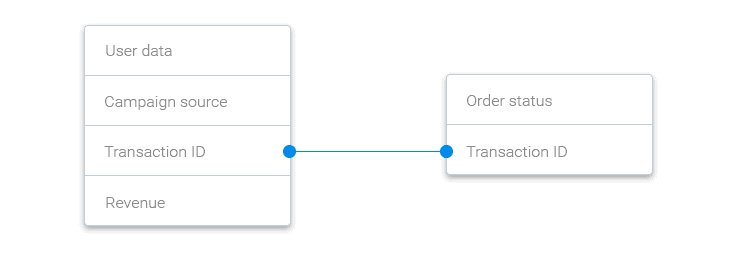
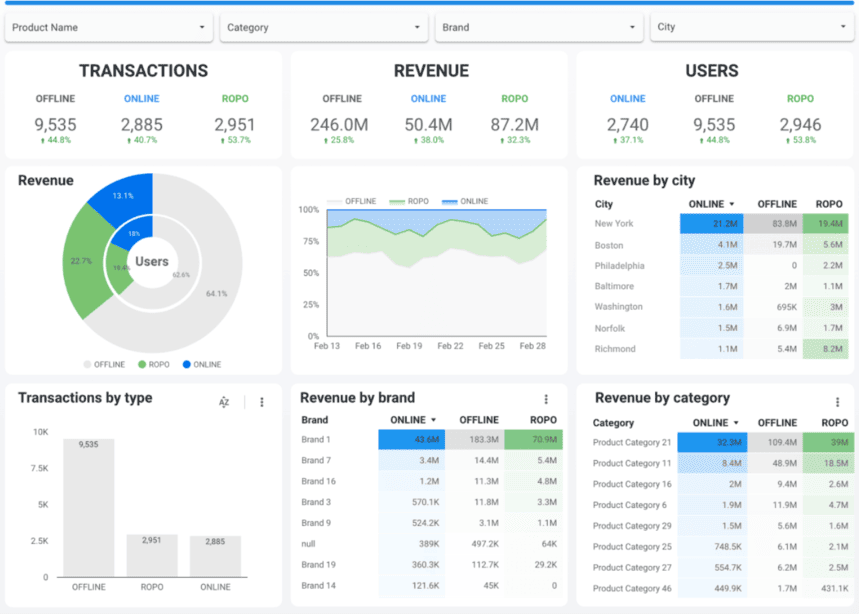
In the diagram above, you can see data on user behavior on the site (left) and data on the purchase from the CRM (right).
With OWOX Data Marts, an analyst can publish this matching SQL over your warehouse as Data Marts, so ROPO reports in and dashboards, and AI questions, all read the same definition of a ROPO purchase.
If you’re interested in the technical details of data integration and ROPO analysis, read some of our customers’ success stories:
- Darjeeling’s Success Story: ROPO Analysis Proves that 40% of Customers Visit the Company’s Website before Buying Offline
- Fabelio found out what online customers are doing in their retail stores
- How to identify ROPO: online influence on offline purchases
- ROPO analysis: How useful is it for omnichannel marketing analytics
- How to measure the ROPO effect for an omnichannel retailer
The reverse: offline ads that drive online sales
The reverse: offline ads that drive online sales
ROPO is research online, buy offline. The opposite also happens and is just as invisible to click-based reports: someone sees a TV spot, a billboard or a radio ad and later buys on your website, arriving as direct or branded search traffic. Last-click attribution credits that sale to “direct” or to your brand keywords, and the offline campaign looks like it did nothing.
Four ways to measure it, from cheapest to most reliable:
| Method | How it works | Watch out for |
|---|---|---|
| Spike analysis | compare online sessions and orders in the minutes or hours after each airing with the same slot on days without one | needs timestamps finer than a day; works for TV and radio, not for outdoor |
| Branded search and direct baseline | track branded search volume and direct sessions against a baseline before and during the campaign | seasonality and other campaigns move the same baseline |
| Geographic holdout | run the campaign in some regions only and compare online sales per region with the regions left out | needs regional ad buying and enough sales per region |
| Marketing mix modeling | regress weekly online sales on spend by channel, including offline, with carryover and saturation | needs two or more years of weekly data; see marketing mix modeling |
Promo codes and campaign-specific URLs help, but only as a floor: most people who see an offline ad never type the code.
The data side is the same as for ROPO. Online sessions and orders, with time and region, sit next to the offline media plan in your warehouse, so the comparison is a query rather than a spreadsheet exercise.
ROPO marketing strategies for increasing conversion rates
ROPO marketing strategies for increasing conversion rates
ROPO (Research Online, Purchase Offline) marketing strategies are essential for businesses looking to optimize the bridge between online browsing and in-store purchasing. These strategies focus on understanding and leveraging consumer behavior that begins in the digital space but culminates in physical transactions.
Implementing a loyalty program
Utilizing loyalty cards is an effective way to track customer interactions across various channels. These cards can collect essential customer information like contact details and preferences. In North America, as of 2023, there were an estimated 3.3 billion loyalty program memberships, an increase from 2.9 billion in 2021. Offering incentives, similar to Sephora’s Beauty Insider program, which rewards customers with points for purchases, can encourage participation.
Such programs not only gather data but also allow for personalized online experiences based on in-store behavior, enhancing the overall customer journey and boosting ROPO.
Leveraging social advertising
Social ads often start a purchase that ends in a store. To see it, match the customers who clicked or were reached by a campaign to your offline orders, using the same hashed email or phone you use for the store data, and compare their store purchases with customers the campaign did not reach.
Cultivating positive online reviews
Building a strong base of positive reviews is crucial for increasing brand trust and, consequently, your ROPO rate. Excellent customer service is key to achieving this.
Around 49% of customers trust online reviews as much as personal recommendations. Encouraging reviews through reminders, post-purchase emails, and follow-ups can significantly enhance your online reputation. Addressing negative reviews professionally and empathetically is equally important, as it demonstrates your commitment to customer satisfaction, fostering trust and loyalty among your audience.
ROPO reports to build
Once online sessions and offline orders are linked in your warehouse, you can visualize the result in a spreadsheet or a ROPO dashboard. Here are some examples of ROPO reports:
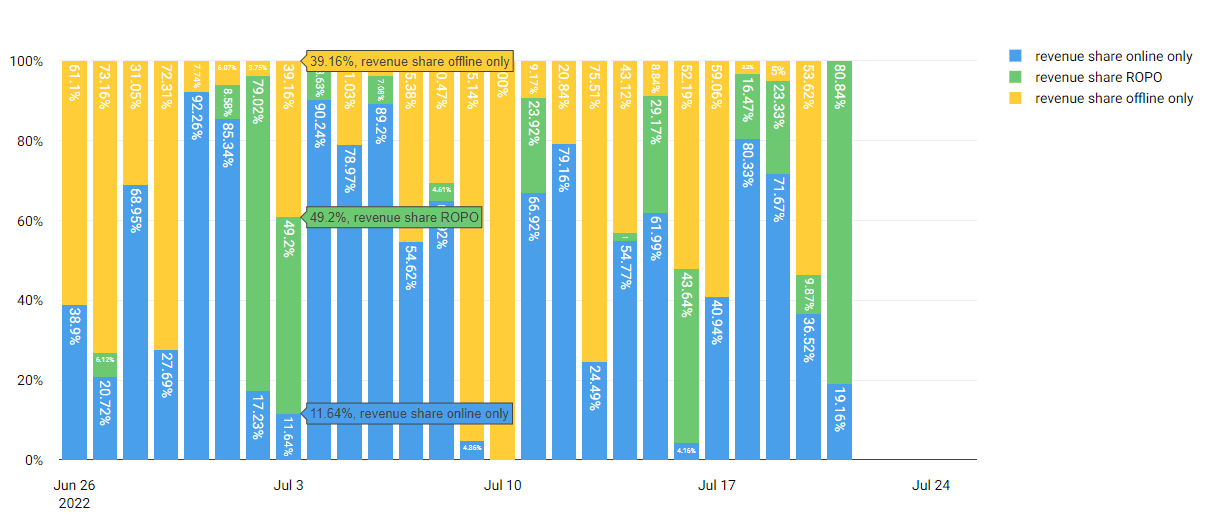
1. Change in ROPO share of income by day for the last 30 days with a 30-day conversion window
The 30-day conversion window means that a maximum of 30 days have passed between the user last visiting the site and making an offline purchase. The conversion window can be changed to suit your business.
This report shows how revenue is distributed between online, offline, and ROPO sales. It helps to separate ROPO orders from regular offline purchases and to understand the real role of the ROPO effect in your multi-channel sales.
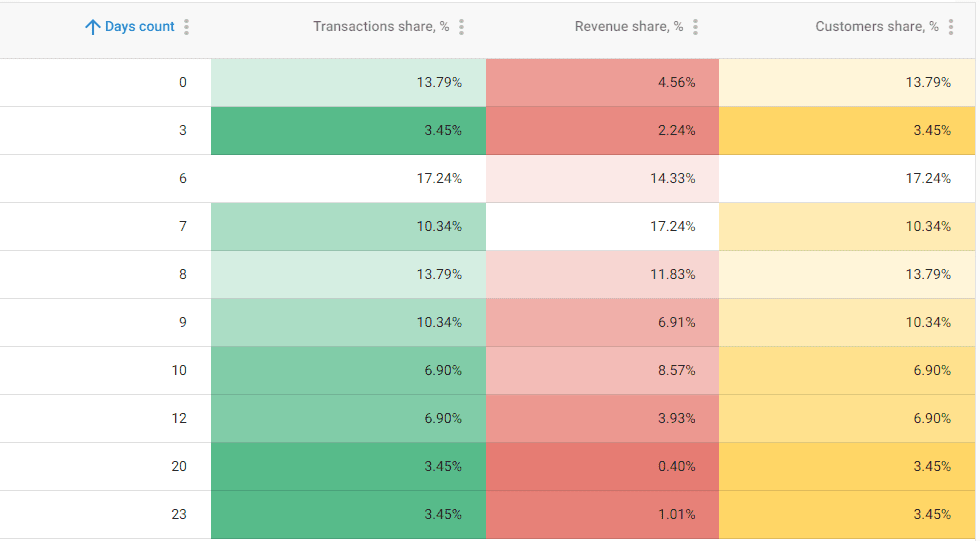
2. Share of transactions, income, and customers by number of days between the first online session and the ROPO purchase over the past 30 days with a 30-day conversion window
This is an analog of the Time to Conversion report (Time Lag) in Google Analytics, only here online actions and offline purchases are related. This report shows what percentage or number of transactions, customers, and revenue fall on each day within the conversion window.
This will help you understand the real conversion window for ROPO purchases as well as track the relationship between the transaction value and the number of days users need to make a purchasing decision.
3. Transactions on the first sources and channels before the ROPO purchase in the last 30 days with a 30-day conversion window
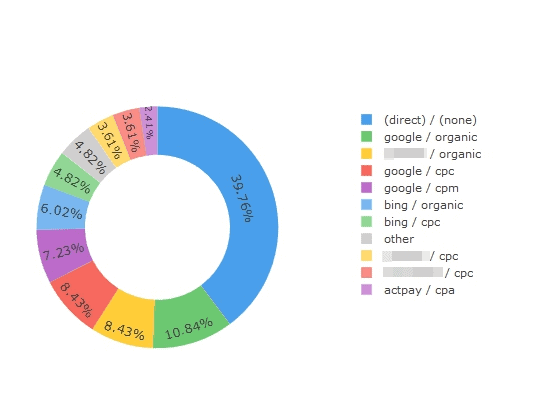
With this report, you can determine which online channels, sources, and ad campaigns lead to offline purchases.
Key takeaways
You may ask, how accurate are the results of ROPO analysis if only users registered on the site are considered? This is a good question, and to answer it, you need to understand how many users there are. It’s difficult to get an exact answer for a specific site. If a user isn’t logged in, we don’t know for sure whether he was on the website. Unless it’s possible to use panel research.
Only part of your buyers will ever be matched: those who sign in on the site and identify themselves at the till. The share varies by retailer and rises during seasonal sales, when loyalty cards and online accounts are used more. The main thing is that even without a 100 percent audience pool, you can get a representative sample for budget redistribution. This means that you don’t need to combine the actions of each user; you only need to combine the data of a sufficient number of users to build reports.
Turn your data into decisions.
Governed data marts give you the clean foundation ML needs to actually work.
- No AI hallucinations
- Analyst-governed definitions
- Every number traces to SQL
Frequently Asked Questions
What Data is Essential for Conducting Effective ROPO Analysis?
Essential data for ROPO analysis includes user behavior data on the website, offline order data from CRM systems, and data on advertising expenses. Merging these data sets allows for a comprehensive view of how online behaviors translate into offline purchases.
How Can Retailers Use ROPO Analysis to Improve Business?
By conducting ROPO analysis, retailers can more accurately measure the value of advertising channels, improve marketing campaigns, increase profits, and enhance their websites to encourage online sales. This analysis helps in understanding customer preferences and adjusting strategies accordingly.
What are the Main Challenges Retailers Face Due to the ROPO Effect?
Retailers struggle with tracking the effectiveness of digital marketing efforts, as the main conversion happens offline. They also face the challenge of investing in both online presence and physical stores, and the risk of the ROPO effect impacting e-commerce sales.
Which Product Categories are Most Affected by the ROPO Effect?
Categories most impacted by the ROPO effect typically include fashion, beauty products, sports retail, household items, and furniture and lighting. These categories often involve products where physical examination or trials are preferred before purchase.
How Does the ROPO Effect Influence Retail Marketing Strategies?
Retailers need to account for the ROPO effect by integrating their online and offline marketing strategies. This approach ensures that online marketing efforts are not undervalued and that investments in digital channels are accurately reflected in their contribution to offline sales.
What is ROPO Analysis and Why is it Important?
ROPO analysis involves understanding the impact of online research on offline purchases. It's crucial because it helps businesses recognize how online marketing efforts contribute to in-store sales, enabling more accurate assessment and optimization of advertising and marketing strategies.